
Key Insights
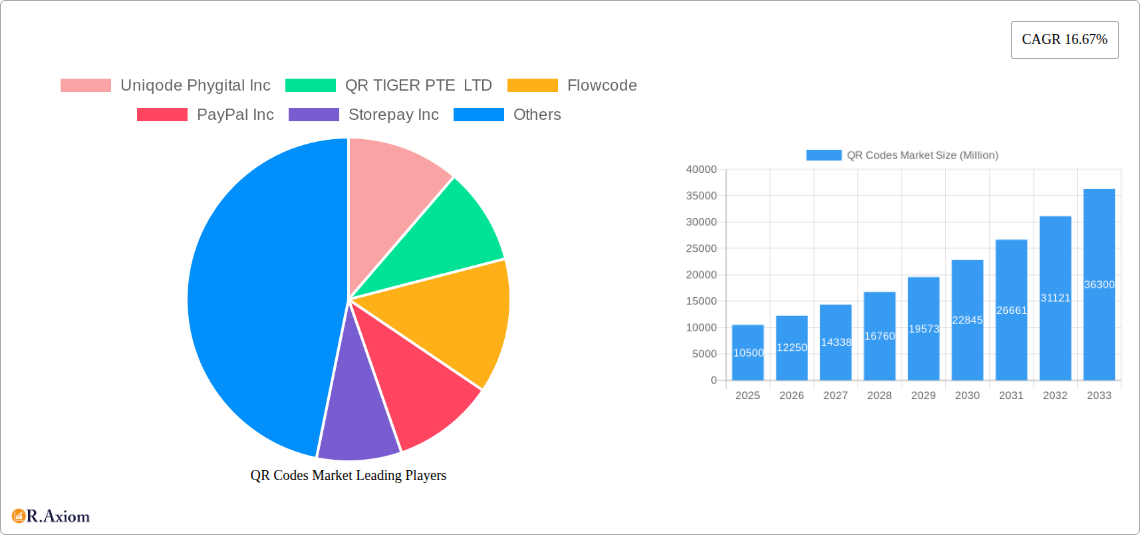
The QR Code market is experiencing robust growth, projected to reach $10.5 billion in 2025 and exhibiting a Compound Annual Growth Rate (CAGR) of 16.67% from 2025 to 2033. This expansion is fueled by several key drivers. The increasing adoption of mobile payment systems globally is significantly boosting QR code usage for transactions, particularly in emerging markets with high smartphone penetration and underdeveloped traditional banking infrastructure. Furthermore, the pandemic accelerated the shift towards contactless solutions, solidifying the QR code's position as a vital tool for businesses seeking efficient and safe customer engagement. The integration of QR codes into marketing campaigns, loyalty programs, and product information enhances brand experiences and facilitates data collection for improved customer relationship management. The ongoing evolution of QR code technology, including dynamic QR codes that allow for content updates and improved tracking capabilities, continues to drive market expansion. Competition is fierce among key players such as Uniqode Phygital Inc, QR TIGER PTE LTD, and PayPal Inc, leading to continuous innovation and market penetration strategies.
However, certain restraints also exist. Security concerns regarding data breaches and fraudulent activities using QR codes remain a challenge, requiring robust security protocols and user education to mitigate risks. The reliance on smartphone technology creates a barrier for individuals without access to these devices, limiting market reach in certain regions. Furthermore, the effectiveness of QR code marketing campaigns can vary greatly depending on factors such as effective placement and target audience engagement. To fully capture the market potential, overcoming these restraints through improved security measures, targeted marketing, and outreach programs to under-served populations will be crucial for sustaining the current positive growth trajectory. The market segmentation is evolving, moving beyond basic static QR codes to include more complex and specialized functionalities.
QR Codes Market: A Comprehensive Report (2019-2033)
This detailed report provides a comprehensive analysis of the QR Codes Market, covering its evolution from 2019 to 2033. With a focus on market dynamics, competitive landscape, and future projections, this research is essential for industry stakeholders, investors, and businesses seeking to understand and capitalize on the burgeoning opportunities within this rapidly expanding sector. The report leverages extensive data analysis, incorporating both historical and projected market values (in Millions).
QR Codes Market Concentration & Innovation
The QR Codes Market exhibits a moderately concentrated landscape, with several key players holding significant market share. While precise market share figures for each company remain proprietary, PayPal Inc, UnionPay International Co Ltd, and Block Inc (Square) are among the prominent global players, particularly within the financial transactions segment. Smaller, specialized companies like Uniqode Phygital Inc, QR TIGER PTE LTD, and Flowcode are increasingly driving innovation with specialized QR code generation and analytics platforms. The market is characterized by continuous innovation, particularly in areas such as dynamic QR codes, advanced analytics, and integration with other technologies (e.g., NFC, AR). Regulatory frameworks, while generally supportive of QR code adoption, vary across different regions, influencing market penetration and acceptance rates. The presence of alternative technologies for mobile payments (e.g., NFC) creates some competitive pressure, but QR codes maintain a distinct advantage in terms of cost-effectiveness and ease of implementation. M&A activity has been moderate in recent years, with deal values ranging from xx Million to xx Million. Further consolidation is expected as larger players seek to expand their market reach and capabilities. End-user trends indicate a growing preference for contactless and secure payment options, which significantly benefits the QR code market.
- Market Concentration: Moderately concentrated, with several dominant players.
- Innovation Drivers: Dynamic QR codes, advanced analytics, integration with other technologies.
- Regulatory Frameworks: Vary across regions, impacting market penetration.
- Product Substitutes: NFC-based payment technologies.
- End-User Trends: Growing preference for contactless and secure payments.
- M&A Activity: Moderate, with deal values ranging from xx Million to xx Million.
QR Codes Market Industry Trends & Insights
The QR Codes Market is experiencing significant growth, driven by the increasing adoption of smartphones, the rise of contactless payments, and the expanding use of QR codes for marketing and branding purposes. The Compound Annual Growth Rate (CAGR) during the historical period (2019-2024) is estimated at xx%, and is projected to reach xx% during the forecast period (2025-2033). This growth is fueled by several factors: Firstly, technological advancements continue to enhance QR code functionality, adding features such as dynamic content updates, data analytics, and integration with loyalty programs. Secondly, shifting consumer preferences towards contactless and convenient transactions are bolstering adoption. The market penetration rate has risen substantially, from xx% in 2019 to an estimated xx% in 2025, projected to exceed xx% by 2033. The competitive landscape is dynamic, characterized by both established payment providers and emerging technology companies vying for market share. The market's competitive dynamics are shaped by pricing strategies, technological innovation, and strategic partnerships.

Dominant Markets & Segments in QR Codes Market
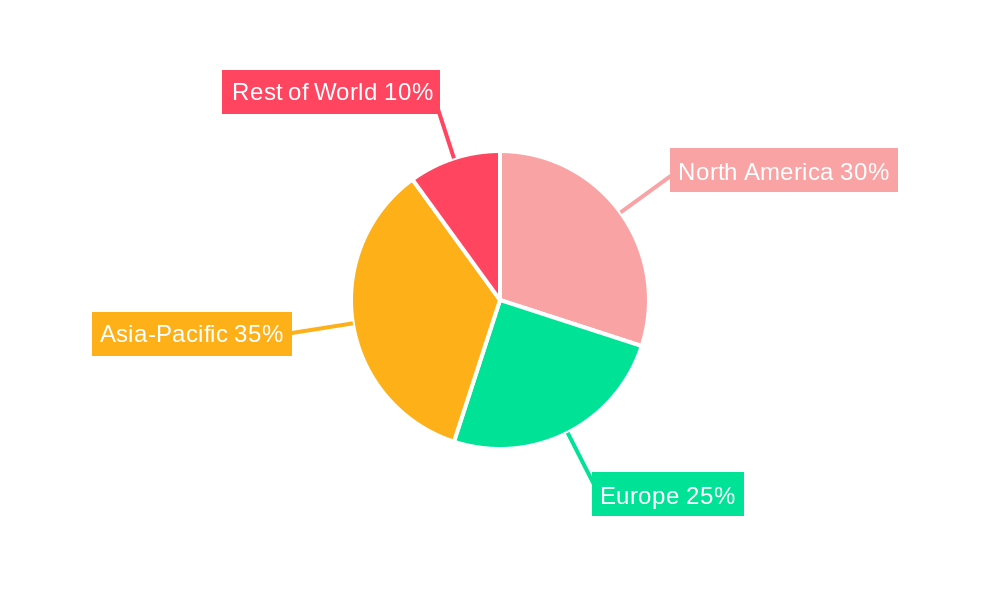
The Asia-Pacific region currently dominates the QR Codes Market, driven by high smartphone penetration, a burgeoning digital economy, and supportive government initiatives promoting digital payments. China and India are key contributors to this regional dominance.
- Key Drivers in Asia-Pacific:
- High smartphone penetration.
- Strong growth of e-commerce and digital payments.
- Government initiatives promoting digital transactions.
- Favorable economic policies.
- Developed infrastructure.
The market is further segmented by application (payments, marketing, access control, etc.) and by technology (static vs. dynamic QR codes). The payments segment currently holds the largest share, followed by the marketing segment, which is experiencing rapid growth due to the effectiveness of QR codes in driving offline-to-online conversions. The dominance of the Asia-Pacific region is expected to continue throughout the forecast period, although other regions, particularly North America and Europe, are projected to experience significant growth.
QR Codes Market Product Developments
Recent product innovations focus on enhanced functionalities, data analytics capabilities, and seamless integration with other platforms. Dynamic QR codes, enabling content updates without code regeneration, are becoming increasingly popular. The development of QR code solutions integrated with CRM systems and marketing automation platforms enhances their value proposition. This integration allows for personalized user experiences, better tracking of marketing campaigns, and ultimately improved return on investment (ROI) for businesses.
Report Scope & Segmentation Analysis
This report segments the QR Codes Market by region (North America, Europe, Asia-Pacific, Middle East & Africa, and South America), by application (payment systems, access control, marketing & advertising, and others), and by technology (static and dynamic QR codes). Each segment's market size, growth projections, and competitive dynamics are thoroughly analyzed in this report, providing valuable insights for strategic decision-making. The report also incorporates a detailed analysis of the leading players in each segment.
Key Drivers of QR Codes Market Growth
The rapid growth of the QR Codes Market is propelled by several factors: The widespread adoption of smartphones provides a readily available platform for QR code scanning, while increasing consumer preference for contactless transactions enhances the appeal of QR-based payment systems. Government initiatives promoting digital payments in many countries further accelerate adoption. Technological advancements, such as dynamic QR codes and improved analytics capabilities, enhance their utility and appeal. Furthermore, the increasing use of QR codes in marketing and advertising campaigns demonstrates their versatility and effectiveness.
Challenges in the QR Codes Market Sector
Challenges include concerns around security and privacy, the need for robust infrastructure to support widespread adoption, and competition from alternative payment technologies. Regulatory hurdles vary by region, potentially hindering seamless implementation in some markets. Furthermore, the potential for QR code misuse (e.g., phishing scams) requires ongoing efforts to educate users and enhance security protocols. These factors, while currently manageable, could potentially constrain market growth if not effectively addressed.
Emerging Opportunities in QR Codes Market
Opportunities abound in leveraging QR codes for innovative applications, such as interactive experiences in augmented reality (AR), integration with loyalty programs, and broader integration with the Internet of Things (IoT). Expanding into emerging markets with high smartphone penetration and growing digital economies presents significant growth potential. Developing enhanced security features and user-friendly interfaces will further broaden market adoption and alleviate existing concerns.
Leading Players in the QR Codes Market Market
- Uniqode Phygital Inc
- QR TIGER PTE LTD
- Flowcode
- PayPal Inc
- Storepay Inc
- UnionPay International Co Ltd
- Block Inc (Square)
- Nearex Technologies Pvt Ltd
- LINE Pay Corporation
- Revolut Technologies Inc
- Ecentric Payment Systems
- Clover Network LLC
Key Developments in QR Codes Market Industry
- June 2024: Flowcode launched a reimagined product for enterprise marketing teams, focused on measuring and maximizing offline conversions, significantly impacting the marketing applications segment.
- July 2024: Bandhan Bank implemented a Bharat QR Code payment solution for its Current and Savings account customers, expanding QR code usage in the financial services sector.
Strategic Outlook for QR Codes Market Market
The QR Codes Market is poised for continued robust growth driven by technological innovation, expanding applications, and rising consumer demand for convenient and secure contactless solutions. Strategic partnerships, investments in enhanced security measures, and expansion into new markets will be key to success in this dynamic sector. The market's long-term potential remains strong, suggesting significant opportunities for both established players and emerging companies.
QR Codes Market Segmentation
-
1. Type
- 1.1. Website QR Code
- 1.2. Menu QR Code
- 1.3. File Download QR Code
- 1.4. Social Media QR Code
- 1.5. App Store
- 1.6. Others
-
2. Format
- 2.1. Static QR Code
- 2.2. Dynamic QR Code
-
3. End-User Application
- 3.1. Marketing and advertising
- 3.2. Payments and Transactions
- 3.3. Information Sharing
- 3.4. Customer engagement
- 3.5. Others
QR Codes Market Segmentation By Geography
- 1. North America
- 2. Europe
- 3. Asia
- 4. Australia and New Zealand
- 5. Latin America
- 6. Middle East and Africa
QR Codes Market REPORT HIGHLIGHTS
| Aspects | Details |
|---|---|
| Study Period | 2019-2033 |
| Base Year | 2024 |
| Estimated Year | 2025 |
| Forecast Period | 2025-2033 |
| Historical Period | 2019-2024 |
| Growth Rate | CAGR of 16.67% from 2019-2033 |
| Segmentation |
|
Table of Contents
- 1. Introduction
- 1.1. Research Scope
- 1.2. Market Segmentation
- 1.3. Research Methodology
- 1.4. Definitions and Assumptions
- 2. Executive Summary
- 2.1. Introduction
- 3. Market Dynamics
- 3.1. Introduction
- 3.2. Market Drivers
- 3.2.1. Increased Smartphone Penetration; Growing Demand for Contactless Solutions; Increasing need for Security and Fraud Prevention
- 3.3. Market Restrains
- 3.3.1. Increased Smartphone Penetration; Growing Demand for Contactless Solutions; Increasing need for Security and Fraud Prevention
- 3.4. Market Trends
- 3.4.1. The Payments and Transactions Segment is Anticipated to Witness a Significant Growth
- 4. Market Factor Analysis
- 4.1. Porters Five Forces
- 4.2. Supply/Value Chain
- 4.3. PESTEL analysis
- 4.4. Market Entropy
- 4.5. Patent/Trademark Analysis
- 5. Global QR Codes Market Analysis, Insights and Forecast, 2019-2031
- 5.1. Market Analysis, Insights and Forecast - by Type
- 5.1.1. Website QR Code
- 5.1.2. Menu QR Code
- 5.1.3. File Download QR Code
- 5.1.4. Social Media QR Code
- 5.1.5. App Store
- 5.1.6. Others
- 5.2. Market Analysis, Insights and Forecast - by Format
- 5.2.1. Static QR Code
- 5.2.2. Dynamic QR Code
- 5.3. Market Analysis, Insights and Forecast - by End-User Application
- 5.3.1. Marketing and advertising
- 5.3.2. Payments and Transactions
- 5.3.3. Information Sharing
- 5.3.4. Customer engagement
- 5.3.5. Others
- 5.4. Market Analysis, Insights and Forecast - by Region
- 5.4.1. North America
- 5.4.2. Europe
- 5.4.3. Asia
- 5.4.4. Australia and New Zealand
- 5.4.5. Latin America
- 5.4.6. Middle East and Africa
- 5.1. Market Analysis, Insights and Forecast - by Type
- 6. North America QR Codes Market Analysis, Insights and Forecast, 2019-2031
- 6.1. Market Analysis, Insights and Forecast - by Type
- 6.1.1. Website QR Code
- 6.1.2. Menu QR Code
- 6.1.3. File Download QR Code
- 6.1.4. Social Media QR Code
- 6.1.5. App Store
- 6.1.6. Others
- 6.2. Market Analysis, Insights and Forecast - by Format
- 6.2.1. Static QR Code
- 6.2.2. Dynamic QR Code
- 6.3. Market Analysis, Insights and Forecast - by End-User Application
- 6.3.1. Marketing and advertising
- 6.3.2. Payments and Transactions
- 6.3.3. Information Sharing
- 6.3.4. Customer engagement
- 6.3.5. Others
- 6.1. Market Analysis, Insights and Forecast - by Type
- 7. Europe QR Codes Market Analysis, Insights and Forecast, 2019-2031
- 7.1. Market Analysis, Insights and Forecast - by Type
- 7.1.1. Website QR Code
- 7.1.2. Menu QR Code
- 7.1.3. File Download QR Code
- 7.1.4. Social Media QR Code
- 7.1.5. App Store
- 7.1.6. Others
- 7.2. Market Analysis, Insights and Forecast - by Format
- 7.2.1. Static QR Code
- 7.2.2. Dynamic QR Code
- 7.3. Market Analysis, Insights and Forecast - by End-User Application
- 7.3.1. Marketing and advertising
- 7.3.2. Payments and Transactions
- 7.3.3. Information Sharing
- 7.3.4. Customer engagement
- 7.3.5. Others
- 7.1. Market Analysis, Insights and Forecast - by Type
- 8. Asia QR Codes Market Analysis, Insights and Forecast, 2019-2031
- 8.1. Market Analysis, Insights and Forecast - by Type
- 8.1.1. Website QR Code
- 8.1.2. Menu QR Code
- 8.1.3. File Download QR Code
- 8.1.4. Social Media QR Code
- 8.1.5. App Store
- 8.1.6. Others
- 8.2. Market Analysis, Insights and Forecast - by Format
- 8.2.1. Static QR Code
- 8.2.2. Dynamic QR Code
- 8.3. Market Analysis, Insights and Forecast - by End-User Application
- 8.3.1. Marketing and advertising
- 8.3.2. Payments and Transactions
- 8.3.3. Information Sharing
- 8.3.4. Customer engagement
- 8.3.5. Others
- 8.1. Market Analysis, Insights and Forecast - by Type
- 9. Australia and New Zealand QR Codes Market Analysis, Insights and Forecast, 2019-2031
- 9.1. Market Analysis, Insights and Forecast - by Type
- 9.1.1. Website QR Code
- 9.1.2. Menu QR Code
- 9.1.3. File Download QR Code
- 9.1.4. Social Media QR Code
- 9.1.5. App Store
- 9.1.6. Others
- 9.2. Market Analysis, Insights and Forecast - by Format
- 9.2.1. Static QR Code
- 9.2.2. Dynamic QR Code
- 9.3. Market Analysis, Insights and Forecast - by End-User Application
- 9.3.1. Marketing and advertising
- 9.3.2. Payments and Transactions
- 9.3.3. Information Sharing
- 9.3.4. Customer engagement
- 9.3.5. Others
- 9.1. Market Analysis, Insights and Forecast - by Type
- 10. Latin America QR Codes Market Analysis, Insights and Forecast, 2019-2031
- 10.1. Market Analysis, Insights and Forecast - by Type
- 10.1.1. Website QR Code
- 10.1.2. Menu QR Code
- 10.1.3. File Download QR Code
- 10.1.4. Social Media QR Code
- 10.1.5. App Store
- 10.1.6. Others
- 10.2. Market Analysis, Insights and Forecast - by Format
- 10.2.1. Static QR Code
- 10.2.2. Dynamic QR Code
- 10.3. Market Analysis, Insights and Forecast - by End-User Application
- 10.3.1. Marketing and advertising
- 10.3.2. Payments and Transactions
- 10.3.3. Information Sharing
- 10.3.4. Customer engagement
- 10.3.5. Others
- 10.1. Market Analysis, Insights and Forecast - by Type
- 11. Middle East and Africa QR Codes Market Analysis, Insights and Forecast, 2019-2031
- 11.1. Market Analysis, Insights and Forecast - by Type
- 11.1.1. Website QR Code
- 11.1.2. Menu QR Code
- 11.1.3. File Download QR Code
- 11.1.4. Social Media QR Code
- 11.1.5. App Store
- 11.1.6. Others
- 11.2. Market Analysis, Insights and Forecast - by Format
- 11.2.1. Static QR Code
- 11.2.2. Dynamic QR Code
- 11.3. Market Analysis, Insights and Forecast - by End-User Application
- 11.3.1. Marketing and advertising
- 11.3.2. Payments and Transactions
- 11.3.3. Information Sharing
- 11.3.4. Customer engagement
- 11.3.5. Others
- 11.1. Market Analysis, Insights and Forecast - by Type
- 12. Competitive Analysis
- 12.1. Global Market Share Analysis 2024
- 12.2. Company Profiles
- 12.2.1 Uniqode Phygital Inc
- 12.2.1.1. Overview
- 12.2.1.2. Products
- 12.2.1.3. SWOT Analysis
- 12.2.1.4. Recent Developments
- 12.2.1.5. Financials (Based on Availability)
- 12.2.2 QR TIGER PTE LTD
- 12.2.2.1. Overview
- 12.2.2.2. Products
- 12.2.2.3. SWOT Analysis
- 12.2.2.4. Recent Developments
- 12.2.2.5. Financials (Based on Availability)
- 12.2.3 Flowcode
- 12.2.3.1. Overview
- 12.2.3.2. Products
- 12.2.3.3. SWOT Analysis
- 12.2.3.4. Recent Developments
- 12.2.3.5. Financials (Based on Availability)
- 12.2.4 PayPal Inc
- 12.2.4.1. Overview
- 12.2.4.2. Products
- 12.2.4.3. SWOT Analysis
- 12.2.4.4. Recent Developments
- 12.2.4.5. Financials (Based on Availability)
- 12.2.5 Storepay Inc
- 12.2.5.1. Overview
- 12.2.5.2. Products
- 12.2.5.3. SWOT Analysis
- 12.2.5.4. Recent Developments
- 12.2.5.5. Financials (Based on Availability)
- 12.2.6 UnionPay International Co Ltd
- 12.2.6.1. Overview
- 12.2.6.2. Products
- 12.2.6.3. SWOT Analysis
- 12.2.6.4. Recent Developments
- 12.2.6.5. Financials (Based on Availability)
- 12.2.7 Block Inc (Square)
- 12.2.7.1. Overview
- 12.2.7.2. Products
- 12.2.7.3. SWOT Analysis
- 12.2.7.4. Recent Developments
- 12.2.7.5. Financials (Based on Availability)
- 12.2.8 Nearex Technologies Pvt Ltd
- 12.2.8.1. Overview
- 12.2.8.2. Products
- 12.2.8.3. SWOT Analysis
- 12.2.8.4. Recent Developments
- 12.2.8.5. Financials (Based on Availability)
- 12.2.9 LINE Pay Corporation
- 12.2.9.1. Overview
- 12.2.9.2. Products
- 12.2.9.3. SWOT Analysis
- 12.2.9.4. Recent Developments
- 12.2.9.5. Financials (Based on Availability)
- 12.2.10 Revolut Technologies Inc
- 12.2.10.1. Overview
- 12.2.10.2. Products
- 12.2.10.3. SWOT Analysis
- 12.2.10.4. Recent Developments
- 12.2.10.5. Financials (Based on Availability)
- 12.2.11 Ecentric Payment Systems
- 12.2.11.1. Overview
- 12.2.11.2. Products
- 12.2.11.3. SWOT Analysis
- 12.2.11.4. Recent Developments
- 12.2.11.5. Financials (Based on Availability)
- 12.2.12 Clover Network LLC*List Not Exhaustive
- 12.2.12.1. Overview
- 12.2.12.2. Products
- 12.2.12.3. SWOT Analysis
- 12.2.12.4. Recent Developments
- 12.2.12.5. Financials (Based on Availability)
- 12.2.1 Uniqode Phygital Inc
List of Figures
- Figure 1: Global QR Codes Market Revenue Breakdown (Million, %) by Region 2024 & 2032
- Figure 2: Global QR Codes Market Volume Breakdown (Billion, %) by Region 2024 & 2032
- Figure 3: North America QR Codes Market Revenue (Million), by Type 2024 & 2032
- Figure 4: North America QR Codes Market Volume (Billion), by Type 2024 & 2032
- Figure 5: North America QR Codes Market Revenue Share (%), by Type 2024 & 2032
- Figure 6: North America QR Codes Market Volume Share (%), by Type 2024 & 2032
- Figure 7: North America QR Codes Market Revenue (Million), by Format 2024 & 2032
- Figure 8: North America QR Codes Market Volume (Billion), by Format 2024 & 2032
- Figure 9: North America QR Codes Market Revenue Share (%), by Format 2024 & 2032
- Figure 10: North America QR Codes Market Volume Share (%), by Format 2024 & 2032
- Figure 11: North America QR Codes Market Revenue (Million), by End-User Application 2024 & 2032
- Figure 12: North America QR Codes Market Volume (Billion), by End-User Application 2024 & 2032
- Figure 13: North America QR Codes Market Revenue Share (%), by End-User Application 2024 & 2032
- Figure 14: North America QR Codes Market Volume Share (%), by End-User Application 2024 & 2032
- Figure 15: North America QR Codes Market Revenue (Million), by Country 2024 & 2032
- Figure 16: North America QR Codes Market Volume (Billion), by Country 2024 & 2032
- Figure 17: North America QR Codes Market Revenue Share (%), by Country 2024 & 2032
- Figure 18: North America QR Codes Market Volume Share (%), by Country 2024 & 2032
- Figure 19: Europe QR Codes Market Revenue (Million), by Type 2024 & 2032
- Figure 20: Europe QR Codes Market Volume (Billion), by Type 2024 & 2032
- Figure 21: Europe QR Codes Market Revenue Share (%), by Type 2024 & 2032
- Figure 22: Europe QR Codes Market Volume Share (%), by Type 2024 & 2032
- Figure 23: Europe QR Codes Market Revenue (Million), by Format 2024 & 2032
- Figure 24: Europe QR Codes Market Volume (Billion), by Format 2024 & 2032
- Figure 25: Europe QR Codes Market Revenue Share (%), by Format 2024 & 2032
- Figure 26: Europe QR Codes Market Volume Share (%), by Format 2024 & 2032
- Figure 27: Europe QR Codes Market Revenue (Million), by End-User Application 2024 & 2032
- Figure 28: Europe QR Codes Market Volume (Billion), by End-User Application 2024 & 2032
- Figure 29: Europe QR Codes Market Revenue Share (%), by End-User Application 2024 & 2032
- Figure 30: Europe QR Codes Market Volume Share (%), by End-User Application 2024 & 2032
- Figure 31: Europe QR Codes Market Revenue (Million), by Country 2024 & 2032
- Figure 32: Europe QR Codes Market Volume (Billion), by Country 2024 & 2032
- Figure 33: Europe QR Codes Market Revenue Share (%), by Country 2024 & 2032
- Figure 34: Europe QR Codes Market Volume Share (%), by Country 2024 & 2032
- Figure 35: Asia QR Codes Market Revenue (Million), by Type 2024 & 2032
- Figure 36: Asia QR Codes Market Volume (Billion), by Type 2024 & 2032
- Figure 37: Asia QR Codes Market Revenue Share (%), by Type 2024 & 2032
- Figure 38: Asia QR Codes Market Volume Share (%), by Type 2024 & 2032
- Figure 39: Asia QR Codes Market Revenue (Million), by Format 2024 & 2032
- Figure 40: Asia QR Codes Market Volume (Billion), by Format 2024 & 2032
- Figure 41: Asia QR Codes Market Revenue Share (%), by Format 2024 & 2032
- Figure 42: Asia QR Codes Market Volume Share (%), by Format 2024 & 2032
- Figure 43: Asia QR Codes Market Revenue (Million), by End-User Application 2024 & 2032
- Figure 44: Asia QR Codes Market Volume (Billion), by End-User Application 2024 & 2032
- Figure 45: Asia QR Codes Market Revenue Share (%), by End-User Application 2024 & 2032
- Figure 46: Asia QR Codes Market Volume Share (%), by End-User Application 2024 & 2032
- Figure 47: Asia QR Codes Market Revenue (Million), by Country 2024 & 2032
- Figure 48: Asia QR Codes Market Volume (Billion), by Country 2024 & 2032
- Figure 49: Asia QR Codes Market Revenue Share (%), by Country 2024 & 2032
- Figure 50: Asia QR Codes Market Volume Share (%), by Country 2024 & 2032
- Figure 51: Australia and New Zealand QR Codes Market Revenue (Million), by Type 2024 & 2032
- Figure 52: Australia and New Zealand QR Codes Market Volume (Billion), by Type 2024 & 2032
- Figure 53: Australia and New Zealand QR Codes Market Revenue Share (%), by Type 2024 & 2032
- Figure 54: Australia and New Zealand QR Codes Market Volume Share (%), by Type 2024 & 2032
- Figure 55: Australia and New Zealand QR Codes Market Revenue (Million), by Format 2024 & 2032
- Figure 56: Australia and New Zealand QR Codes Market Volume (Billion), by Format 2024 & 2032
- Figure 57: Australia and New Zealand QR Codes Market Revenue Share (%), by Format 2024 & 2032
- Figure 58: Australia and New Zealand QR Codes Market Volume Share (%), by Format 2024 & 2032
- Figure 59: Australia and New Zealand QR Codes Market Revenue (Million), by End-User Application 2024 & 2032
- Figure 60: Australia and New Zealand QR Codes Market Volume (Billion), by End-User Application 2024 & 2032
- Figure 61: Australia and New Zealand QR Codes Market Revenue Share (%), by End-User Application 2024 & 2032
- Figure 62: Australia and New Zealand QR Codes Market Volume Share (%), by End-User Application 2024 & 2032
- Figure 63: Australia and New Zealand QR Codes Market Revenue (Million), by Country 2024 & 2032
- Figure 64: Australia and New Zealand QR Codes Market Volume (Billion), by Country 2024 & 2032
- Figure 65: Australia and New Zealand QR Codes Market Revenue Share (%), by Country 2024 & 2032
- Figure 66: Australia and New Zealand QR Codes Market Volume Share (%), by Country 2024 & 2032
- Figure 67: Latin America QR Codes Market Revenue (Million), by Type 2024 & 2032
- Figure 68: Latin America QR Codes Market Volume (Billion), by Type 2024 & 2032
- Figure 69: Latin America QR Codes Market Revenue Share (%), by Type 2024 & 2032
- Figure 70: Latin America QR Codes Market Volume Share (%), by Type 2024 & 2032
- Figure 71: Latin America QR Codes Market Revenue (Million), by Format 2024 & 2032
- Figure 72: Latin America QR Codes Market Volume (Billion), by Format 2024 & 2032
- Figure 73: Latin America QR Codes Market Revenue Share (%), by Format 2024 & 2032
- Figure 74: Latin America QR Codes Market Volume Share (%), by Format 2024 & 2032
- Figure 75: Latin America QR Codes Market Revenue (Million), by End-User Application 2024 & 2032
- Figure 76: Latin America QR Codes Market Volume (Billion), by End-User Application 2024 & 2032
- Figure 77: Latin America QR Codes Market Revenue Share (%), by End-User Application 2024 & 2032
- Figure 78: Latin America QR Codes Market Volume Share (%), by End-User Application 2024 & 2032
- Figure 79: Latin America QR Codes Market Revenue (Million), by Country 2024 & 2032
- Figure 80: Latin America QR Codes Market Volume (Billion), by Country 2024 & 2032
- Figure 81: Latin America QR Codes Market Revenue Share (%), by Country 2024 & 2032
- Figure 82: Latin America QR Codes Market Volume Share (%), by Country 2024 & 2032
- Figure 83: Middle East and Africa QR Codes Market Revenue (Million), by Type 2024 & 2032
- Figure 84: Middle East and Africa QR Codes Market Volume (Billion), by Type 2024 & 2032
- Figure 85: Middle East and Africa QR Codes Market Revenue Share (%), by Type 2024 & 2032
- Figure 86: Middle East and Africa QR Codes Market Volume Share (%), by Type 2024 & 2032
- Figure 87: Middle East and Africa QR Codes Market Revenue (Million), by Format 2024 & 2032
- Figure 88: Middle East and Africa QR Codes Market Volume (Billion), by Format 2024 & 2032
- Figure 89: Middle East and Africa QR Codes Market Revenue Share (%), by Format 2024 & 2032
- Figure 90: Middle East and Africa QR Codes Market Volume Share (%), by Format 2024 & 2032
- Figure 91: Middle East and Africa QR Codes Market Revenue (Million), by End-User Application 2024 & 2032
- Figure 92: Middle East and Africa QR Codes Market Volume (Billion), by End-User Application 2024 & 2032
- Figure 93: Middle East and Africa QR Codes Market Revenue Share (%), by End-User Application 2024 & 2032
- Figure 94: Middle East and Africa QR Codes Market Volume Share (%), by End-User Application 2024 & 2032
- Figure 95: Middle East and Africa QR Codes Market Revenue (Million), by Country 2024 & 2032
- Figure 96: Middle East and Africa QR Codes Market Volume (Billion), by Country 2024 & 2032
- Figure 97: Middle East and Africa QR Codes Market Revenue Share (%), by Country 2024 & 2032
- Figure 98: Middle East and Africa QR Codes Market Volume Share (%), by Country 2024 & 2032
List of Tables
- Table 1: Global QR Codes Market Revenue Million Forecast, by Region 2019 & 2032
- Table 2: Global QR Codes Market Volume Billion Forecast, by Region 2019 & 2032
- Table 3: Global QR Codes Market Revenue Million Forecast, by Type 2019 & 2032
- Table 4: Global QR Codes Market Volume Billion Forecast, by Type 2019 & 2032
- Table 5: Global QR Codes Market Revenue Million Forecast, by Format 2019 & 2032
- Table 6: Global QR Codes Market Volume Billion Forecast, by Format 2019 & 2032
- Table 7: Global QR Codes Market Revenue Million Forecast, by End-User Application 2019 & 2032
- Table 8: Global QR Codes Market Volume Billion Forecast, by End-User Application 2019 & 2032
- Table 9: Global QR Codes Market Revenue Million Forecast, by Region 2019 & 2032
- Table 10: Global QR Codes Market Volume Billion Forecast, by Region 2019 & 2032
- Table 11: Global QR Codes Market Revenue Million Forecast, by Type 2019 & 2032
- Table 12: Global QR Codes Market Volume Billion Forecast, by Type 2019 & 2032
- Table 13: Global QR Codes Market Revenue Million Forecast, by Format 2019 & 2032
- Table 14: Global QR Codes Market Volume Billion Forecast, by Format 2019 & 2032
- Table 15: Global QR Codes Market Revenue Million Forecast, by End-User Application 2019 & 2032
- Table 16: Global QR Codes Market Volume Billion Forecast, by End-User Application 2019 & 2032
- Table 17: Global QR Codes Market Revenue Million Forecast, by Country 2019 & 2032
- Table 18: Global QR Codes Market Volume Billion Forecast, by Country 2019 & 2032
- Table 19: Global QR Codes Market Revenue Million Forecast, by Type 2019 & 2032
- Table 20: Global QR Codes Market Volume Billion Forecast, by Type 2019 & 2032
- Table 21: Global QR Codes Market Revenue Million Forecast, by Format 2019 & 2032
- Table 22: Global QR Codes Market Volume Billion Forecast, by Format 2019 & 2032
- Table 23: Global QR Codes Market Revenue Million Forecast, by End-User Application 2019 & 2032
- Table 24: Global QR Codes Market Volume Billion Forecast, by End-User Application 2019 & 2032
- Table 25: Global QR Codes Market Revenue Million Forecast, by Country 2019 & 2032
- Table 26: Global QR Codes Market Volume Billion Forecast, by Country 2019 & 2032
- Table 27: Global QR Codes Market Revenue Million Forecast, by Type 2019 & 2032
- Table 28: Global QR Codes Market Volume Billion Forecast, by Type 2019 & 2032
- Table 29: Global QR Codes Market Revenue Million Forecast, by Format 2019 & 2032
- Table 30: Global QR Codes Market Volume Billion Forecast, by Format 2019 & 2032
- Table 31: Global QR Codes Market Revenue Million Forecast, by End-User Application 2019 & 2032
- Table 32: Global QR Codes Market Volume Billion Forecast, by End-User Application 2019 & 2032
- Table 33: Global QR Codes Market Revenue Million Forecast, by Country 2019 & 2032
- Table 34: Global QR Codes Market Volume Billion Forecast, by Country 2019 & 2032
- Table 35: Global QR Codes Market Revenue Million Forecast, by Type 2019 & 2032
- Table 36: Global QR Codes Market Volume Billion Forecast, by Type 2019 & 2032
- Table 37: Global QR Codes Market Revenue Million Forecast, by Format 2019 & 2032
- Table 38: Global QR Codes Market Volume Billion Forecast, by Format 2019 & 2032
- Table 39: Global QR Codes Market Revenue Million Forecast, by End-User Application 2019 & 2032
- Table 40: Global QR Codes Market Volume Billion Forecast, by End-User Application 2019 & 2032
- Table 41: Global QR Codes Market Revenue Million Forecast, by Country 2019 & 2032
- Table 42: Global QR Codes Market Volume Billion Forecast, by Country 2019 & 2032
- Table 43: Global QR Codes Market Revenue Million Forecast, by Type 2019 & 2032
- Table 44: Global QR Codes Market Volume Billion Forecast, by Type 2019 & 2032
- Table 45: Global QR Codes Market Revenue Million Forecast, by Format 2019 & 2032
- Table 46: Global QR Codes Market Volume Billion Forecast, by Format 2019 & 2032
- Table 47: Global QR Codes Market Revenue Million Forecast, by End-User Application 2019 & 2032
- Table 48: Global QR Codes Market Volume Billion Forecast, by End-User Application 2019 & 2032
- Table 49: Global QR Codes Market Revenue Million Forecast, by Country 2019 & 2032
- Table 50: Global QR Codes Market Volume Billion Forecast, by Country 2019 & 2032
- Table 51: Global QR Codes Market Revenue Million Forecast, by Type 2019 & 2032
- Table 52: Global QR Codes Market Volume Billion Forecast, by Type 2019 & 2032
- Table 53: Global QR Codes Market Revenue Million Forecast, by Format 2019 & 2032
- Table 54: Global QR Codes Market Volume Billion Forecast, by Format 2019 & 2032
- Table 55: Global QR Codes Market Revenue Million Forecast, by End-User Application 2019 & 2032
- Table 56: Global QR Codes Market Volume Billion Forecast, by End-User Application 2019 & 2032
- Table 57: Global QR Codes Market Revenue Million Forecast, by Country 2019 & 2032
- Table 58: Global QR Codes Market Volume Billion Forecast, by Country 2019 & 2032
Frequently Asked Questions
1. What is the projected Compound Annual Growth Rate (CAGR) of the QR Codes Market?
The projected CAGR is approximately 16.67%.
2. Which companies are prominent players in the QR Codes Market?
Key companies in the market include Uniqode Phygital Inc, QR TIGER PTE LTD, Flowcode, PayPal Inc, Storepay Inc, UnionPay International Co Ltd, Block Inc (Square), Nearex Technologies Pvt Ltd, LINE Pay Corporation, Revolut Technologies Inc, Ecentric Payment Systems, Clover Network LLC*List Not Exhaustive.
3. What are the main segments of the QR Codes Market?
The market segments include Type, Format, End-User Application.
4. Can you provide details about the market size?
The market size is estimated to be USD 10.5 Million as of 2022.
5. What are some drivers contributing to market growth?
Increased Smartphone Penetration; Growing Demand for Contactless Solutions; Increasing need for Security and Fraud Prevention.
6. What are the notable trends driving market growth?
The Payments and Transactions Segment is Anticipated to Witness a Significant Growth.
7. Are there any restraints impacting market growth?
Increased Smartphone Penetration; Growing Demand for Contactless Solutions; Increasing need for Security and Fraud Prevention.
8. Can you provide examples of recent developments in the market?
July 2024: Bandhan Bank launched its latest payment solution through the Bharat QR Code for its Current account and Savings account customers. The bank claimed that the solution will simplify how these self-employed segment customers make payments at any merchant outlet. An instant notification will also be received on every payment through a small speaker.June 2024: Flowcode, a marketing technology platform, unveiled a reimagined product designed for marketing and analytics teams at F1000 companies focused on measuring and maximizing offline conversions. Flowcode integrates seamlessly with data feeds, such as product catalogs, MLS listings, and more, to automate the creation of personalized, QR-enabled user journeys. This empowers brands to deliver unique, tailored consumer experiences, significantly increasing conversion rates.
9. What pricing options are available for accessing the report?
Pricing options include single-user, multi-user, and enterprise licenses priced at USD 4750, USD 5250, and USD 8750 respectively.
10. Is the market size provided in terms of value or volume?
The market size is provided in terms of value, measured in Million and volume, measured in Billion.
11. Are there any specific market keywords associated with the report?
Yes, the market keyword associated with the report is "QR Codes Market," which aids in identifying and referencing the specific market segment covered.
12. How do I determine which pricing option suits my needs best?
The pricing options vary based on user requirements and access needs. Individual users may opt for single-user licenses, while businesses requiring broader access may choose multi-user or enterprise licenses for cost-effective access to the report.
13. Are there any additional resources or data provided in the QR Codes Market report?
While the report offers comprehensive insights, it's advisable to review the specific contents or supplementary materials provided to ascertain if additional resources or data are available.
14. How can I stay updated on further developments or reports in the QR Codes Market?
To stay informed about further developments, trends, and reports in the QR Codes Market, consider subscribing to industry newsletters, following relevant companies and organizations, or regularly checking reputable industry news sources and publications.
Methodology
Step 1 - Identification of Relevant Samples Size from Population Database


Step 2 - Approaches for Defining Global Market Size (Value, Volume* & Price*)

Note*: In applicable scenarios
Step 3 - Data Sources
Primary Research
- Web Analytics
- Survey Reports
- Research Institute
- Latest Research Reports
- Opinion Leaders
Secondary Research
- Annual Reports
- White Paper
- Latest Press Release
- Industry Association
- Paid Database
- Investor Presentations

Step 4 - Data Triangulation
Involves using different sources of information in order to increase the validity of a study
These sources are likely to be stakeholders in a program - participants, other researchers, program staff, other community members, and so on.
Then we put all data in single framework & apply various statistical tools to find out the dynamic on the market.
During the analysis stage, feedback from the stakeholder groups would be compared to determine areas of agreement as well as areas of divergence


