
Key Insights
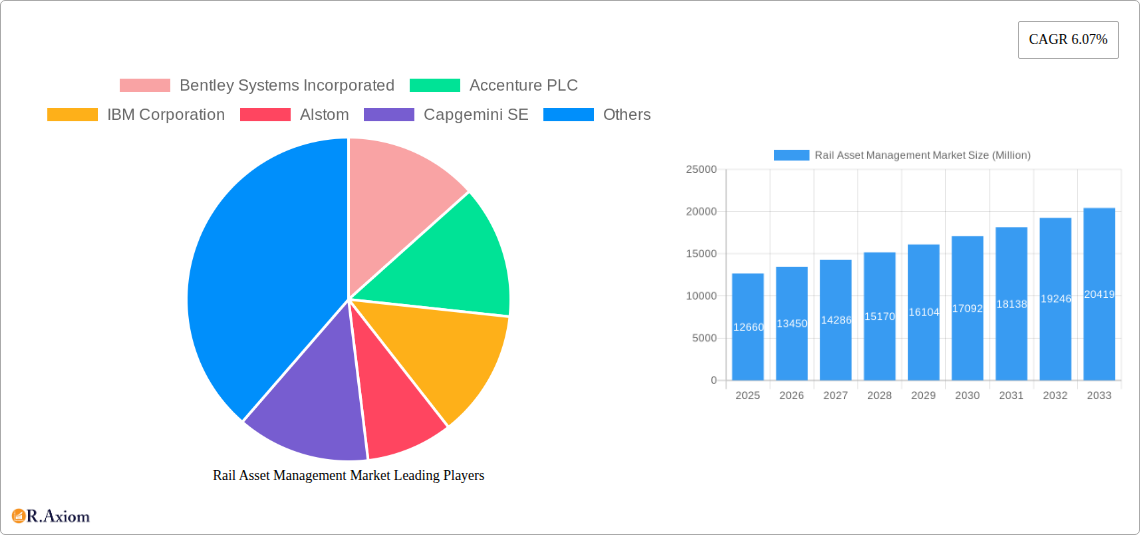
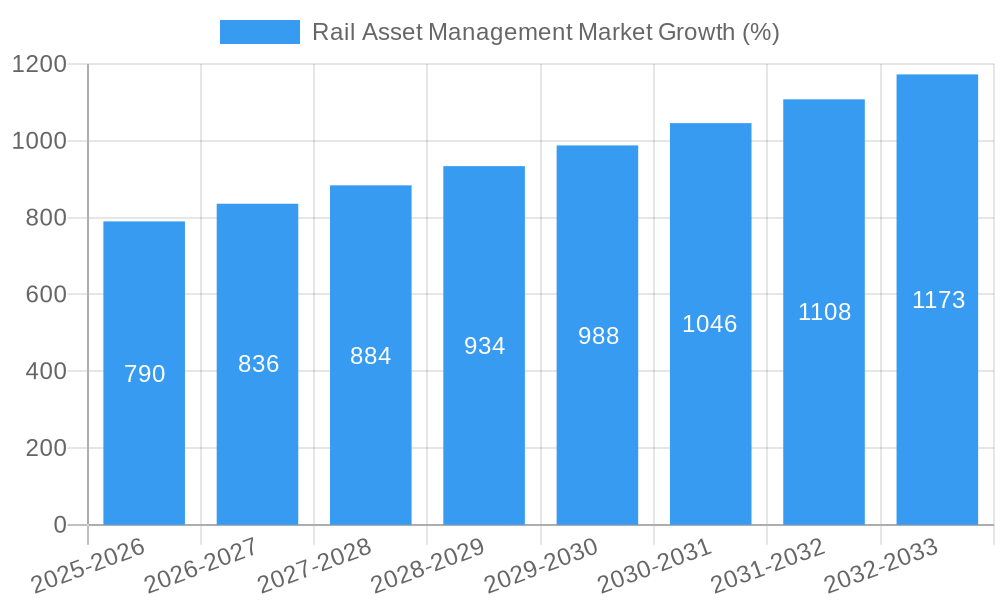
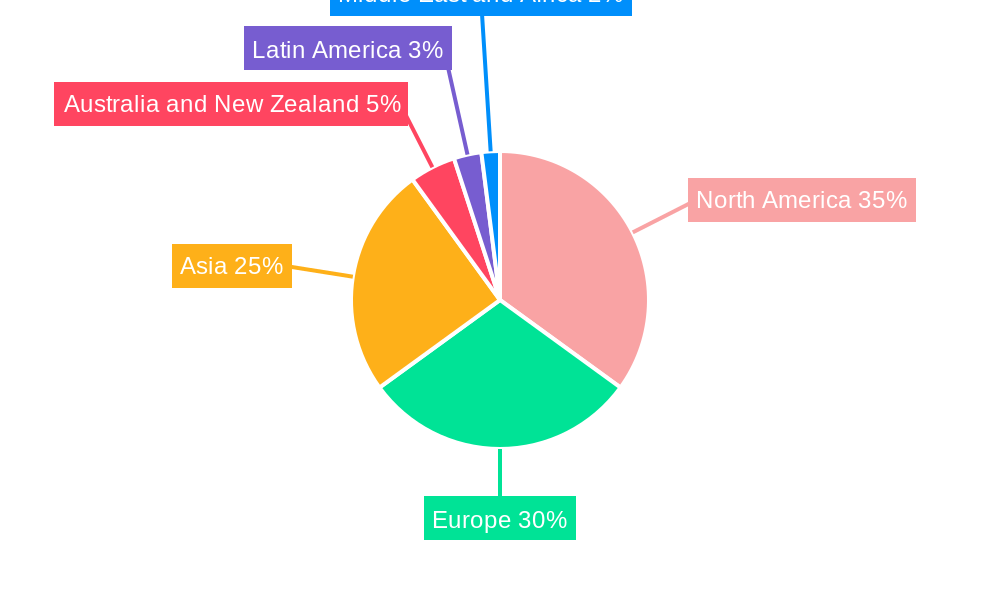
The global Rail Asset Management market, valued at $12.66 billion in 2025, is projected to experience robust growth, driven by increasing investments in railway infrastructure modernization and the rising adoption of digital technologies for enhanced operational efficiency and predictive maintenance. The market's Compound Annual Growth Rate (CAGR) of 6.07% from 2025 to 2033 indicates a significant expansion, exceeding $20 billion by the end of the forecast period. Key drivers include the need to improve safety and reduce operational costs, coupled with increasing government regulations mandating better asset tracking and maintenance. The shift towards cloud-based solutions is a significant trend, enabling real-time data analysis and improved decision-making. However, high initial investment costs for implementing new technologies and the integration complexities within existing legacy systems present challenges to market growth. The market is segmented by deployment (on-premises and cloud) and application (rolling stock and infrastructure), with the cloud deployment segment expected to witness faster growth due to its scalability and cost-effectiveness. Geographically, North America and Europe currently hold substantial market share, driven by mature railway networks and significant investments in infrastructure upgrades. However, Asia-Pacific is poised for substantial growth, fueled by rapid urbanization and increasing railway expansion projects in countries like India and China. Leading players in the market, such as Bentley Systems, Accenture, IBM, and Siemens, are continuously innovating to offer comprehensive solutions catering to the evolving needs of railway operators.
The market's growth is further supported by the rising adoption of Internet of Things (IoT) devices for real-time monitoring of assets, the increasing use of advanced analytics for predictive maintenance, and the development of integrated solutions that combine various aspects of rail asset management. While the on-premises segment currently holds a larger market share, the cloud-based segment is projected to experience significant growth due to its flexible nature and ability to support data-driven decision-making. The focus is shifting towards comprehensive solutions that integrate various aspects of rail asset management, including planning, design, construction, operation, and maintenance. This integration optimizes resource allocation, reduces downtime, and improves overall efficiency. Competition in the market is intense, with established players and emerging technology providers vying for market share through innovation, strategic partnerships, and mergers and acquisitions.
Rail Asset Management Market: A Comprehensive Report (2019-2033)
This detailed report provides a comprehensive analysis of the Rail Asset Management Market, offering actionable insights for industry stakeholders. With a study period spanning 2019-2033, a base year of 2025, and a forecast period of 2025-2033, this report covers market size, segmentation, key players, technological advancements, and future growth prospects. The report uses Million for all monetary values.
Rail Asset Management Market Concentration & Innovation
The Rail Asset Management Market exhibits a moderately concentrated landscape, with several large multinational corporations holding significant market share. While precise market share figures for individual players are proprietary and vary by segment, key players like Bentley Systems Incorporated, Accenture PLC, and IBM Corporation command substantial portions. Smaller specialized firms cater to niche areas. Innovation is driven by the increasing need for improved efficiency, safety, and sustainability in rail operations.
- Innovation Drivers: Digitalization, predictive maintenance using IoT, AI-powered analytics for optimized asset management, and the adoption of cloud-based solutions.
- Regulatory Frameworks: Stringent safety regulations and compliance mandates drive investment in advanced asset management technologies.
- Product Substitutes: While direct substitutes are limited, the market faces competition from alternative approaches to maintenance and management, such as outsourcing specific services.
- End-User Trends: A growing preference for data-driven decision-making and real-time insights shapes the demand for advanced solutions.
- M&A Activities: The market has witnessed moderate M&A activity in recent years, with deal values ranging from xx Million to xx Million, primarily focusing on enhancing capabilities and expanding market reach. These activities consolidate market share and integrate technological capabilities.
Rail Asset Management Market Industry Trends & Insights
The Rail Asset Management Market is experiencing robust growth, driven by factors like increasing rail infrastructure investments globally, the aging rail infrastructure requiring modernization and improved maintenance, and the rising adoption of digital technologies. The market is predicted to grow at a CAGR of xx% during the forecast period (2025-2033), reaching a market size of xx Million by 2033. The market penetration of advanced asset management systems is steadily increasing, driven by the demonstrated benefits in terms of cost savings, improved efficiency, and enhanced safety. Technological disruptions, primarily focused on AI, IoT, and cloud computing, are reshaping the competitive landscape, leading to the development of more sophisticated and integrated solutions. Consumer preferences are increasingly aligned with sustainable and environmentally friendly practices, placing emphasis on solutions that minimize energy consumption and carbon footprint. Competitive dynamics are characterized by a blend of intense competition among established players and the emergence of innovative startups offering niche solutions.
Dominant Markets & Segments in Rail Asset Management Market
The North American and European regions currently dominate the Rail Asset Management Market, primarily driven by extensive rail networks, significant investments in infrastructure upgrades, and robust regulatory frameworks emphasizing safety and efficiency. Within the market segmentation:
- By Deployment: The cloud-based deployment model is experiencing faster growth than on-premises, driven by advantages in scalability, cost-effectiveness, and accessibility.
- By Application: The Rolling Stock segment holds a larger market share compared to Infrastructure, due to the need for continuous monitoring and proactive maintenance of trains and other rolling assets. However, both segments exhibit significant growth potential.
Key Drivers (by region & segment):
- North America: Significant government investment in infrastructure projects, a strong focus on improving safety and reducing operational costs.
- Europe: Extensive high-speed rail network expansions, coupled with modernization projects of existing infrastructure, stringent environmental regulations.
- Asia-Pacific: Rapid infrastructure development and urbanization driving increased demand for efficient asset management solutions.
- Rolling Stock: Focus on predictive maintenance to minimize downtime, stringent safety regulations, and growing demand for optimized performance.
- Infrastructure: Growing demand for efficient monitoring and management of track, signals, and other infrastructure components, emphasis on safety and operational efficiency.
Rail Asset Management Market Product Developments
Recent product innovations in Rail Asset Management focus on integrating AI and Machine Learning for predictive maintenance, leveraging IoT sensors for real-time data acquisition and analysis, and utilizing cloud platforms for enhanced data storage and analysis capabilities. These developments aim to improve operational efficiency, reduce maintenance costs, and enhance safety. The market is witnessing a shift towards comprehensive integrated solutions that combine various technologies and data sources for holistic asset management.
Report Scope & Segmentation Analysis
This report segments the Rail Asset Management Market by deployment (On-premises, Cloud) and application (Rolling Stock, Infrastructure). Each segment is analyzed based on market size, growth rate, competitive dynamics, and key drivers. The Cloud deployment segment is projected to experience faster growth due to its scalability and cost-effectiveness, while the Rolling Stock application segment holds the larger current market share due to the criticality of maintaining rolling stock reliability. Competitive dynamics vary across segments, with specialized companies competing in niche applications.
Key Drivers of Rail Asset Management Market Growth
The growth of the Rail Asset Management Market is propelled by factors like the increasing need for operational efficiency and cost optimization in rail systems, the growing adoption of advanced technologies such as AI, IoT, and cloud computing, and stringent safety regulations emphasizing proactive maintenance. The rising focus on sustainability and environmental concerns also contributes, driving the demand for solutions that minimize energy consumption and environmental impact. Government initiatives and investments in rail infrastructure development globally further fuel market growth.
Challenges in the Rail Asset Management Market Sector
The Rail Asset Management Market faces challenges including high initial investment costs for implementing advanced technologies, integration complexities with existing systems, and cybersecurity risks associated with data-driven solutions. Data privacy concerns and the need for skilled personnel to operate and maintain these systems also pose hurdles. Supply chain disruptions can affect the timely delivery of components and services, while intense competition among established players and new entrants creates a dynamic and potentially challenging environment.
Emerging Opportunities in Rail Asset Management Market
Emerging opportunities lie in the application of advanced analytics to improve predictive maintenance, the integration of blockchain technology for enhanced data security and traceability, and the expansion into new geographical markets with developing rail infrastructure. The development of tailored solutions for specific rail applications and the adoption of edge computing for real-time data processing represent significant growth areas. A focus on sustainability and the incorporation of environmentally friendly practices will be crucial for market success.
Leading Players in the Rail Asset Management Market Market
- Bentley Systems Incorporated
- Accenture PLC
- IBM Corporation
- Alstom
- Capgemini SE
- Hitachi Ltd
- Cisco Systems Inc
- Siemens AG
- Huawei Technologies Co
- Trimble Inc
- ZEDAS Gmb
- SNC-Lavalin Group Inc
- SAP SE
- Wabtec Corporation
Key Developments in Rail Asset Management Market Industry
- April 2023: Alstom secured a contract with the Pomeranian Metropolitan Railway for comprehensive maintenance services of rail traffic control equipment, demonstrating the growing demand for outsourced maintenance and asset management expertise.
- April 2023: The extended cooperation between GWR, Eversholt Rail, and Hitachi Rail showcases the importance of long-term partnerships in optimizing rail asset performance and highlights the success of collaborative approaches to maintenance and asset management. This deal reflects increased investment in improving train service dependability and UK supply chain strengthening.
Strategic Outlook for Rail Asset Management Market Market
The Rail Asset Management Market is poised for continued growth, driven by technological advancements, increasing infrastructure investments, and a growing emphasis on safety and efficiency. Opportunities exist in expanding into new markets, developing innovative solutions tailored to specific rail applications, and leveraging emerging technologies such as AI, IoT, and blockchain to optimize asset management processes. The focus on sustainability and the integration of environmentally friendly practices will also shape the future of the market.
Rail Asset Management Market Segmentation
-
1. Deployment
- 1.1. On-Premises
- 1.2. Cloud
-
2. Application
- 2.1. Rolling Stock
- 2.2. Infrastructure
Rail Asset Management Market Segmentation By Geography
-
1. North America
- 1.1. United States
- 1.2. Canada
-
2. Europe
- 2.1. United Kingdom
- 2.2. France
- 2.3. Germany
-
3. Asia
- 3.1. China
- 3.2. India
- 3.3. Japan
- 4. Australia and New Zealand
- 5. Latin America
- 6. Middle East and Africa
Rail Asset Management Market REPORT HIGHLIGHTS
| Aspects | Details |
|---|---|
| Study Period | 2019-2033 |
| Base Year | 2024 |
| Estimated Year | 2025 |
| Forecast Period | 2025-2033 |
| Historical Period | 2019-2024 |
| Growth Rate | CAGR of 6.07% from 2019-2033 |
| Segmentation |
|
Table of Contents
- 1. Introduction
- 1.1. Research Scope
- 1.2. Market Segmentation
- 1.3. Research Methodology
- 1.4. Definitions and Assumptions
- 2. Executive Summary
- 2.1. Introduction
- 3. Market Dynamics
- 3.1. Introduction
- 3.2. Market Drivers
- 3.2.1. Growing Demand for Effective Rail Operations; Increase in Government Initiatives and Public-Private Partnership Model; Rapid Urbanization in Developing and Underdeveloped Countries
- 3.3. Market Restrains
- 3.3.1. High Initial Investment in Creating Supporting Infrastructure and Automation
- 3.4. Market Trends
- 3.4.1. Growing Demand for Effective Rail Operations to Drive the Market
- 4. Market Factor Analysis
- 4.1. Porters Five Forces
- 4.2. Supply/Value Chain
- 4.3. PESTEL analysis
- 4.4. Market Entropy
- 4.5. Patent/Trademark Analysis
- 5. Global Rail Asset Management Market Analysis, Insights and Forecast, 2019-2031
- 5.1. Market Analysis, Insights and Forecast - by Deployment
- 5.1.1. On-Premises
- 5.1.2. Cloud
- 5.2. Market Analysis, Insights and Forecast - by Application
- 5.2.1. Rolling Stock
- 5.2.2. Infrastructure
- 5.3. Market Analysis, Insights and Forecast - by Region
- 5.3.1. North America
- 5.3.2. Europe
- 5.3.3. Asia
- 5.3.4. Australia and New Zealand
- 5.3.5. Latin America
- 5.3.6. Middle East and Africa
- 5.1. Market Analysis, Insights and Forecast - by Deployment
- 6. North America Rail Asset Management Market Analysis, Insights and Forecast, 2019-2031
- 6.1. Market Analysis, Insights and Forecast - by Deployment
- 6.1.1. On-Premises
- 6.1.2. Cloud
- 6.2. Market Analysis, Insights and Forecast - by Application
- 6.2.1. Rolling Stock
- 6.2.2. Infrastructure
- 6.1. Market Analysis, Insights and Forecast - by Deployment
- 7. Europe Rail Asset Management Market Analysis, Insights and Forecast, 2019-2031
- 7.1. Market Analysis, Insights and Forecast - by Deployment
- 7.1.1. On-Premises
- 7.1.2. Cloud
- 7.2. Market Analysis, Insights and Forecast - by Application
- 7.2.1. Rolling Stock
- 7.2.2. Infrastructure
- 7.1. Market Analysis, Insights and Forecast - by Deployment
- 8. Asia Rail Asset Management Market Analysis, Insights and Forecast, 2019-2031
- 8.1. Market Analysis, Insights and Forecast - by Deployment
- 8.1.1. On-Premises
- 8.1.2. Cloud
- 8.2. Market Analysis, Insights and Forecast - by Application
- 8.2.1. Rolling Stock
- 8.2.2. Infrastructure
- 8.1. Market Analysis, Insights and Forecast - by Deployment
- 9. Australia and New Zealand Rail Asset Management Market Analysis, Insights and Forecast, 2019-2031
- 9.1. Market Analysis, Insights and Forecast - by Deployment
- 9.1.1. On-Premises
- 9.1.2. Cloud
- 9.2. Market Analysis, Insights and Forecast - by Application
- 9.2.1. Rolling Stock
- 9.2.2. Infrastructure
- 9.1. Market Analysis, Insights and Forecast - by Deployment
- 10. Latin America Rail Asset Management Market Analysis, Insights and Forecast, 2019-2031
- 10.1. Market Analysis, Insights and Forecast - by Deployment
- 10.1.1. On-Premises
- 10.1.2. Cloud
- 10.2. Market Analysis, Insights and Forecast - by Application
- 10.2.1. Rolling Stock
- 10.2.2. Infrastructure
- 10.1. Market Analysis, Insights and Forecast - by Deployment
- 11. Middle East and Africa Rail Asset Management Market Analysis, Insights and Forecast, 2019-2031
- 11.1. Market Analysis, Insights and Forecast - by Deployment
- 11.1.1. On-Premises
- 11.1.2. Cloud
- 11.2. Market Analysis, Insights and Forecast - by Application
- 11.2.1. Rolling Stock
- 11.2.2. Infrastructure
- 11.1. Market Analysis, Insights and Forecast - by Deployment
- 12. North America Rail Asset Management Market Analysis, Insights and Forecast, 2019-2031
- 12.1. Market Analysis, Insights and Forecast - By Country/Sub-region
- 12.1.1 United States
- 12.1.2 Canada
- 13. Europe Rail Asset Management Market Analysis, Insights and Forecast, 2019-2031
- 13.1. Market Analysis, Insights and Forecast - By Country/Sub-region
- 13.1.1 United Kingdom
- 13.1.2 France
- 13.1.3 Germany
- 14. Asia Rail Asset Management Market Analysis, Insights and Forecast, 2019-2031
- 14.1. Market Analysis, Insights and Forecast - By Country/Sub-region
- 14.1.1 China
- 14.1.2 India
- 14.1.3 Japan
- 15. Australia and New Zealand Rail Asset Management Market Analysis, Insights and Forecast, 2019-2031
- 15.1. Market Analysis, Insights and Forecast - By Country/Sub-region
- 15.1.1.
- 16. Latin America Rail Asset Management Market Analysis, Insights and Forecast, 2019-2031
- 16.1. Market Analysis, Insights and Forecast - By Country/Sub-region
- 16.1.1.
- 17. Middle East and Africa Rail Asset Management Market Analysis, Insights and Forecast, 2019-2031
- 17.1. Market Analysis, Insights and Forecast - By Country/Sub-region
- 17.1.1.
- 18. Competitive Analysis
- 18.1. Global Market Share Analysis 2024
- 18.2. Company Profiles
- 18.2.1 Bentley Systems Incorporated
- 18.2.1.1. Overview
- 18.2.1.2. Products
- 18.2.1.3. SWOT Analysis
- 18.2.1.4. Recent Developments
- 18.2.1.5. Financials (Based on Availability)
- 18.2.2 Accenture PLC
- 18.2.2.1. Overview
- 18.2.2.2. Products
- 18.2.2.3. SWOT Analysis
- 18.2.2.4. Recent Developments
- 18.2.2.5. Financials (Based on Availability)
- 18.2.3 IBM Corporation
- 18.2.3.1. Overview
- 18.2.3.2. Products
- 18.2.3.3. SWOT Analysis
- 18.2.3.4. Recent Developments
- 18.2.3.5. Financials (Based on Availability)
- 18.2.4 Alstom
- 18.2.4.1. Overview
- 18.2.4.2. Products
- 18.2.4.3. SWOT Analysis
- 18.2.4.4. Recent Developments
- 18.2.4.5. Financials (Based on Availability)
- 18.2.5 Capgemini SE
- 18.2.5.1. Overview
- 18.2.5.2. Products
- 18.2.5.3. SWOT Analysis
- 18.2.5.4. Recent Developments
- 18.2.5.5. Financials (Based on Availability)
- 18.2.6 Hitachi Ltd
- 18.2.6.1. Overview
- 18.2.6.2. Products
- 18.2.6.3. SWOT Analysis
- 18.2.6.4. Recent Developments
- 18.2.6.5. Financials (Based on Availability)
- 18.2.7 Cisco Systems Inc
- 18.2.7.1. Overview
- 18.2.7.2. Products
- 18.2.7.3. SWOT Analysis
- 18.2.7.4. Recent Developments
- 18.2.7.5. Financials (Based on Availability)
- 18.2.8 Siemens AG
- 18.2.8.1. Overview
- 18.2.8.2. Products
- 18.2.8.3. SWOT Analysis
- 18.2.8.4. Recent Developments
- 18.2.8.5. Financials (Based on Availability)
- 18.2.9 Huawei Technologies Co
- 18.2.9.1. Overview
- 18.2.9.2. Products
- 18.2.9.3. SWOT Analysis
- 18.2.9.4. Recent Developments
- 18.2.9.5. Financials (Based on Availability)
- 18.2.10 Trimble Inc
- 18.2.10.1. Overview
- 18.2.10.2. Products
- 18.2.10.3. SWOT Analysis
- 18.2.10.4. Recent Developments
- 18.2.10.5. Financials (Based on Availability)
- 18.2.11 ZEDAS Gmb
- 18.2.11.1. Overview
- 18.2.11.2. Products
- 18.2.11.3. SWOT Analysis
- 18.2.11.4. Recent Developments
- 18.2.11.5. Financials (Based on Availability)
- 18.2.12 SNC-Lavalin Group Inc
- 18.2.12.1. Overview
- 18.2.12.2. Products
- 18.2.12.3. SWOT Analysis
- 18.2.12.4. Recent Developments
- 18.2.12.5. Financials (Based on Availability)
- 18.2.13 SAP SE
- 18.2.13.1. Overview
- 18.2.13.2. Products
- 18.2.13.3. SWOT Analysis
- 18.2.13.4. Recent Developments
- 18.2.13.5. Financials (Based on Availability)
- 18.2.14 Wabtec Corporation
- 18.2.14.1. Overview
- 18.2.14.2. Products
- 18.2.14.3. SWOT Analysis
- 18.2.14.4. Recent Developments
- 18.2.14.5. Financials (Based on Availability)
- 18.2.1 Bentley Systems Incorporated
List of Figures
- Figure 1: Global Rail Asset Management Market Revenue Breakdown (Million, %) by Region 2024 & 2032
- Figure 2: North America Rail Asset Management Market Revenue (Million), by Country 2024 & 2032
- Figure 3: North America Rail Asset Management Market Revenue Share (%), by Country 2024 & 2032
- Figure 4: Europe Rail Asset Management Market Revenue (Million), by Country 2024 & 2032
- Figure 5: Europe Rail Asset Management Market Revenue Share (%), by Country 2024 & 2032
- Figure 6: Asia Rail Asset Management Market Revenue (Million), by Country 2024 & 2032
- Figure 7: Asia Rail Asset Management Market Revenue Share (%), by Country 2024 & 2032
- Figure 8: Australia and New Zealand Rail Asset Management Market Revenue (Million), by Country 2024 & 2032
- Figure 9: Australia and New Zealand Rail Asset Management Market Revenue Share (%), by Country 2024 & 2032
- Figure 10: Latin America Rail Asset Management Market Revenue (Million), by Country 2024 & 2032
- Figure 11: Latin America Rail Asset Management Market Revenue Share (%), by Country 2024 & 2032
- Figure 12: Middle East and Africa Rail Asset Management Market Revenue (Million), by Country 2024 & 2032
- Figure 13: Middle East and Africa Rail Asset Management Market Revenue Share (%), by Country 2024 & 2032
- Figure 14: North America Rail Asset Management Market Revenue (Million), by Deployment 2024 & 2032
- Figure 15: North America Rail Asset Management Market Revenue Share (%), by Deployment 2024 & 2032
- Figure 16: North America Rail Asset Management Market Revenue (Million), by Application 2024 & 2032
- Figure 17: North America Rail Asset Management Market Revenue Share (%), by Application 2024 & 2032
- Figure 18: North America Rail Asset Management Market Revenue (Million), by Country 2024 & 2032
- Figure 19: North America Rail Asset Management Market Revenue Share (%), by Country 2024 & 2032
- Figure 20: Europe Rail Asset Management Market Revenue (Million), by Deployment 2024 & 2032
- Figure 21: Europe Rail Asset Management Market Revenue Share (%), by Deployment 2024 & 2032
- Figure 22: Europe Rail Asset Management Market Revenue (Million), by Application 2024 & 2032
- Figure 23: Europe Rail Asset Management Market Revenue Share (%), by Application 2024 & 2032
- Figure 24: Europe Rail Asset Management Market Revenue (Million), by Country 2024 & 2032
- Figure 25: Europe Rail Asset Management Market Revenue Share (%), by Country 2024 & 2032
- Figure 26: Asia Rail Asset Management Market Revenue (Million), by Deployment 2024 & 2032
- Figure 27: Asia Rail Asset Management Market Revenue Share (%), by Deployment 2024 & 2032
- Figure 28: Asia Rail Asset Management Market Revenue (Million), by Application 2024 & 2032
- Figure 29: Asia Rail Asset Management Market Revenue Share (%), by Application 2024 & 2032
- Figure 30: Asia Rail Asset Management Market Revenue (Million), by Country 2024 & 2032
- Figure 31: Asia Rail Asset Management Market Revenue Share (%), by Country 2024 & 2032
- Figure 32: Australia and New Zealand Rail Asset Management Market Revenue (Million), by Deployment 2024 & 2032
- Figure 33: Australia and New Zealand Rail Asset Management Market Revenue Share (%), by Deployment 2024 & 2032
- Figure 34: Australia and New Zealand Rail Asset Management Market Revenue (Million), by Application 2024 & 2032
- Figure 35: Australia and New Zealand Rail Asset Management Market Revenue Share (%), by Application 2024 & 2032
- Figure 36: Australia and New Zealand Rail Asset Management Market Revenue (Million), by Country 2024 & 2032
- Figure 37: Australia and New Zealand Rail Asset Management Market Revenue Share (%), by Country 2024 & 2032
- Figure 38: Latin America Rail Asset Management Market Revenue (Million), by Deployment 2024 & 2032
- Figure 39: Latin America Rail Asset Management Market Revenue Share (%), by Deployment 2024 & 2032
- Figure 40: Latin America Rail Asset Management Market Revenue (Million), by Application 2024 & 2032
- Figure 41: Latin America Rail Asset Management Market Revenue Share (%), by Application 2024 & 2032
- Figure 42: Latin America Rail Asset Management Market Revenue (Million), by Country 2024 & 2032
- Figure 43: Latin America Rail Asset Management Market Revenue Share (%), by Country 2024 & 2032
- Figure 44: Middle East and Africa Rail Asset Management Market Revenue (Million), by Deployment 2024 & 2032
- Figure 45: Middle East and Africa Rail Asset Management Market Revenue Share (%), by Deployment 2024 & 2032
- Figure 46: Middle East and Africa Rail Asset Management Market Revenue (Million), by Application 2024 & 2032
- Figure 47: Middle East and Africa Rail Asset Management Market Revenue Share (%), by Application 2024 & 2032
- Figure 48: Middle East and Africa Rail Asset Management Market Revenue (Million), by Country 2024 & 2032
- Figure 49: Middle East and Africa Rail Asset Management Market Revenue Share (%), by Country 2024 & 2032
List of Tables
- Table 1: Global Rail Asset Management Market Revenue Million Forecast, by Region 2019 & 2032
- Table 2: Global Rail Asset Management Market Revenue Million Forecast, by Deployment 2019 & 2032
- Table 3: Global Rail Asset Management Market Revenue Million Forecast, by Application 2019 & 2032
- Table 4: Global Rail Asset Management Market Revenue Million Forecast, by Region 2019 & 2032
- Table 5: Global Rail Asset Management Market Revenue Million Forecast, by Country 2019 & 2032
- Table 6: United States Rail Asset Management Market Revenue (Million) Forecast, by Application 2019 & 2032
- Table 7: Canada Rail Asset Management Market Revenue (Million) Forecast, by Application 2019 & 2032
- Table 8: Global Rail Asset Management Market Revenue Million Forecast, by Country 2019 & 2032
- Table 9: United Kingdom Rail Asset Management Market Revenue (Million) Forecast, by Application 2019 & 2032
- Table 10: France Rail Asset Management Market Revenue (Million) Forecast, by Application 2019 & 2032
- Table 11: Germany Rail Asset Management Market Revenue (Million) Forecast, by Application 2019 & 2032
- Table 12: Global Rail Asset Management Market Revenue Million Forecast, by Country 2019 & 2032
- Table 13: China Rail Asset Management Market Revenue (Million) Forecast, by Application 2019 & 2032
- Table 14: India Rail Asset Management Market Revenue (Million) Forecast, by Application 2019 & 2032
- Table 15: Japan Rail Asset Management Market Revenue (Million) Forecast, by Application 2019 & 2032
- Table 16: Global Rail Asset Management Market Revenue Million Forecast, by Country 2019 & 2032
- Table 17: Rail Asset Management Market Revenue (Million) Forecast, by Application 2019 & 2032
- Table 18: Global Rail Asset Management Market Revenue Million Forecast, by Country 2019 & 2032
- Table 19: Rail Asset Management Market Revenue (Million) Forecast, by Application 2019 & 2032
- Table 20: Global Rail Asset Management Market Revenue Million Forecast, by Country 2019 & 2032
- Table 21: Rail Asset Management Market Revenue (Million) Forecast, by Application 2019 & 2032
- Table 22: Global Rail Asset Management Market Revenue Million Forecast, by Deployment 2019 & 2032
- Table 23: Global Rail Asset Management Market Revenue Million Forecast, by Application 2019 & 2032
- Table 24: Global Rail Asset Management Market Revenue Million Forecast, by Country 2019 & 2032
- Table 25: United States Rail Asset Management Market Revenue (Million) Forecast, by Application 2019 & 2032
- Table 26: Canada Rail Asset Management Market Revenue (Million) Forecast, by Application 2019 & 2032
- Table 27: Global Rail Asset Management Market Revenue Million Forecast, by Deployment 2019 & 2032
- Table 28: Global Rail Asset Management Market Revenue Million Forecast, by Application 2019 & 2032
- Table 29: Global Rail Asset Management Market Revenue Million Forecast, by Country 2019 & 2032
- Table 30: United Kingdom Rail Asset Management Market Revenue (Million) Forecast, by Application 2019 & 2032
- Table 31: France Rail Asset Management Market Revenue (Million) Forecast, by Application 2019 & 2032
- Table 32: Germany Rail Asset Management Market Revenue (Million) Forecast, by Application 2019 & 2032
- Table 33: Global Rail Asset Management Market Revenue Million Forecast, by Deployment 2019 & 2032
- Table 34: Global Rail Asset Management Market Revenue Million Forecast, by Application 2019 & 2032
- Table 35: Global Rail Asset Management Market Revenue Million Forecast, by Country 2019 & 2032
- Table 36: China Rail Asset Management Market Revenue (Million) Forecast, by Application 2019 & 2032
- Table 37: India Rail Asset Management Market Revenue (Million) Forecast, by Application 2019 & 2032
- Table 38: Japan Rail Asset Management Market Revenue (Million) Forecast, by Application 2019 & 2032
- Table 39: Global Rail Asset Management Market Revenue Million Forecast, by Deployment 2019 & 2032
- Table 40: Global Rail Asset Management Market Revenue Million Forecast, by Application 2019 & 2032
- Table 41: Global Rail Asset Management Market Revenue Million Forecast, by Country 2019 & 2032
- Table 42: Global Rail Asset Management Market Revenue Million Forecast, by Deployment 2019 & 2032
- Table 43: Global Rail Asset Management Market Revenue Million Forecast, by Application 2019 & 2032
- Table 44: Global Rail Asset Management Market Revenue Million Forecast, by Country 2019 & 2032
- Table 45: Global Rail Asset Management Market Revenue Million Forecast, by Deployment 2019 & 2032
- Table 46: Global Rail Asset Management Market Revenue Million Forecast, by Application 2019 & 2032
- Table 47: Global Rail Asset Management Market Revenue Million Forecast, by Country 2019 & 2032
Frequently Asked Questions
1. What is the projected Compound Annual Growth Rate (CAGR) of the Rail Asset Management Market?
The projected CAGR is approximately 6.07%.
2. Which companies are prominent players in the Rail Asset Management Market?
Key companies in the market include Bentley Systems Incorporated, Accenture PLC, IBM Corporation, Alstom, Capgemini SE, Hitachi Ltd, Cisco Systems Inc, Siemens AG, Huawei Technologies Co, Trimble Inc, ZEDAS Gmb, SNC-Lavalin Group Inc, SAP SE, Wabtec Corporation.
3. What are the main segments of the Rail Asset Management Market?
The market segments include Deployment, Application.
4. Can you provide details about the market size?
The market size is estimated to be USD 12.66 Million as of 2022.
5. What are some drivers contributing to market growth?
Growing Demand for Effective Rail Operations; Increase in Government Initiatives and Public-Private Partnership Model; Rapid Urbanization in Developing and Underdeveloped Countries.
6. What are the notable trends driving market growth?
Growing Demand for Effective Rail Operations to Drive the Market.
7. Are there any restraints impacting market growth?
High Initial Investment in Creating Supporting Infrastructure and Automation.
8. Can you provide examples of recent developments in the market?
April 2023: Alstom, a provider of smart and sustainable mobility, signed a contract with the Pomeranian Metropolitan Railway, a Pomeranian railway infrastructure management company, to provide full maintenance services, including repairs and periodic inspections of rail traffic control equipment manufactured at the Alstom ZWUS site.
9. What pricing options are available for accessing the report?
Pricing options include single-user, multi-user, and enterprise licenses priced at USD 4750, USD 5250, and USD 8750 respectively.
10. Is the market size provided in terms of value or volume?
The market size is provided in terms of value, measured in Million.
11. Are there any specific market keywords associated with the report?
Yes, the market keyword associated with the report is "Rail Asset Management Market," which aids in identifying and referencing the specific market segment covered.
12. How do I determine which pricing option suits my needs best?
The pricing options vary based on user requirements and access needs. Individual users may opt for single-user licenses, while businesses requiring broader access may choose multi-user or enterprise licenses for cost-effective access to the report.
13. Are there any additional resources or data provided in the Rail Asset Management Market report?
While the report offers comprehensive insights, it's advisable to review the specific contents or supplementary materials provided to ascertain if additional resources or data are available.
14. How can I stay updated on further developments or reports in the Rail Asset Management Market?
To stay informed about further developments, trends, and reports in the Rail Asset Management Market, consider subscribing to industry newsletters, following relevant companies and organizations, or regularly checking reputable industry news sources and publications.
Methodology
Step 1 - Identification of Relevant Samples Size from Population Database


Step 2 - Approaches for Defining Global Market Size (Value, Volume* & Price*)

Note*: In applicable scenarios
Step 3 - Data Sources
Primary Research
- Web Analytics
- Survey Reports
- Research Institute
- Latest Research Reports
- Opinion Leaders
Secondary Research
- Annual Reports
- White Paper
- Latest Press Release
- Industry Association
- Paid Database
- Investor Presentations

Step 4 - Data Triangulation
Involves using different sources of information in order to increase the validity of a study
These sources are likely to be stakeholders in a program - participants, other researchers, program staff, other community members, and so on.
Then we put all data in single framework & apply various statistical tools to find out the dynamic on the market.
During the analysis stage, feedback from the stakeholder groups would be compared to determine areas of agreement as well as areas of divergence


