
Key Insights
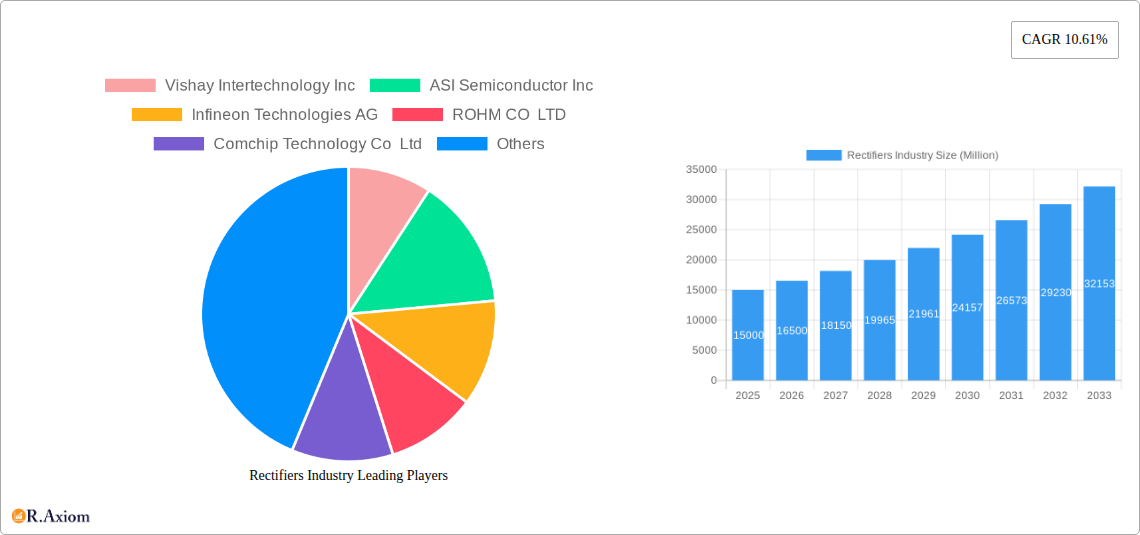
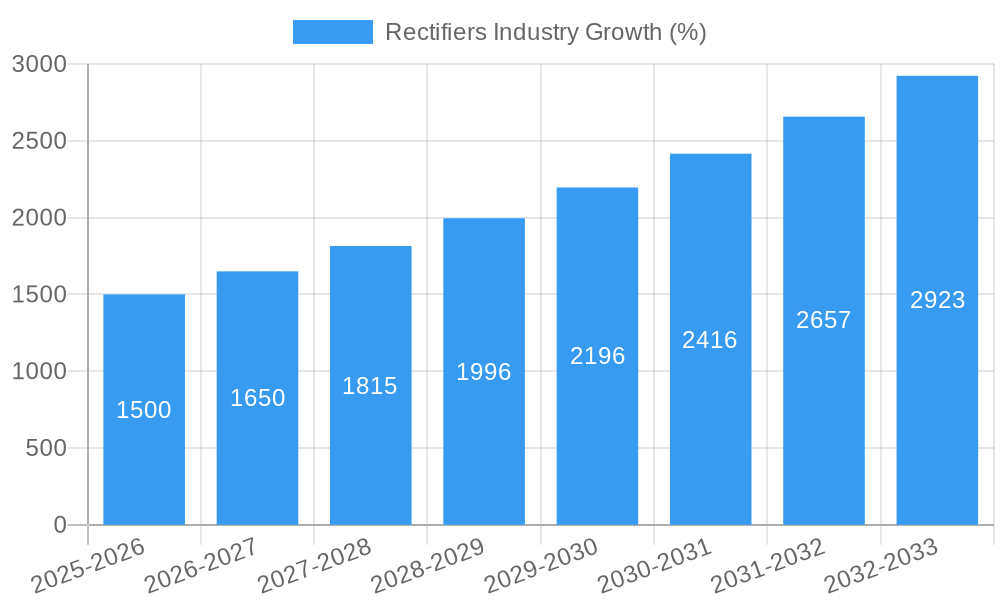
The global rectifiers market is experiencing robust growth, driven by the increasing demand for power conversion solutions across diverse sectors. The market's Compound Annual Growth Rate (CAGR) of 10.61% from 2019 to 2024 suggests a significant expansion, projected to continue into the forecast period (2025-2033). This growth is fueled primarily by the burgeoning automotive industry's electrification efforts, necessitating high-efficiency rectifiers for electric vehicles (EVs) and hybrid electric vehicles (HEVs). Furthermore, the expanding IT and telecom sectors, with their increasing reliance on power-efficient data centers and communication infrastructure, contribute significantly to market expansion. The rising adoption of renewable energy sources, including solar and wind power, also boosts demand for rectifiers in power utility applications. Market segmentation reveals a strong preference for three-phase rectifiers over single-phase units due to their higher power handling capabilities and suitability for industrial applications. The segment above 35 amps is expected to exhibit faster growth compared to the below 35 amps segment due to the increasing demand for high-power applications in industrial automation, data centers and electric vehicle charging infrastructure. Key players like Vishay Intertechnology, Infineon Technologies, and ROHM are actively engaged in developing advanced rectifier technologies, fostering innovation and competition within the market. While potential supply chain disruptions and material cost fluctuations could act as restraints, the overall market outlook remains positive, driven by sustained technological advancements and increasing global demand across diverse end-use sectors. The substantial growth trajectory is expected to continue throughout the forecast period.
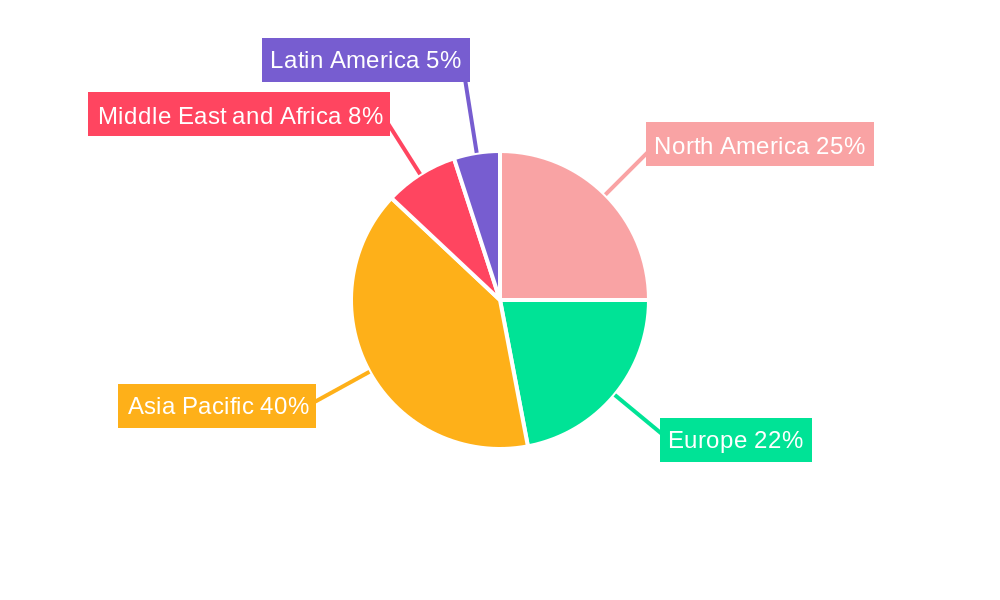
The Asia-Pacific region is anticipated to hold the largest market share, driven by rapid industrialization, increasing investments in infrastructure development, and a significant presence of key manufacturers. North America and Europe, while mature markets, will also witness considerable growth fueled by technological advancements and government initiatives promoting renewable energy adoption and electric vehicle adoption. The competitive landscape is characterized by both established industry giants and emerging players, all striving for market share through innovation in rectifier design, improved efficiency, and reduced costs. This competitive environment further accelerates technological advancements and benefits consumers through increased availability and reduced costs of high quality rectifier solutions.
This detailed report provides a comprehensive analysis of the Rectifiers industry, offering invaluable insights for stakeholders, investors, and industry professionals. The study covers the period from 2019 to 2033, with a focus on the forecast period (2025-2033), using 2025 as the base year. The report meticulously examines market segmentation by application (Power & Utility, Automotive, IT/Telecom, Consumer Electronics, Others) and type (Single Phase Rectifier, Three Phase Rectifier, below 35 Amps, above 35 Amps), revealing key trends, growth drivers, and challenges. The market size is valued in Millions.
Rectifiers Industry Market Concentration & Innovation
This section analyzes the competitive landscape of the rectifiers market, assessing market concentration, innovation drivers, and regulatory influences. Key players like Vishay Intertechnology Inc, ASI Semiconductor Inc, Infineon Technologies AG, ROHM CO LTD, and others shape the market dynamics. The report examines market share distribution among these leading companies, highlighting the presence of both established players and emerging entrants. Furthermore, the analysis encompasses M&A activities, including deal values (xx Million) and their implications for market consolidation and technological advancements. Innovation is evaluated through the lens of new product introductions, improvements in efficiency and power handling capabilities, and the integration of advanced materials. The impact of regulatory frameworks on market growth and sustainability is also discussed. Substitutes for rectifiers and their potential market penetration are also assessed. Finally, evolving end-user trends and their impact on market demand are analyzed.
Rectifiers Industry Industry Trends & Insights
The Rectifiers market is experiencing significant growth driven by increasing demand across diverse sectors. The report examines the Compound Annual Growth Rate (CAGR) of xx% during the forecast period, highlighting the key factors contributing to this expansion. Technological disruptions, including advancements in semiconductor technology and power electronics, are analyzed for their impact on market dynamics and product development. The report further investigates evolving consumer preferences, particularly the demand for energy-efficient and high-performance rectifiers. Competitive dynamics are analyzed, focusing on the strategies employed by leading companies to gain market share, including pricing strategies, product differentiation, and partnerships. Market penetration analysis across different segments helps to pinpoint areas of high growth and future opportunities. The influence of macroeconomic factors on market growth is explored in detail.
Dominant Markets & Segments in Rectifiers Industry
This section identifies the dominant regions, countries, and market segments within the Rectifiers industry. The analysis focuses on the performance of each application segment (Power & Utility, Automotive, IT/Telecom, Consumer Electronics, Others) and rectifier type (Single Phase, Three Phase, below 35 Amps, above 35 Amps).
By Application:
- Automotive: The automotive segment is expected to witness substantial growth driven by the increasing adoption of electric and hybrid vehicles.
- Power & Utility: This sector displays robust growth, owing to the expansion of renewable energy infrastructure and smart grids.
- IT/Telecom: Steady growth is anticipated due to the rising demand for data centers and communication infrastructure.
- Others: This segment includes various applications, with a moderate growth rate projected.
By Type:
- Three Phase Rectifiers: This segment holds a significant market share due to their prevalence in industrial applications.
- Above 35 Amps: This segment shows robust growth reflecting the need for higher power handling capacity in various applications.
Dominance analysis includes factors such as economic policies, infrastructure development, and technological advancements specific to each region and segment. Detailed insights into market share, growth drivers, and competitive landscape are provided for each leading segment.
Rectifiers Industry Product Developments
Recent years have witnessed significant advancements in rectifier technology, including the development of more energy-efficient, compact, and reliable devices. These innovations are driven by the need for improved performance, reduced costs, and enhanced durability across a range of applications. The integration of new materials and manufacturing processes has further enhanced the capabilities of rectifiers, enabling their adoption in demanding environments. This section highlights specific product developments and their impact on market competitiveness and adoption.
Report Scope & Segmentation Analysis
This report comprehensively segments the Rectifiers market based on application (Power & Utility, Automotive, IT/Telecom, Consumer Electronics, Others) and type (Single Phase Rectifier, Three Phase Rectifier, below 35 Amps, above 35 Amps). Each segment's market size (in Millions), growth projections, and competitive landscape are thoroughly analyzed. The report provides insights into the factors driving growth in each segment and the competitive dynamics among leading players.
Key Drivers of Rectifiers Industry Growth
Several factors contribute to the growth of the Rectifiers industry. Technological advancements such as the development of high-efficiency silicon carbide (SiC) and gallium nitride (GaN) based rectifiers are pushing market expansion. Government initiatives promoting renewable energy and electric vehicles are fueling demand. Rising industrial automation and the expansion of data centers also contribute to increased market demand.
Challenges in the Rectifiers Industry Sector
The Rectifiers industry faces certain challenges. Fluctuations in raw material prices and supply chain disruptions can impact profitability. Intense competition and the need for continuous innovation to remain competitive pose significant hurdles. Regulatory compliance requirements and environmental concerns add to the challenges faced by the industry. The impact of these challenges on market growth is quantified where data is available.
Emerging Opportunities in Rectifiers Industry
The Rectifiers industry presents several emerging opportunities. The rising adoption of renewable energy sources and electric vehicles creates substantial demand for efficient and reliable power conversion solutions. Advancements in power electronics and the development of new materials offer potential for improved performance and reduced costs. Expansion into emerging markets and the development of customized rectifier solutions for niche applications also present significant opportunities.
Leading Players in the Rectifiers Industry Market
- Vishay Intertechnology Inc
- ASI Semiconductor Inc
- Infineon Technologies AG
- ROHM CO LTD
- Comchip Technology Co Ltd
- Toshiba Corporation
- Microchip Technologies
- STMicroelectronics
- PANJIT International Inc
- Diodes Incorporated
- Micro Commercial Components (MCC)
- Semiconductor Components Industries LLC
- Semiconductor Components Industries LLC
- Vicor Corporation
- SHINDENGEN ELECTRIC MANUFACTURING CO LTD
Key Developments in Rectifiers Industry Industry
- 2023-Q3: Company X launched a new high-efficiency rectifier, expanding its product portfolio. This significantly impacted market competition and adoption.
- 2022-Q4: A major merger between Company Y and Company Z reshaped the industry landscape, impacting market share and strategies.
Strategic Outlook for Rectifiers Industry Market
The Rectifiers industry is poised for continued growth, driven by technological advancements, increasing demand from key sectors, and supportive government policies. Emerging trends like the adoption of wide bandgap semiconductors and the expansion into new applications will significantly influence market development. Strategic investments in research and development, expansion into new markets, and collaborations will be crucial for success in this dynamic industry.
Rectifiers Industry Segmentation
-
1. Type
- 1.1. Single Phase Rectifier
- 1.2. Three Phase Rectifier
-
2. Range
- 2.1. 0.5 - 3.0 Amps
- 2.2. 3.1 - 35 Amps
- 2.3. Above 35 Amps
-
3. Application
- 3.1. Power & Utility
- 3.2. Automotive
- 3.3. IT/Telecom
- 3.4. Consumer Electronics
- 3.5. Others
Rectifiers Industry Segmentation By Geography
- 1. North America
- 2. Europe
- 3. Asia Pacific
- 4. Middle East and Africa
- 5. Latin America
Rectifiers Industry REPORT HIGHLIGHTS
| Aspects | Details |
|---|---|
| Study Period | 2019-2033 |
| Base Year | 2024 |
| Estimated Year | 2025 |
| Forecast Period | 2025-2033 |
| Historical Period | 2019-2024 |
| Growth Rate | CAGR of 10.61% from 2019-2033 |
| Segmentation |
|
Table of Contents
- 1. Introduction
- 1.1. Research Scope
- 1.2. Market Segmentation
- 1.3. Research Methodology
- 1.4. Definitions and Assumptions
- 2. Executive Summary
- 2.1. Introduction
- 3. Market Dynamics
- 3.1. Introduction
- 3.2. Market Drivers
- 3.2.1. Increase in Demand For Rectifier Diodes for Various Applications in the Automotive Sector; Growth in Deployment of Smart Grids Across the Developing Countries
- 3.3. Market Restrains
- 3.3.1. Affect in Supply Chain Distribution Due to Covid-19 Pandemic
- 3.4. Market Trends
- 3.4.1. Automotive Segment to Hold Significant Market Share
- 4. Market Factor Analysis
- 4.1. Porters Five Forces
- 4.2. Supply/Value Chain
- 4.3. PESTEL analysis
- 4.4. Market Entropy
- 4.5. Patent/Trademark Analysis
- 5. Global Rectifiers Industry Analysis, Insights and Forecast, 2019-2031
- 5.1. Market Analysis, Insights and Forecast - by Type
- 5.1.1. Single Phase Rectifier
- 5.1.2. Three Phase Rectifier
- 5.2. Market Analysis, Insights and Forecast - by Range
- 5.2.1. 0.5 - 3.0 Amps
- 5.2.2. 3.1 - 35 Amps
- 5.2.3. Above 35 Amps
- 5.3. Market Analysis, Insights and Forecast - by Application
- 5.3.1. Power & Utility
- 5.3.2. Automotive
- 5.3.3. IT/Telecom
- 5.3.4. Consumer Electronics
- 5.3.5. Others
- 5.4. Market Analysis, Insights and Forecast - by Region
- 5.4.1. North America
- 5.4.2. Europe
- 5.4.3. Asia Pacific
- 5.4.4. Middle East and Africa
- 5.4.5. Latin America
- 5.1. Market Analysis, Insights and Forecast - by Type
- 6. North America Rectifiers Industry Analysis, Insights and Forecast, 2019-2031
- 6.1. Market Analysis, Insights and Forecast - by Type
- 6.1.1. Single Phase Rectifier
- 6.1.2. Three Phase Rectifier
- 6.2. Market Analysis, Insights and Forecast - by Range
- 6.2.1. 0.5 - 3.0 Amps
- 6.2.2. 3.1 - 35 Amps
- 6.2.3. Above 35 Amps
- 6.3. Market Analysis, Insights and Forecast - by Application
- 6.3.1. Power & Utility
- 6.3.2. Automotive
- 6.3.3. IT/Telecom
- 6.3.4. Consumer Electronics
- 6.3.5. Others
- 6.1. Market Analysis, Insights and Forecast - by Type
- 7. Europe Rectifiers Industry Analysis, Insights and Forecast, 2019-2031
- 7.1. Market Analysis, Insights and Forecast - by Type
- 7.1.1. Single Phase Rectifier
- 7.1.2. Three Phase Rectifier
- 7.2. Market Analysis, Insights and Forecast - by Range
- 7.2.1. 0.5 - 3.0 Amps
- 7.2.2. 3.1 - 35 Amps
- 7.2.3. Above 35 Amps
- 7.3. Market Analysis, Insights and Forecast - by Application
- 7.3.1. Power & Utility
- 7.3.2. Automotive
- 7.3.3. IT/Telecom
- 7.3.4. Consumer Electronics
- 7.3.5. Others
- 7.1. Market Analysis, Insights and Forecast - by Type
- 8. Asia Pacific Rectifiers Industry Analysis, Insights and Forecast, 2019-2031
- 8.1. Market Analysis, Insights and Forecast - by Type
- 8.1.1. Single Phase Rectifier
- 8.1.2. Three Phase Rectifier
- 8.2. Market Analysis, Insights and Forecast - by Range
- 8.2.1. 0.5 - 3.0 Amps
- 8.2.2. 3.1 - 35 Amps
- 8.2.3. Above 35 Amps
- 8.3. Market Analysis, Insights and Forecast - by Application
- 8.3.1. Power & Utility
- 8.3.2. Automotive
- 8.3.3. IT/Telecom
- 8.3.4. Consumer Electronics
- 8.3.5. Others
- 8.1. Market Analysis, Insights and Forecast - by Type
- 9. Middle East and Africa Rectifiers Industry Analysis, Insights and Forecast, 2019-2031
- 9.1. Market Analysis, Insights and Forecast - by Type
- 9.1.1. Single Phase Rectifier
- 9.1.2. Three Phase Rectifier
- 9.2. Market Analysis, Insights and Forecast - by Range
- 9.2.1. 0.5 - 3.0 Amps
- 9.2.2. 3.1 - 35 Amps
- 9.2.3. Above 35 Amps
- 9.3. Market Analysis, Insights and Forecast - by Application
- 9.3.1. Power & Utility
- 9.3.2. Automotive
- 9.3.3. IT/Telecom
- 9.3.4. Consumer Electronics
- 9.3.5. Others
- 9.1. Market Analysis, Insights and Forecast - by Type
- 10. Latin America Rectifiers Industry Analysis, Insights and Forecast, 2019-2031
- 10.1. Market Analysis, Insights and Forecast - by Type
- 10.1.1. Single Phase Rectifier
- 10.1.2. Three Phase Rectifier
- 10.2. Market Analysis, Insights and Forecast - by Range
- 10.2.1. 0.5 - 3.0 Amps
- 10.2.2. 3.1 - 35 Amps
- 10.2.3. Above 35 Amps
- 10.3. Market Analysis, Insights and Forecast - by Application
- 10.3.1. Power & Utility
- 10.3.2. Automotive
- 10.3.3. IT/Telecom
- 10.3.4. Consumer Electronics
- 10.3.5. Others
- 10.1. Market Analysis, Insights and Forecast - by Type
- 11. North America Rectifiers Industry Analysis, Insights and Forecast, 2019-2031
- 11.1. Market Analysis, Insights and Forecast - By Country/Sub-region
- 11.1.1.
- 12. Europe Rectifiers Industry Analysis, Insights and Forecast, 2019-2031
- 12.1. Market Analysis, Insights and Forecast - By Country/Sub-region
- 12.1.1.
- 13. Asia Pacific Rectifiers Industry Analysis, Insights and Forecast, 2019-2031
- 13.1. Market Analysis, Insights and Forecast - By Country/Sub-region
- 13.1.1.
- 14. Middle East and Africa Rectifiers Industry Analysis, Insights and Forecast, 2019-2031
- 14.1. Market Analysis, Insights and Forecast - By Country/Sub-region
- 14.1.1.
- 15. Latin America Rectifiers Industry Analysis, Insights and Forecast, 2019-2031
- 15.1. Market Analysis, Insights and Forecast - By Country/Sub-region
- 15.1.1.
- 16. Competitive Analysis
- 16.1. Global Market Share Analysis 2024
- 16.2. Company Profiles
- 16.2.1 Vishay Intertechnology Inc
- 16.2.1.1. Overview
- 16.2.1.2. Products
- 16.2.1.3. SWOT Analysis
- 16.2.1.4. Recent Developments
- 16.2.1.5. Financials (Based on Availability)
- 16.2.2 ASI Semiconductor Inc
- 16.2.2.1. Overview
- 16.2.2.2. Products
- 16.2.2.3. SWOT Analysis
- 16.2.2.4. Recent Developments
- 16.2.2.5. Financials (Based on Availability)
- 16.2.3 Infineon Technologies AG
- 16.2.3.1. Overview
- 16.2.3.2. Products
- 16.2.3.3. SWOT Analysis
- 16.2.3.4. Recent Developments
- 16.2.3.5. Financials (Based on Availability)
- 16.2.4 ROHM CO LTD
- 16.2.4.1. Overview
- 16.2.4.2. Products
- 16.2.4.3. SWOT Analysis
- 16.2.4.4. Recent Developments
- 16.2.4.5. Financials (Based on Availability)
- 16.2.5 Comchip Technology Co Ltd
- 16.2.5.1. Overview
- 16.2.5.2. Products
- 16.2.5.3. SWOT Analysis
- 16.2.5.4. Recent Developments
- 16.2.5.5. Financials (Based on Availability)
- 16.2.6 Toshiba Corporation
- 16.2.6.1. Overview
- 16.2.6.2. Products
- 16.2.6.3. SWOT Analysis
- 16.2.6.4. Recent Developments
- 16.2.6.5. Financials (Based on Availability)
- 16.2.7 Microchip Technologies
- 16.2.7.1. Overview
- 16.2.7.2. Products
- 16.2.7.3. SWOT Analysis
- 16.2.7.4. Recent Developments
- 16.2.7.5. Financials (Based on Availability)
- 16.2.8 STMicroelectronics
- 16.2.8.1. Overview
- 16.2.8.2. Products
- 16.2.8.3. SWOT Analysis
- 16.2.8.4. Recent Developments
- 16.2.8.5. Financials (Based on Availability)
- 16.2.9 PANJIT International Inc
- 16.2.9.1. Overview
- 16.2.9.2. Products
- 16.2.9.3. SWOT Analysis
- 16.2.9.4. Recent Developments
- 16.2.9.5. Financials (Based on Availability)
- 16.2.10 Diodes Incorporated
- 16.2.10.1. Overview
- 16.2.10.2. Products
- 16.2.10.3. SWOT Analysis
- 16.2.10.4. Recent Developments
- 16.2.10.5. Financials (Based on Availability)
- 16.2.11 Micro Commercial Components (MCC)
- 16.2.11.1. Overview
- 16.2.11.2. Products
- 16.2.11.3. SWOT Analysis
- 16.2.11.4. Recent Developments
- 16.2.11.5. Financials (Based on Availability)
- 16.2.12 Semiconductor Components Industries LLC*List Not Exhaustive
- 16.2.12.1. Overview
- 16.2.12.2. Products
- 16.2.12.3. SWOT Analysis
- 16.2.12.4. Recent Developments
- 16.2.12.5. Financials (Based on Availability)
- 16.2.13 Semiconductor Components Industries LLC
- 16.2.13.1. Overview
- 16.2.13.2. Products
- 16.2.13.3. SWOT Analysis
- 16.2.13.4. Recent Developments
- 16.2.13.5. Financials (Based on Availability)
- 16.2.14 Vicor Corporation
- 16.2.14.1. Overview
- 16.2.14.2. Products
- 16.2.14.3. SWOT Analysis
- 16.2.14.4. Recent Developments
- 16.2.14.5. Financials (Based on Availability)
- 16.2.15 SHINDENGEN ELECTRIC MANUFACTURING CO LTD
- 16.2.15.1. Overview
- 16.2.15.2. Products
- 16.2.15.3. SWOT Analysis
- 16.2.15.4. Recent Developments
- 16.2.15.5. Financials (Based on Availability)
- 16.2.1 Vishay Intertechnology Inc
List of Figures
- Figure 1: Global Rectifiers Industry Revenue Breakdown (Million, %) by Region 2024 & 2032
- Figure 2: North America Rectifiers Industry Revenue (Million), by Country 2024 & 2032
- Figure 3: North America Rectifiers Industry Revenue Share (%), by Country 2024 & 2032
- Figure 4: Europe Rectifiers Industry Revenue (Million), by Country 2024 & 2032
- Figure 5: Europe Rectifiers Industry Revenue Share (%), by Country 2024 & 2032
- Figure 6: Asia Pacific Rectifiers Industry Revenue (Million), by Country 2024 & 2032
- Figure 7: Asia Pacific Rectifiers Industry Revenue Share (%), by Country 2024 & 2032
- Figure 8: Middle East and Africa Rectifiers Industry Revenue (Million), by Country 2024 & 2032
- Figure 9: Middle East and Africa Rectifiers Industry Revenue Share (%), by Country 2024 & 2032
- Figure 10: Latin America Rectifiers Industry Revenue (Million), by Country 2024 & 2032
- Figure 11: Latin America Rectifiers Industry Revenue Share (%), by Country 2024 & 2032
- Figure 12: North America Rectifiers Industry Revenue (Million), by Type 2024 & 2032
- Figure 13: North America Rectifiers Industry Revenue Share (%), by Type 2024 & 2032
- Figure 14: North America Rectifiers Industry Revenue (Million), by Range 2024 & 2032
- Figure 15: North America Rectifiers Industry Revenue Share (%), by Range 2024 & 2032
- Figure 16: North America Rectifiers Industry Revenue (Million), by Application 2024 & 2032
- Figure 17: North America Rectifiers Industry Revenue Share (%), by Application 2024 & 2032
- Figure 18: North America Rectifiers Industry Revenue (Million), by Country 2024 & 2032
- Figure 19: North America Rectifiers Industry Revenue Share (%), by Country 2024 & 2032
- Figure 20: Europe Rectifiers Industry Revenue (Million), by Type 2024 & 2032
- Figure 21: Europe Rectifiers Industry Revenue Share (%), by Type 2024 & 2032
- Figure 22: Europe Rectifiers Industry Revenue (Million), by Range 2024 & 2032
- Figure 23: Europe Rectifiers Industry Revenue Share (%), by Range 2024 & 2032
- Figure 24: Europe Rectifiers Industry Revenue (Million), by Application 2024 & 2032
- Figure 25: Europe Rectifiers Industry Revenue Share (%), by Application 2024 & 2032
- Figure 26: Europe Rectifiers Industry Revenue (Million), by Country 2024 & 2032
- Figure 27: Europe Rectifiers Industry Revenue Share (%), by Country 2024 & 2032
- Figure 28: Asia Pacific Rectifiers Industry Revenue (Million), by Type 2024 & 2032
- Figure 29: Asia Pacific Rectifiers Industry Revenue Share (%), by Type 2024 & 2032
- Figure 30: Asia Pacific Rectifiers Industry Revenue (Million), by Range 2024 & 2032
- Figure 31: Asia Pacific Rectifiers Industry Revenue Share (%), by Range 2024 & 2032
- Figure 32: Asia Pacific Rectifiers Industry Revenue (Million), by Application 2024 & 2032
- Figure 33: Asia Pacific Rectifiers Industry Revenue Share (%), by Application 2024 & 2032
- Figure 34: Asia Pacific Rectifiers Industry Revenue (Million), by Country 2024 & 2032
- Figure 35: Asia Pacific Rectifiers Industry Revenue Share (%), by Country 2024 & 2032
- Figure 36: Middle East and Africa Rectifiers Industry Revenue (Million), by Type 2024 & 2032
- Figure 37: Middle East and Africa Rectifiers Industry Revenue Share (%), by Type 2024 & 2032
- Figure 38: Middle East and Africa Rectifiers Industry Revenue (Million), by Range 2024 & 2032
- Figure 39: Middle East and Africa Rectifiers Industry Revenue Share (%), by Range 2024 & 2032
- Figure 40: Middle East and Africa Rectifiers Industry Revenue (Million), by Application 2024 & 2032
- Figure 41: Middle East and Africa Rectifiers Industry Revenue Share (%), by Application 2024 & 2032
- Figure 42: Middle East and Africa Rectifiers Industry Revenue (Million), by Country 2024 & 2032
- Figure 43: Middle East and Africa Rectifiers Industry Revenue Share (%), by Country 2024 & 2032
- Figure 44: Latin America Rectifiers Industry Revenue (Million), by Type 2024 & 2032
- Figure 45: Latin America Rectifiers Industry Revenue Share (%), by Type 2024 & 2032
- Figure 46: Latin America Rectifiers Industry Revenue (Million), by Range 2024 & 2032
- Figure 47: Latin America Rectifiers Industry Revenue Share (%), by Range 2024 & 2032
- Figure 48: Latin America Rectifiers Industry Revenue (Million), by Application 2024 & 2032
- Figure 49: Latin America Rectifiers Industry Revenue Share (%), by Application 2024 & 2032
- Figure 50: Latin America Rectifiers Industry Revenue (Million), by Country 2024 & 2032
- Figure 51: Latin America Rectifiers Industry Revenue Share (%), by Country 2024 & 2032
List of Tables
- Table 1: Global Rectifiers Industry Revenue Million Forecast, by Region 2019 & 2032
- Table 2: Global Rectifiers Industry Revenue Million Forecast, by Type 2019 & 2032
- Table 3: Global Rectifiers Industry Revenue Million Forecast, by Range 2019 & 2032
- Table 4: Global Rectifiers Industry Revenue Million Forecast, by Application 2019 & 2032
- Table 5: Global Rectifiers Industry Revenue Million Forecast, by Region 2019 & 2032
- Table 6: Global Rectifiers Industry Revenue Million Forecast, by Country 2019 & 2032
- Table 7: Rectifiers Industry Revenue (Million) Forecast, by Application 2019 & 2032
- Table 8: Global Rectifiers Industry Revenue Million Forecast, by Country 2019 & 2032
- Table 9: Rectifiers Industry Revenue (Million) Forecast, by Application 2019 & 2032
- Table 10: Global Rectifiers Industry Revenue Million Forecast, by Country 2019 & 2032
- Table 11: Rectifiers Industry Revenue (Million) Forecast, by Application 2019 & 2032
- Table 12: Global Rectifiers Industry Revenue Million Forecast, by Country 2019 & 2032
- Table 13: Rectifiers Industry Revenue (Million) Forecast, by Application 2019 & 2032
- Table 14: Global Rectifiers Industry Revenue Million Forecast, by Country 2019 & 2032
- Table 15: Rectifiers Industry Revenue (Million) Forecast, by Application 2019 & 2032
- Table 16: Global Rectifiers Industry Revenue Million Forecast, by Type 2019 & 2032
- Table 17: Global Rectifiers Industry Revenue Million Forecast, by Range 2019 & 2032
- Table 18: Global Rectifiers Industry Revenue Million Forecast, by Application 2019 & 2032
- Table 19: Global Rectifiers Industry Revenue Million Forecast, by Country 2019 & 2032
- Table 20: Global Rectifiers Industry Revenue Million Forecast, by Type 2019 & 2032
- Table 21: Global Rectifiers Industry Revenue Million Forecast, by Range 2019 & 2032
- Table 22: Global Rectifiers Industry Revenue Million Forecast, by Application 2019 & 2032
- Table 23: Global Rectifiers Industry Revenue Million Forecast, by Country 2019 & 2032
- Table 24: Global Rectifiers Industry Revenue Million Forecast, by Type 2019 & 2032
- Table 25: Global Rectifiers Industry Revenue Million Forecast, by Range 2019 & 2032
- Table 26: Global Rectifiers Industry Revenue Million Forecast, by Application 2019 & 2032
- Table 27: Global Rectifiers Industry Revenue Million Forecast, by Country 2019 & 2032
- Table 28: Global Rectifiers Industry Revenue Million Forecast, by Type 2019 & 2032
- Table 29: Global Rectifiers Industry Revenue Million Forecast, by Range 2019 & 2032
- Table 30: Global Rectifiers Industry Revenue Million Forecast, by Application 2019 & 2032
- Table 31: Global Rectifiers Industry Revenue Million Forecast, by Country 2019 & 2032
- Table 32: Global Rectifiers Industry Revenue Million Forecast, by Type 2019 & 2032
- Table 33: Global Rectifiers Industry Revenue Million Forecast, by Range 2019 & 2032
- Table 34: Global Rectifiers Industry Revenue Million Forecast, by Application 2019 & 2032
- Table 35: Global Rectifiers Industry Revenue Million Forecast, by Country 2019 & 2032
Frequently Asked Questions
1. What is the projected Compound Annual Growth Rate (CAGR) of the Rectifiers Industry?
The projected CAGR is approximately 10.61%.
2. Which companies are prominent players in the Rectifiers Industry?
Key companies in the market include Vishay Intertechnology Inc, ASI Semiconductor Inc, Infineon Technologies AG, ROHM CO LTD, Comchip Technology Co Ltd, Toshiba Corporation, Microchip Technologies, STMicroelectronics, PANJIT International Inc, Diodes Incorporated, Micro Commercial Components (MCC), Semiconductor Components Industries LLC*List Not Exhaustive, Semiconductor Components Industries LLC, Vicor Corporation, SHINDENGEN ELECTRIC MANUFACTURING CO LTD.
3. What are the main segments of the Rectifiers Industry?
The market segments include Type, Range, Application.
4. Can you provide details about the market size?
The market size is estimated to be USD XX Million as of 2022.
5. What are some drivers contributing to market growth?
Increase in Demand For Rectifier Diodes for Various Applications in the Automotive Sector; Growth in Deployment of Smart Grids Across the Developing Countries.
6. What are the notable trends driving market growth?
Automotive Segment to Hold Significant Market Share.
7. Are there any restraints impacting market growth?
Affect in Supply Chain Distribution Due to Covid-19 Pandemic.
8. Can you provide examples of recent developments in the market?
N/A
9. What pricing options are available for accessing the report?
Pricing options include single-user, multi-user, and enterprise licenses priced at USD 4750, USD 5250, and USD 8750 respectively.
10. Is the market size provided in terms of value or volume?
The market size is provided in terms of value, measured in Million.
11. Are there any specific market keywords associated with the report?
Yes, the market keyword associated with the report is "Rectifiers Industry," which aids in identifying and referencing the specific market segment covered.
12. How do I determine which pricing option suits my needs best?
The pricing options vary based on user requirements and access needs. Individual users may opt for single-user licenses, while businesses requiring broader access may choose multi-user or enterprise licenses for cost-effective access to the report.
13. Are there any additional resources or data provided in the Rectifiers Industry report?
While the report offers comprehensive insights, it's advisable to review the specific contents or supplementary materials provided to ascertain if additional resources or data are available.
14. How can I stay updated on further developments or reports in the Rectifiers Industry?
To stay informed about further developments, trends, and reports in the Rectifiers Industry, consider subscribing to industry newsletters, following relevant companies and organizations, or regularly checking reputable industry news sources and publications.
Methodology
Step 1 - Identification of Relevant Samples Size from Population Database


Step 2 - Approaches for Defining Global Market Size (Value, Volume* & Price*)

Note*: In applicable scenarios
Step 3 - Data Sources
Primary Research
- Web Analytics
- Survey Reports
- Research Institute
- Latest Research Reports
- Opinion Leaders
Secondary Research
- Annual Reports
- White Paper
- Latest Press Release
- Industry Association
- Paid Database
- Investor Presentations

Step 4 - Data Triangulation
Involves using different sources of information in order to increase the validity of a study
These sources are likely to be stakeholders in a program - participants, other researchers, program staff, other community members, and so on.
Then we put all data in single framework & apply various statistical tools to find out the dynamic on the market.
During the analysis stage, feedback from the stakeholder groups would be compared to determine areas of agreement as well as areas of divergence


