
Key Insights
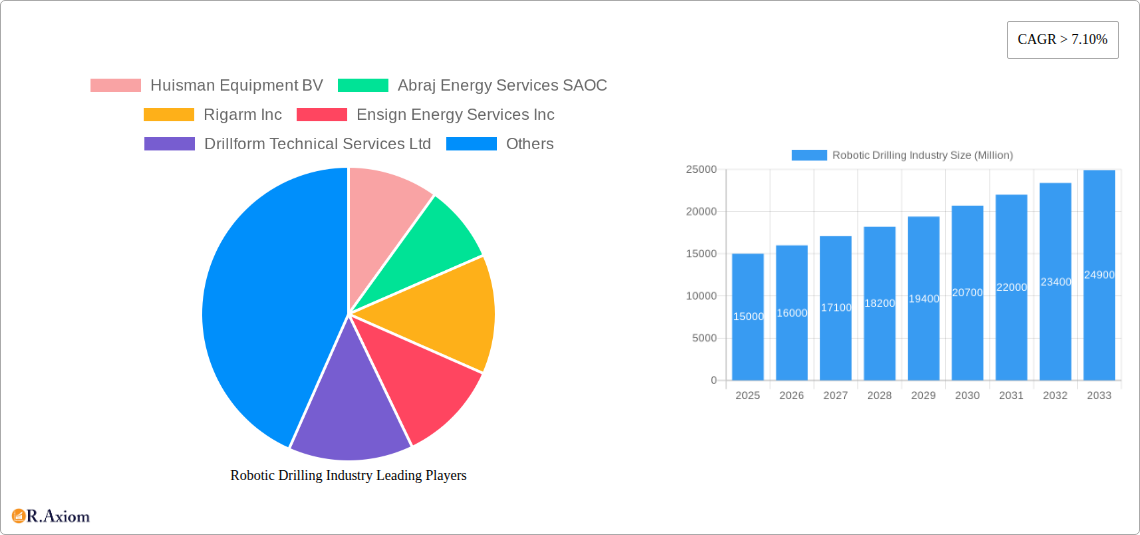
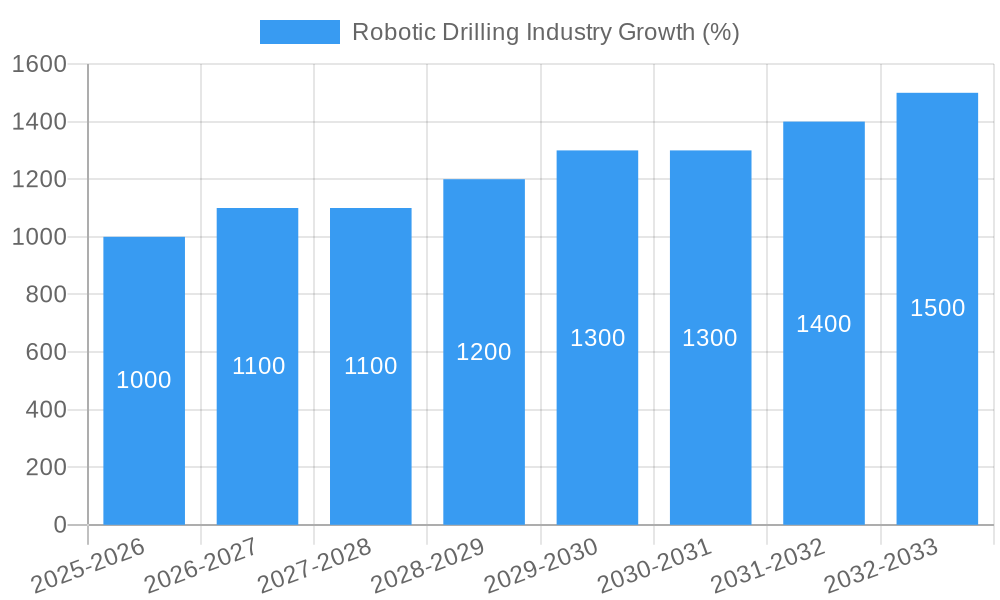
The global robotic drilling market is experiencing robust growth, projected to maintain a Compound Annual Growth Rate (CAGR) exceeding 7.10% from 2025 to 2033. This expansion is driven by several key factors. Firstly, the increasing demand for enhanced safety and efficiency in oil and gas exploration and production is fueling the adoption of robotic systems. These systems minimize human intervention in hazardous environments, reducing risks associated with drilling operations and improving overall productivity. Secondly, advancements in robotics and automation technologies, including improved sensors, AI-powered control systems, and more robust robotic manipulators, are continuously enhancing the capabilities and reliability of robotic drilling equipment. This leads to higher precision drilling, reduced operational downtime, and improved resource utilization. Furthermore, the growing need for deepwater and unconventional drilling, coupled with the limitations of traditional methods in these challenging environments, creates significant opportunities for robotic solutions. Finally, the ongoing push for sustainable and environmentally responsible energy extraction practices contributes positively to the market, as robotic systems can contribute to reducing the overall environmental impact of drilling operations.
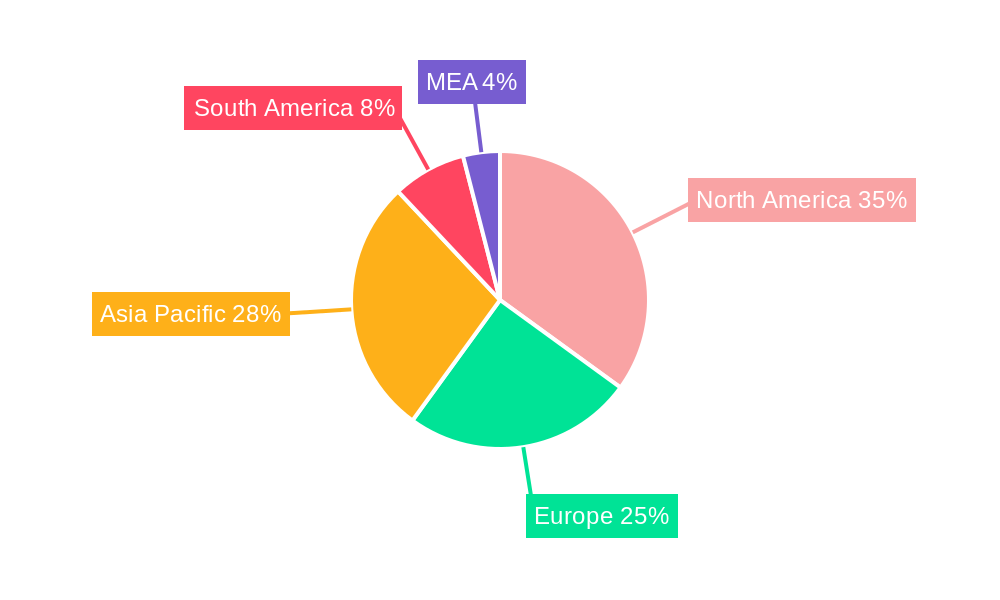
The market segmentation reveals significant opportunities across both deployment types (onshore and offshore) and components (hardware and software). While offshore deployment currently holds a larger market share due to the higher inherent risks and complexities, the onshore segment is expected to witness significant growth fueled by the increasing adoption of automation in conventional drilling. Similarly, the hardware segment dominates presently, but the software and control systems segment is predicted to experience faster growth owing to advancements in AI and machine learning applications improving the overall efficiency and accuracy of robotic drilling systems. Key players like Huisman Equipment BV, Abraj Energy Services SAOC, and Nabors Industries Ltd are actively shaping the market landscape through innovation and strategic partnerships. Geographical expansion is also prominent, with North America and the Asia-Pacific region showing strong growth potential due to their extensive oil and gas reserves and increasing investments in technological advancements within the energy sector. However, challenges like the high initial investment costs associated with robotic drilling systems and the need for skilled workforce training to effectively operate and maintain these complex systems act as restraints on immediate widespread adoption.
This comprehensive report provides an in-depth analysis of the global robotic drilling industry, covering market size, segmentation, key players, growth drivers, challenges, and future opportunities. The study period spans from 2019 to 2033, with 2025 serving as the base and estimated year. The forecast period extends from 2025 to 2033, while the historical period covers 2019-2024. This report is an essential resource for industry stakeholders, investors, and anyone seeking a thorough understanding of this dynamic market.
Robotic Drilling Industry Market Concentration & Innovation
This section analyzes the competitive landscape of the robotic drilling industry, encompassing market concentration, innovation drivers, regulatory frameworks, product substitutes, end-user trends, and mergers and acquisitions (M&A) activities.
The robotic drilling market exhibits a moderately concentrated structure with several key players holding significant market share. Precise market share figures for individual companies are not publicly available for this nascent industry and require extensive proprietary research. However, companies like Nabors Industries Ltd and National-Oilwell Varco Inc hold substantial influence due to their established presence in the broader oil and gas drilling sector and their ongoing investments in robotic technologies. Estimates place the combined market share of the top five players at approximately xx%.
Innovation Drivers:
- Automation to improve efficiency and safety.
- Advancements in robotics, AI, and machine learning.
- Demand for reducing operational costs and human intervention in hazardous environments.
Regulatory Frameworks:
Varying regulatory landscapes across different regions impact the adoption of robotic drilling technologies. Stringent safety regulations, especially in offshore operations, necessitate robust testing and certification processes, potentially slowing market penetration in some areas.
Product Substitutes:
Traditional drilling methods remain dominant, but increasing technological advancements in robotic systems are gradually creating a competitive landscape.
End-User Trends:
The energy sector’s increasing demand for cost-effective and safer drilling methods is the primary driver for adopting robotic drilling technologies.
M&A Activities:
The industry has witnessed several strategic M&A activities focused on acquiring companies specializing in automation, robotics, and related technologies. While precise deal values are often confidential, some transactions have exceeded USD xx million, indicating significant investment in this area.
Robotic Drilling Industry Industry Trends & Insights
The global robotic drilling market is experiencing significant growth, driven by advancements in automation technologies and the demand for enhanced efficiency and safety in drilling operations. The Compound Annual Growth Rate (CAGR) during the forecast period (2025-2033) is projected to be xx%, indicating substantial market expansion. Market penetration of robotic drilling systems remains relatively low compared to traditional methods, but it is anticipated to increase significantly during this period due to technological advancements and the increasing acceptance of automation in the industry.
Several technological disruptions are reshaping the industry, including the development of autonomous drilling systems, the integration of artificial intelligence and machine learning algorithms, and improvements in sensor technology for real-time monitoring and control. These advancements are improving drilling precision, efficiency, and safety. Consumer preference shifts towards environmentally friendly and cost-effective drilling solutions further fuel the market's growth. Competitive dynamics are intense, with established drilling companies and emerging technology firms actively competing for market share through innovation and strategic partnerships.
Dominant Markets & Segments in Robotic Drilling Industry
While the global robotic drilling market is still developing, significant regional variations exist in adoption and growth rates.
Leading Regions/Countries:
- North America (USA, Canada) holds a leading position, driven by robust exploration and production activities and high investments in automation technologies.
- The Middle East and Asia-Pacific regions are expected to show substantial growth, driven by increasing energy demands and infrastructure development.
Dominant Segments:
- Deployment: Onshore deployment currently holds a larger market share than offshore due to lower initial implementation costs and simpler regulatory environments. However, offshore deployment is projected to witness faster growth due to the potential for significant efficiency improvements and safety enhancements in challenging marine environments.
- Component: The hardware segment dominates the market due to the extensive infrastructure requirements for robotic drilling systems. However, the software segment is expected to show faster growth driven by advancements in automation software, AI-powered drilling optimization, and predictive maintenance.
Key Drivers:
- Economic policies that incentivize the adoption of advanced technologies in the energy sector.
- Government investment in infrastructure development to support the energy industry's growth.
The dominance of North America is primarily due to substantial investments in R&D, a strong regulatory framework supporting innovation, and the presence of major players like Nabors Industries Ltd. The rapid growth expected in the Middle East and Asia-Pacific regions results from substantial investments in oil and gas exploration, a push for improved safety and efficiency, and government incentives for technology adoption.
Robotic Drilling Industry Product Developments
Recent product developments focus on creating fully autonomous drilling rigs with integrated AI and machine learning capabilities. These systems improve efficiency, reduce human error, and enhance safety by automating tasks previously requiring human intervention in hazardous environments. A notable advancement is the implementation of real-time data analytics that enables predictive maintenance, reducing downtime and improving operational costs. This integration of advanced technologies is leading to a shift towards more efficient, safer, and cost-effective drilling operations, making robotic drilling systems increasingly attractive to the oil and gas industry.
Report Scope & Segmentation Analysis
This report segments the robotic drilling market based on deployment (onshore, offshore) and component (hardware, software).
Deployment:
- Onshore: This segment is projected to dominate the market initially, driven by the relatively lower implementation costs and quicker regulatory approvals. Growth is driven by a focus on improving efficiency and safety on land-based drilling sites.
- Offshore: While currently smaller, this segment is expected to witness faster growth driven by the significant potential benefits of automation in deepwater drilling. Regulatory hurdles and high initial investment costs pose challenges.
Component:
- Hardware: The hardware segment accounts for a significant portion of the market size due to the complexity and costs of robotic drilling equipment. Growth will be largely driven by advancements in robotics, sensors, and actuation systems.
- Software: The software segment is expected to exhibit higher growth due to the increasing need for advanced control algorithms, data analytics, and AI-powered optimization tools.
Key Drivers of Robotic Drilling Industry Growth
The robotic drilling industry's growth is fueled by several factors:
- Technological advancements: The rapid development of AI, robotics, and machine learning technologies enables the creation of more efficient and safe drilling systems.
- Economic drivers: The increasing demand for cost-effective and efficient oil and gas exploration drives the adoption of automated drilling solutions to reduce operational expenses.
- Regulatory factors: Governments worldwide are incentivizing the adoption of advanced technologies for environmental sustainability and enhanced safety in the energy industry. For example, regulations around reducing human exposure to hazardous environments are promoting the use of robotic systems.
Challenges in the Robotic Drilling Industry Sector
Several challenges hinder the widespread adoption of robotic drilling technology:
- High initial investment costs: The cost of developing and deploying robotic drilling systems is a major barrier for many companies.
- Regulatory hurdles: The approval process and stringent safety regulations can slow down the market penetration, especially in offshore operations.
- Integration complexities: Integrating robotic systems into existing infrastructure can be challenging and require substantial modifications and extensive training for personnel. This can translate to additional project costs and delays.
Emerging Opportunities in Robotic Drilling Industry
Significant opportunities exist for the robotic drilling industry:
- New market segments: Expanding into unconventional drilling operations and geothermal energy exploration offers new growth avenues.
- Technological advancements: Continuous research and development lead to more efficient, adaptable, and safer robotic drilling systems. Developments in smaller, modular systems could improve accessibility and reduce initial capital expenditures.
- Increased collaboration: Partnerships between drilling companies and technology providers accelerate innovation and speed up market penetration.
Leading Players in the Robotic Drilling Industry Market
- Huisman Equipment BV
- Abraj Energy Services SAOC
- Rigarm Inc
- Ensign Energy Services Inc
- Drillform Technical Services Ltd
- Automated Rig Technologies Ltd
- Nabors Industries Ltd
- Drillmec Inc
- National-Oilwell Varco Inc
- Sekal AS
Key Developments in Robotic Drilling Industry Industry
- March 2021: Schlumberger secured a USD 480 million contract to drill 96 oil wells in southern Iraq, highlighting the significant demand for drilling services and the potential for robotic solutions in large-scale projects.
- October 2021: Nabors Industries Ltd. launched the PACE-R801, the world's first fully automated land drilling rig, demonstrating a significant technological leap and emphasizing the trend toward automation in the drilling industry. The successful operation of this rig in the Permian Basin showcases the potential for enhanced safety and efficiency.
Strategic Outlook for Robotic Drilling Industry Market
The robotic drilling industry is poised for substantial growth driven by technological advancements, increasing demand for efficiency and safety, and supportive government policies. Future opportunities lie in expanding into new markets, developing more sophisticated autonomous systems, and leveraging data analytics to further optimize drilling operations. The continued focus on innovation and collaboration within the industry will be critical in driving further market expansion and shaping the future of drilling operations.
Robotic Drilling Industry Segmentation
-
1. Deployment
- 1.1. Onshore
- 1.2. Offshore
-
2. Component
- 2.1. Hardware
- 2.2. Software
Robotic Drilling Industry Segmentation By Geography
- 1. North America
- 2. Europe
- 3. Asia Pacific
- 4. Rest of the World
Robotic Drilling Industry REPORT HIGHLIGHTS
| Aspects | Details |
|---|---|
| Study Period | 2019-2033 |
| Base Year | 2024 |
| Estimated Year | 2025 |
| Forecast Period | 2025-2033 |
| Historical Period | 2019-2024 |
| Growth Rate | CAGR of > 7.10% from 2019-2033 |
| Segmentation |
|
Table of Contents
- 1. Introduction
- 1.1. Research Scope
- 1.2. Market Segmentation
- 1.3. Research Methodology
- 1.4. Definitions and Assumptions
- 2. Executive Summary
- 2.1. Introduction
- 3. Market Dynamics
- 3.1. Introduction
- 3.2. Market Drivers
- 3.2.1. 4.; Higher Demand for Oil and Gas in the Country4.; Growing Infrastructure Development
- 3.3. Market Restrains
- 3.3.1. 4.; Competition from Renewable Energy
- 3.4. Market Trends
- 3.4.1. Onshore to Dominate the Market
- 4. Market Factor Analysis
- 4.1. Porters Five Forces
- 4.2. Supply/Value Chain
- 4.3. PESTEL analysis
- 4.4. Market Entropy
- 4.5. Patent/Trademark Analysis
- 5. Global Robotic Drilling Industry Analysis, Insights and Forecast, 2019-2031
- 5.1. Market Analysis, Insights and Forecast - by Deployment
- 5.1.1. Onshore
- 5.1.2. Offshore
- 5.2. Market Analysis, Insights and Forecast - by Component
- 5.2.1. Hardware
- 5.2.2. Software
- 5.3. Market Analysis, Insights and Forecast - by Region
- 5.3.1. North America
- 5.3.2. Europe
- 5.3.3. Asia Pacific
- 5.3.4. Rest of the World
- 5.1. Market Analysis, Insights and Forecast - by Deployment
- 6. North America Robotic Drilling Industry Analysis, Insights and Forecast, 2019-2031
- 6.1. Market Analysis, Insights and Forecast - by Deployment
- 6.1.1. Onshore
- 6.1.2. Offshore
- 6.2. Market Analysis, Insights and Forecast - by Component
- 6.2.1. Hardware
- 6.2.2. Software
- 6.1. Market Analysis, Insights and Forecast - by Deployment
- 7. Europe Robotic Drilling Industry Analysis, Insights and Forecast, 2019-2031
- 7.1. Market Analysis, Insights and Forecast - by Deployment
- 7.1.1. Onshore
- 7.1.2. Offshore
- 7.2. Market Analysis, Insights and Forecast - by Component
- 7.2.1. Hardware
- 7.2.2. Software
- 7.1. Market Analysis, Insights and Forecast - by Deployment
- 8. Asia Pacific Robotic Drilling Industry Analysis, Insights and Forecast, 2019-2031
- 8.1. Market Analysis, Insights and Forecast - by Deployment
- 8.1.1. Onshore
- 8.1.2. Offshore
- 8.2. Market Analysis, Insights and Forecast - by Component
- 8.2.1. Hardware
- 8.2.2. Software
- 8.1. Market Analysis, Insights and Forecast - by Deployment
- 9. Rest of the World Robotic Drilling Industry Analysis, Insights and Forecast, 2019-2031
- 9.1. Market Analysis, Insights and Forecast - by Deployment
- 9.1.1. Onshore
- 9.1.2. Offshore
- 9.2. Market Analysis, Insights and Forecast - by Component
- 9.2.1. Hardware
- 9.2.2. Software
- 9.1. Market Analysis, Insights and Forecast - by Deployment
- 10. North America Robotic Drilling Industry Analysis, Insights and Forecast, 2019-2031
- 10.1. Market Analysis, Insights and Forecast - By Country/Sub-region
- 10.1.1 United States
- 10.1.2 Canada
- 10.1.3 Mexico
- 11. Europe Robotic Drilling Industry Analysis, Insights and Forecast, 2019-2031
- 11.1. Market Analysis, Insights and Forecast - By Country/Sub-region
- 11.1.1 Germany
- 11.1.2 United Kingdom
- 11.1.3 France
- 11.1.4 Spain
- 11.1.5 Italy
- 11.1.6 Spain
- 11.1.7 Belgium
- 11.1.8 Netherland
- 11.1.9 Nordics
- 11.1.10 Rest of Europe
- 12. Asia Pacific Robotic Drilling Industry Analysis, Insights and Forecast, 2019-2031
- 12.1. Market Analysis, Insights and Forecast - By Country/Sub-region
- 12.1.1 China
- 12.1.2 Japan
- 12.1.3 India
- 12.1.4 South Korea
- 12.1.5 Southeast Asia
- 12.1.6 Australia
- 12.1.7 Indonesia
- 12.1.8 Phillipes
- 12.1.9 Singapore
- 12.1.10 Thailandc
- 12.1.11 Rest of Asia Pacific
- 13. South America Robotic Drilling Industry Analysis, Insights and Forecast, 2019-2031
- 13.1. Market Analysis, Insights and Forecast - By Country/Sub-region
- 13.1.1 Brazil
- 13.1.2 Argentina
- 13.1.3 Peru
- 13.1.4 Chile
- 13.1.5 Colombia
- 13.1.6 Ecuador
- 13.1.7 Venezuela
- 13.1.8 Rest of South America
- 14. North America Robotic Drilling Industry Analysis, Insights and Forecast, 2019-2031
- 14.1. Market Analysis, Insights and Forecast - By Country/Sub-region
- 14.1.1 United States
- 14.1.2 Canada
- 14.1.3 Mexico
- 15. MEA Robotic Drilling Industry Analysis, Insights and Forecast, 2019-2031
- 15.1. Market Analysis, Insights and Forecast - By Country/Sub-region
- 15.1.1 United Arab Emirates
- 15.1.2 Saudi Arabia
- 15.1.3 South Africa
- 15.1.4 Rest of Middle East and Africa
- 16. Competitive Analysis
- 16.1. Global Market Share Analysis 2024
- 16.2. Company Profiles
- 16.2.1 Huisman Equipment BV
- 16.2.1.1. Overview
- 16.2.1.2. Products
- 16.2.1.3. SWOT Analysis
- 16.2.1.4. Recent Developments
- 16.2.1.5. Financials (Based on Availability)
- 16.2.2 Abraj Energy Services SAOC
- 16.2.2.1. Overview
- 16.2.2.2. Products
- 16.2.2.3. SWOT Analysis
- 16.2.2.4. Recent Developments
- 16.2.2.5. Financials (Based on Availability)
- 16.2.3 Rigarm Inc
- 16.2.3.1. Overview
- 16.2.3.2. Products
- 16.2.3.3. SWOT Analysis
- 16.2.3.4. Recent Developments
- 16.2.3.5. Financials (Based on Availability)
- 16.2.4 Ensign Energy Services Inc
- 16.2.4.1. Overview
- 16.2.4.2. Products
- 16.2.4.3. SWOT Analysis
- 16.2.4.4. Recent Developments
- 16.2.4.5. Financials (Based on Availability)
- 16.2.5 Drillform Technical Services Ltd
- 16.2.5.1. Overview
- 16.2.5.2. Products
- 16.2.5.3. SWOT Analysis
- 16.2.5.4. Recent Developments
- 16.2.5.5. Financials (Based on Availability)
- 16.2.6 Automated Rig Technologies Ltd
- 16.2.6.1. Overview
- 16.2.6.2. Products
- 16.2.6.3. SWOT Analysis
- 16.2.6.4. Recent Developments
- 16.2.6.5. Financials (Based on Availability)
- 16.2.7 Nabors Industries Ltd*List Not Exhaustive
- 16.2.7.1. Overview
- 16.2.7.2. Products
- 16.2.7.3. SWOT Analysis
- 16.2.7.4. Recent Developments
- 16.2.7.5. Financials (Based on Availability)
- 16.2.8 Drillmec Inc
- 16.2.8.1. Overview
- 16.2.8.2. Products
- 16.2.8.3. SWOT Analysis
- 16.2.8.4. Recent Developments
- 16.2.8.5. Financials (Based on Availability)
- 16.2.9 National-Oilwell Varco Inc
- 16.2.9.1. Overview
- 16.2.9.2. Products
- 16.2.9.3. SWOT Analysis
- 16.2.9.4. Recent Developments
- 16.2.9.5. Financials (Based on Availability)
- 16.2.10 Sekal AS
- 16.2.10.1. Overview
- 16.2.10.2. Products
- 16.2.10.3. SWOT Analysis
- 16.2.10.4. Recent Developments
- 16.2.10.5. Financials (Based on Availability)
- 16.2.1 Huisman Equipment BV
List of Figures
- Figure 1: Global Robotic Drilling Industry Revenue Breakdown (Million, %) by Region 2024 & 2032
- Figure 2: North America Robotic Drilling Industry Revenue (Million), by Country 2024 & 2032
- Figure 3: North America Robotic Drilling Industry Revenue Share (%), by Country 2024 & 2032
- Figure 4: Europe Robotic Drilling Industry Revenue (Million), by Country 2024 & 2032
- Figure 5: Europe Robotic Drilling Industry Revenue Share (%), by Country 2024 & 2032
- Figure 6: Asia Pacific Robotic Drilling Industry Revenue (Million), by Country 2024 & 2032
- Figure 7: Asia Pacific Robotic Drilling Industry Revenue Share (%), by Country 2024 & 2032
- Figure 8: South America Robotic Drilling Industry Revenue (Million), by Country 2024 & 2032
- Figure 9: South America Robotic Drilling Industry Revenue Share (%), by Country 2024 & 2032
- Figure 10: North America Robotic Drilling Industry Revenue (Million), by Country 2024 & 2032
- Figure 11: North America Robotic Drilling Industry Revenue Share (%), by Country 2024 & 2032
- Figure 12: MEA Robotic Drilling Industry Revenue (Million), by Country 2024 & 2032
- Figure 13: MEA Robotic Drilling Industry Revenue Share (%), by Country 2024 & 2032
- Figure 14: North America Robotic Drilling Industry Revenue (Million), by Deployment 2024 & 2032
- Figure 15: North America Robotic Drilling Industry Revenue Share (%), by Deployment 2024 & 2032
- Figure 16: North America Robotic Drilling Industry Revenue (Million), by Component 2024 & 2032
- Figure 17: North America Robotic Drilling Industry Revenue Share (%), by Component 2024 & 2032
- Figure 18: North America Robotic Drilling Industry Revenue (Million), by Country 2024 & 2032
- Figure 19: North America Robotic Drilling Industry Revenue Share (%), by Country 2024 & 2032
- Figure 20: Europe Robotic Drilling Industry Revenue (Million), by Deployment 2024 & 2032
- Figure 21: Europe Robotic Drilling Industry Revenue Share (%), by Deployment 2024 & 2032
- Figure 22: Europe Robotic Drilling Industry Revenue (Million), by Component 2024 & 2032
- Figure 23: Europe Robotic Drilling Industry Revenue Share (%), by Component 2024 & 2032
- Figure 24: Europe Robotic Drilling Industry Revenue (Million), by Country 2024 & 2032
- Figure 25: Europe Robotic Drilling Industry Revenue Share (%), by Country 2024 & 2032
- Figure 26: Asia Pacific Robotic Drilling Industry Revenue (Million), by Deployment 2024 & 2032
- Figure 27: Asia Pacific Robotic Drilling Industry Revenue Share (%), by Deployment 2024 & 2032
- Figure 28: Asia Pacific Robotic Drilling Industry Revenue (Million), by Component 2024 & 2032
- Figure 29: Asia Pacific Robotic Drilling Industry Revenue Share (%), by Component 2024 & 2032
- Figure 30: Asia Pacific Robotic Drilling Industry Revenue (Million), by Country 2024 & 2032
- Figure 31: Asia Pacific Robotic Drilling Industry Revenue Share (%), by Country 2024 & 2032
- Figure 32: Rest of the World Robotic Drilling Industry Revenue (Million), by Deployment 2024 & 2032
- Figure 33: Rest of the World Robotic Drilling Industry Revenue Share (%), by Deployment 2024 & 2032
- Figure 34: Rest of the World Robotic Drilling Industry Revenue (Million), by Component 2024 & 2032
- Figure 35: Rest of the World Robotic Drilling Industry Revenue Share (%), by Component 2024 & 2032
- Figure 36: Rest of the World Robotic Drilling Industry Revenue (Million), by Country 2024 & 2032
- Figure 37: Rest of the World Robotic Drilling Industry Revenue Share (%), by Country 2024 & 2032
List of Tables
- Table 1: Global Robotic Drilling Industry Revenue Million Forecast, by Region 2019 & 2032
- Table 2: Global Robotic Drilling Industry Revenue Million Forecast, by Deployment 2019 & 2032
- Table 3: Global Robotic Drilling Industry Revenue Million Forecast, by Component 2019 & 2032
- Table 4: Global Robotic Drilling Industry Revenue Million Forecast, by Region 2019 & 2032
- Table 5: Global Robotic Drilling Industry Revenue Million Forecast, by Country 2019 & 2032
- Table 6: United States Robotic Drilling Industry Revenue (Million) Forecast, by Application 2019 & 2032
- Table 7: Canada Robotic Drilling Industry Revenue (Million) Forecast, by Application 2019 & 2032
- Table 8: Mexico Robotic Drilling Industry Revenue (Million) Forecast, by Application 2019 & 2032
- Table 9: Global Robotic Drilling Industry Revenue Million Forecast, by Country 2019 & 2032
- Table 10: Germany Robotic Drilling Industry Revenue (Million) Forecast, by Application 2019 & 2032
- Table 11: United Kingdom Robotic Drilling Industry Revenue (Million) Forecast, by Application 2019 & 2032
- Table 12: France Robotic Drilling Industry Revenue (Million) Forecast, by Application 2019 & 2032
- Table 13: Spain Robotic Drilling Industry Revenue (Million) Forecast, by Application 2019 & 2032
- Table 14: Italy Robotic Drilling Industry Revenue (Million) Forecast, by Application 2019 & 2032
- Table 15: Spain Robotic Drilling Industry Revenue (Million) Forecast, by Application 2019 & 2032
- Table 16: Belgium Robotic Drilling Industry Revenue (Million) Forecast, by Application 2019 & 2032
- Table 17: Netherland Robotic Drilling Industry Revenue (Million) Forecast, by Application 2019 & 2032
- Table 18: Nordics Robotic Drilling Industry Revenue (Million) Forecast, by Application 2019 & 2032
- Table 19: Rest of Europe Robotic Drilling Industry Revenue (Million) Forecast, by Application 2019 & 2032
- Table 20: Global Robotic Drilling Industry Revenue Million Forecast, by Country 2019 & 2032
- Table 21: China Robotic Drilling Industry Revenue (Million) Forecast, by Application 2019 & 2032
- Table 22: Japan Robotic Drilling Industry Revenue (Million) Forecast, by Application 2019 & 2032
- Table 23: India Robotic Drilling Industry Revenue (Million) Forecast, by Application 2019 & 2032
- Table 24: South Korea Robotic Drilling Industry Revenue (Million) Forecast, by Application 2019 & 2032
- Table 25: Southeast Asia Robotic Drilling Industry Revenue (Million) Forecast, by Application 2019 & 2032
- Table 26: Australia Robotic Drilling Industry Revenue (Million) Forecast, by Application 2019 & 2032
- Table 27: Indonesia Robotic Drilling Industry Revenue (Million) Forecast, by Application 2019 & 2032
- Table 28: Phillipes Robotic Drilling Industry Revenue (Million) Forecast, by Application 2019 & 2032
- Table 29: Singapore Robotic Drilling Industry Revenue (Million) Forecast, by Application 2019 & 2032
- Table 30: Thailandc Robotic Drilling Industry Revenue (Million) Forecast, by Application 2019 & 2032
- Table 31: Rest of Asia Pacific Robotic Drilling Industry Revenue (Million) Forecast, by Application 2019 & 2032
- Table 32: Global Robotic Drilling Industry Revenue Million Forecast, by Country 2019 & 2032
- Table 33: Brazil Robotic Drilling Industry Revenue (Million) Forecast, by Application 2019 & 2032
- Table 34: Argentina Robotic Drilling Industry Revenue (Million) Forecast, by Application 2019 & 2032
- Table 35: Peru Robotic Drilling Industry Revenue (Million) Forecast, by Application 2019 & 2032
- Table 36: Chile Robotic Drilling Industry Revenue (Million) Forecast, by Application 2019 & 2032
- Table 37: Colombia Robotic Drilling Industry Revenue (Million) Forecast, by Application 2019 & 2032
- Table 38: Ecuador Robotic Drilling Industry Revenue (Million) Forecast, by Application 2019 & 2032
- Table 39: Venezuela Robotic Drilling Industry Revenue (Million) Forecast, by Application 2019 & 2032
- Table 40: Rest of South America Robotic Drilling Industry Revenue (Million) Forecast, by Application 2019 & 2032
- Table 41: Global Robotic Drilling Industry Revenue Million Forecast, by Country 2019 & 2032
- Table 42: United States Robotic Drilling Industry Revenue (Million) Forecast, by Application 2019 & 2032
- Table 43: Canada Robotic Drilling Industry Revenue (Million) Forecast, by Application 2019 & 2032
- Table 44: Mexico Robotic Drilling Industry Revenue (Million) Forecast, by Application 2019 & 2032
- Table 45: Global Robotic Drilling Industry Revenue Million Forecast, by Country 2019 & 2032
- Table 46: United Arab Emirates Robotic Drilling Industry Revenue (Million) Forecast, by Application 2019 & 2032
- Table 47: Saudi Arabia Robotic Drilling Industry Revenue (Million) Forecast, by Application 2019 & 2032
- Table 48: South Africa Robotic Drilling Industry Revenue (Million) Forecast, by Application 2019 & 2032
- Table 49: Rest of Middle East and Africa Robotic Drilling Industry Revenue (Million) Forecast, by Application 2019 & 2032
- Table 50: Global Robotic Drilling Industry Revenue Million Forecast, by Deployment 2019 & 2032
- Table 51: Global Robotic Drilling Industry Revenue Million Forecast, by Component 2019 & 2032
- Table 52: Global Robotic Drilling Industry Revenue Million Forecast, by Country 2019 & 2032
- Table 53: Global Robotic Drilling Industry Revenue Million Forecast, by Deployment 2019 & 2032
- Table 54: Global Robotic Drilling Industry Revenue Million Forecast, by Component 2019 & 2032
- Table 55: Global Robotic Drilling Industry Revenue Million Forecast, by Country 2019 & 2032
- Table 56: Global Robotic Drilling Industry Revenue Million Forecast, by Deployment 2019 & 2032
- Table 57: Global Robotic Drilling Industry Revenue Million Forecast, by Component 2019 & 2032
- Table 58: Global Robotic Drilling Industry Revenue Million Forecast, by Country 2019 & 2032
- Table 59: Global Robotic Drilling Industry Revenue Million Forecast, by Deployment 2019 & 2032
- Table 60: Global Robotic Drilling Industry Revenue Million Forecast, by Component 2019 & 2032
- Table 61: Global Robotic Drilling Industry Revenue Million Forecast, by Country 2019 & 2032
Frequently Asked Questions
1. What is the projected Compound Annual Growth Rate (CAGR) of the Robotic Drilling Industry?
The projected CAGR is approximately > 7.10%.
2. Which companies are prominent players in the Robotic Drilling Industry?
Key companies in the market include Huisman Equipment BV, Abraj Energy Services SAOC, Rigarm Inc, Ensign Energy Services Inc, Drillform Technical Services Ltd, Automated Rig Technologies Ltd, Nabors Industries Ltd*List Not Exhaustive, Drillmec Inc, National-Oilwell Varco Inc, Sekal AS.
3. What are the main segments of the Robotic Drilling Industry?
The market segments include Deployment, Component.
4. Can you provide details about the market size?
The market size is estimated to be USD XX Million as of 2022.
5. What are some drivers contributing to market growth?
4.; Higher Demand for Oil and Gas in the Country4.; Growing Infrastructure Development.
6. What are the notable trends driving market growth?
Onshore to Dominate the Market.
7. Are there any restraints impacting market growth?
4.; Competition from Renewable Energy.
8. Can you provide examples of recent developments in the market?
In March 2021, Schlumberger won a USD 480 million contract to drill 96 oil wells in southern Iraq for Basra Oil Company and ExxonMobil, which operates the giant West Qurna-1 field with partners from Iraq, Japan, Indonesia, and China.
9. What pricing options are available for accessing the report?
Pricing options include single-user, multi-user, and enterprise licenses priced at USD 4750, USD 5250, and USD 8750 respectively.
10. Is the market size provided in terms of value or volume?
The market size is provided in terms of value, measured in Million.
11. Are there any specific market keywords associated with the report?
Yes, the market keyword associated with the report is "Robotic Drilling Industry," which aids in identifying and referencing the specific market segment covered.
12. How do I determine which pricing option suits my needs best?
The pricing options vary based on user requirements and access needs. Individual users may opt for single-user licenses, while businesses requiring broader access may choose multi-user or enterprise licenses for cost-effective access to the report.
13. Are there any additional resources or data provided in the Robotic Drilling Industry report?
While the report offers comprehensive insights, it's advisable to review the specific contents or supplementary materials provided to ascertain if additional resources or data are available.
14. How can I stay updated on further developments or reports in the Robotic Drilling Industry?
To stay informed about further developments, trends, and reports in the Robotic Drilling Industry, consider subscribing to industry newsletters, following relevant companies and organizations, or regularly checking reputable industry news sources and publications.
Methodology
Step 1 - Identification of Relevant Samples Size from Population Database


Step 2 - Approaches for Defining Global Market Size (Value, Volume* & Price*)

Note*: In applicable scenarios
Step 3 - Data Sources
Primary Research
- Web Analytics
- Survey Reports
- Research Institute
- Latest Research Reports
- Opinion Leaders
Secondary Research
- Annual Reports
- White Paper
- Latest Press Release
- Industry Association
- Paid Database
- Investor Presentations

Step 4 - Data Triangulation
Involves using different sources of information in order to increase the validity of a study
These sources are likely to be stakeholders in a program - participants, other researchers, program staff, other community members, and so on.
Then we put all data in single framework & apply various statistical tools to find out the dynamic on the market.
During the analysis stage, feedback from the stakeholder groups would be compared to determine areas of agreement as well as areas of divergence


