
Key Insights
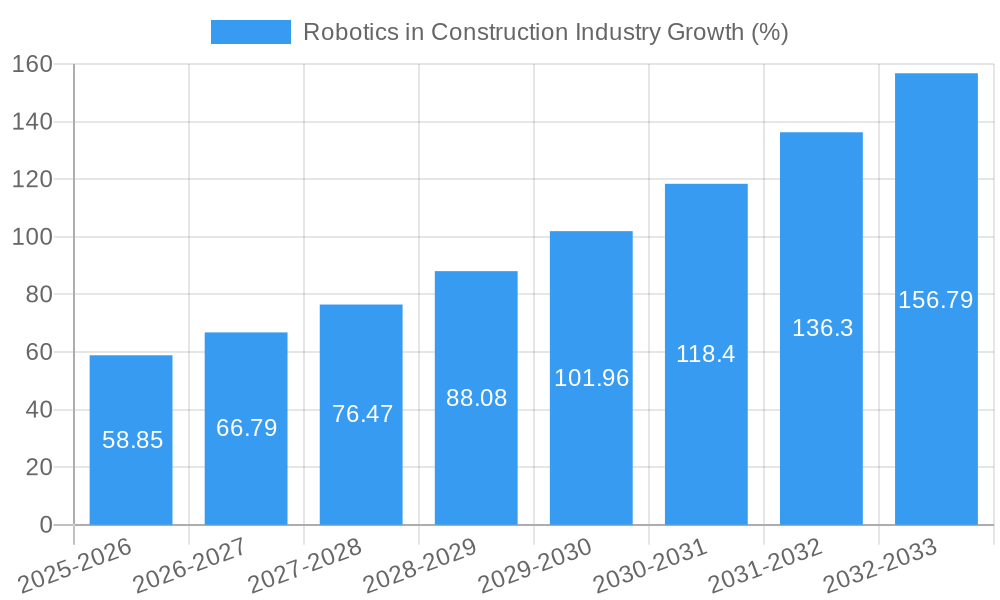
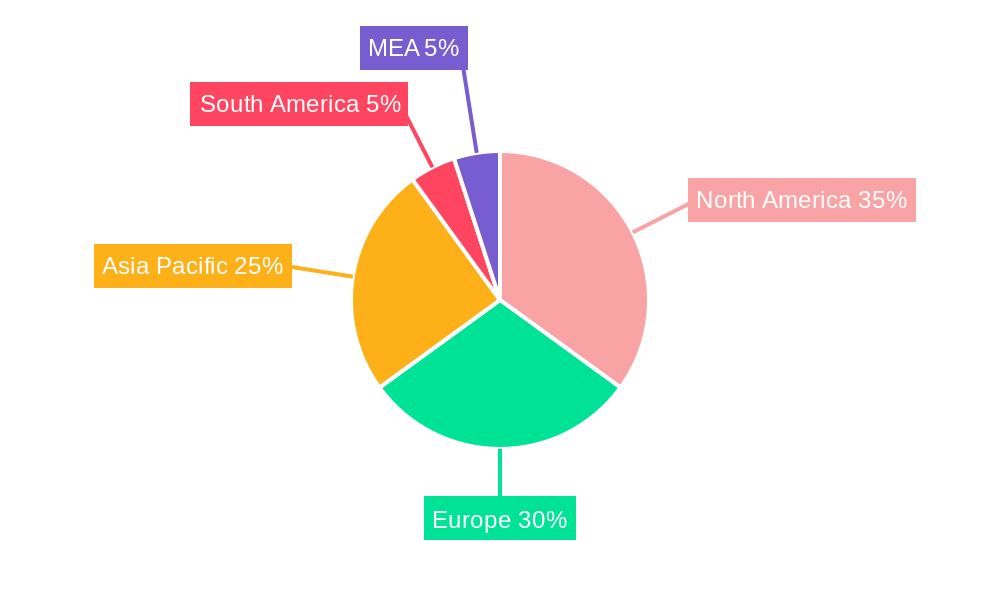
The global Robotics in Construction market is experiencing robust growth, projected to reach \$383.11 million in 2025 and exhibiting a Compound Annual Growth Rate (CAGR) of 15.50% from 2025 to 2033. This expansion is driven by several key factors. Firstly, the increasing need for enhanced efficiency and productivity within the construction sector is fueling demand for robotic solutions. Automation addresses labor shortages, improves safety standards by reducing human exposure to hazardous tasks (like demolition), and ultimately lowers project costs. Secondly, advancements in robotics technology, particularly in areas like AI-powered navigation and precise manipulation, are making robotic systems more versatile and applicable across a wider range of construction tasks. Thirdly, the growing adoption of Building Information Modeling (BIM) and digital twin technologies facilitates seamless integration of robots into existing workflows, enhancing their overall effectiveness. The market segments reveal strong growth potential across various types, including demolition robots, bricklaying robots, and emerging 3D printing technologies. Public infrastructure projects and commercial/residential building construction represent significant application areas. North America and Europe currently hold considerable market share, but the Asia-Pacific region is anticipated to witness significant growth fueled by rapid urbanization and infrastructure development in countries like China and India.
Competition in the Robotics in Construction market is intensifying, with key players like Dusty Robotics, Advanced Construction Robotics Inc., and COBOD International AS leading the innovation in specific niches. However, the market also faces challenges. High initial investment costs for robotic systems and a potential lack of skilled labor to operate and maintain them represent significant barriers to entry for smaller companies and some construction firms. Furthermore, regulatory hurdles and safety concerns surrounding the deployment of autonomous robots on construction sites need to be addressed to fully unlock the market's potential. Despite these restraints, the long-term outlook for the Robotics in Construction market remains highly positive, driven by continuous technological advancements and the persistent need for greater efficiency and safety in the construction industry. Future growth is expected to be fueled by ongoing research and development leading to more affordable, adaptable, and user-friendly robotic solutions.

Robotics in Construction Industry: A Comprehensive Market Report (2019-2033)
This detailed report provides a comprehensive analysis of the Robotics in Construction Industry market, projecting significant growth from $XX Million in 2025 to $XX Million by 2033, exhibiting a CAGR of XX%. The study period spans from 2019 to 2033, with 2025 serving as both the base and estimated year. This in-depth analysis covers market segmentation, key players, technological advancements, and future growth prospects, offering valuable insights for industry stakeholders.
Robotics in Construction Industry Market Concentration & Innovation
This section analyzes the competitive landscape, innovation drivers, and regulatory influences within the robotics construction market. The market is currently characterized by a moderately concentrated structure, with key players holding significant market share. However, the entry of new players and ongoing technological advancements are driving increased competition.
Market Share: The top five players, including Dusty Robotics, Advanced Construction Robotics Inc., and FBR Ltd., collectively hold an estimated XX% market share in 2025. This share is expected to slightly decrease by 2033 due to increased competition.
Innovation Drivers: The primary innovation drivers include advancements in AI, robotics, and automation technologies; increasing demand for improved construction efficiency and safety; and the rising cost of labor.
Regulatory Framework: Government regulations concerning safety standards and environmental impact play a crucial role. Variations in regulatory frameworks across different geographies influence market growth and adoption rates.
Product Substitutes: Traditional construction methods remain a significant substitute, although their cost and efficiency limitations are driving increased adoption of robotics.
End-User Trends: The construction industry’s increasing focus on sustainable practices, precision, and speed is fueling demand for robotic solutions.
M&A Activities: The past five years have witnessed several significant mergers and acquisitions, with deal values totaling approximately $XX Million. These activities reflect the growing strategic importance of robotics in construction. Examples include FBR Ltd.'s strategic agreement with M&G Investment Management, securing funding for expansion.
Robotics in Construction Industry Industry Trends & Insights
The global robotics in construction industry is experiencing rapid growth, driven by several key factors. Technological advancements are leading to more efficient, precise, and safer construction processes, while labor shortages and increasing construction costs are further incentivizing the adoption of robotics. The market is witnessing a shift towards automation in various construction stages, including demolition, bricklaying, 3D printing, and other specialized tasks. Consumer preferences are increasingly focused on faster project completion, higher quality, and reduced environmental impact. The competitive dynamics are characterized by both established players and emerging startups vying for market share, leading to continuous product innovation and service improvements. The market is expected to maintain a strong growth trajectory, with a projected CAGR of XX% from 2025-2033, indicating high market penetration of robotic solutions within the industry.
Dominant Markets & Segments in Robotics in Construction Industry
The North American market currently dominates the global robotics in construction industry, driven by robust infrastructure development, significant government funding for technological innovation, and a high concentration of major players.
By Type:
Bricklaying: This segment is experiencing rapid growth, led by companies like FBR Ltd. and its Hadrian X robot. Key drivers include increased demand for high-quality brickwork, labor shortages, and improved efficiency offered by robotic solutions.
Demolition: The demolition segment is experiencing steady growth due to the inherent risks associated with manual demolition and the need for improved safety and efficiency. BROKK AB and other companies are leading this segment.
3D Printing: This segment shows high growth potential due to its capacity to build complex structures rapidly and with minimal waste, aided by companies like Apis Cor and COBOD International AS.
By Application:
Commercial and Residential Buildings: This segment represents the largest application area, driven by the high volume of construction projects in this sector.
Public Infrastructure: This segment shows strong growth potential, fueled by government investments in infrastructure development projects.
Other Applications: This includes specialized applications such as inspection and maintenance, which are showing a steady rise.
Key Drivers (across segments):
- Favorable economic policies supporting infrastructure development.
- Government initiatives promoting technological advancements in construction.
- Increasing labor costs and skilled labor shortages.
Robotics in Construction Industry Product Developments
Recent product innovations focus on enhancing the capabilities of existing robotic systems. For instance, Advanced Construction Robotics Inc.'s IronBOT significantly improves rebar handling efficiency, complementing its TyBOT system for rebar tying. These advancements demonstrate a shift towards more sophisticated and integrated robotic solutions, improving productivity and worker safety. This is driving a significant increase in the market acceptance of robotics in construction applications.
Report Scope & Segmentation Analysis
This report analyzes the robotics in construction industry across various segments:
By Type: Demolition, Bricklaying, 3D Printing, and Other Types. Each segment shows unique growth projections based on technology advancements and market demand. The Bricklaying and 3D printing segments are expected to experience the highest growth rates.
By Application: Public Infrastructure, Commercial and Residential Buildings, and Other Applications. The Commercial and Residential Buildings segment is currently the largest, but Public Infrastructure shows significant growth potential. Competitive dynamics vary across segments, with some dominated by established players while others attract emerging startups.
Each segment's market size and growth projections are detailed within the full report.
Key Drivers of Robotics in Construction Industry Growth
Several factors are driving the growth of the robotics in construction industry:
Technological advancements: Innovations in AI, robotics, and automation are continuously improving the efficiency, precision, and safety of construction processes.
Economic factors: Rising labor costs and shortages are making robotic solutions more cost-effective. Government investments in infrastructure projects are also boosting demand.
Regulatory factors: Government regulations promoting safety and sustainability are encouraging the adoption of robotic solutions.
Challenges in the Robotics in Construction Industry Sector
Several challenges hinder the widespread adoption of robotics in construction:
High initial investment costs: The high purchase and maintenance costs of robotic systems can be a barrier for smaller construction firms.
Integration challenges: Integrating robotic systems into existing workflows can be complex and require specialized expertise.
Safety concerns: Ensuring the safe operation of robotic systems in dynamic construction environments requires robust safety protocols.
Emerging Opportunities in Robotics in Construction Industry
Emerging opportunities include:
Expansion into new markets: Developing countries with rapid infrastructure growth offer significant potential.
Development of new technologies: Advancements in AI, computer vision, and sensor technologies will lead to more capable robotic systems.
Focus on sustainability: Robotic solutions can contribute to more sustainable construction practices.
Leading Players in the Robotics in Construction Industry Market
- Dusty Robotics
- Advanced Construction Robotics Inc
- Apis Cor
- FBR Ltd
- Husqvarna AB
- Construction Robotics LLC
- BROKK AB (Lifco publ AB)
- Ekso Bionics
- COBOD International AS
Key Developments in Robotics in Construction Industry Industry
March 2023: FBR Ltd. announced a strategic agreement with M&G Investment Management, securing funding for three additional Hadrian X robots for deployment in the United States. This significantly expands FBR Ltd.'s market reach and capacity.
March 2023: Advanced Construction Robotics Inc. launched IronBOT, a rebar handling robot, which complements its existing TyBOT system and significantly enhances rebar placement efficiency. This strengthens ACR's position in the rebar automation market.
Strategic Outlook for Robotics in Construction Industry Market
The future of the robotics in construction industry is exceptionally promising. Continued technological advancements, coupled with increasing demand for efficiency and safety, will drive significant market growth. The focus on sustainability and the integration of AI and other advanced technologies will further enhance the capabilities of robotic systems. This creates substantial opportunities for both established players and new entrants to the market, leading to sustained expansion in the coming years.
Robotics in Construction Industry Segmentation
-
1. Type
- 1.1. Demolition
- 1.2. Bricklaying
- 1.3. 3D Printing
- 1.4. Other Types
-
2. Application
- 2.1. Public Infrastructure
- 2.2. Commercial and Residential Buildings
- 2.3. Other Applications
Robotics in Construction Industry Segmentation By Geography
- 1. North America
- 2. Europe
- 3. Asia Pacific
- 4. Rest of the World
Robotics in Construction Industry REPORT HIGHLIGHTS
| Aspects | Details |
|---|---|
| Study Period | 2019-2033 |
| Base Year | 2024 |
| Estimated Year | 2025 |
| Forecast Period | 2025-2033 |
| Historical Period | 2019-2024 |
| Growth Rate | CAGR of 15.50% from 2019-2033 |
| Segmentation |
|
Table of Contents
- 1. Introduction
- 1.1. Research Scope
- 1.2. Market Segmentation
- 1.3. Research Methodology
- 1.4. Definitions and Assumptions
- 2. Executive Summary
- 2.1. Introduction
- 3. Market Dynamics
- 3.1. Introduction
- 3.2. Market Drivers
- 3.2.1. Rapid Urbanization; Stringent Government Regulations for Worker's Safety
- 3.3. Market Restrains
- 3.3.1. High Equipment and Setup Costs
- 3.4. Market Trends
- 3.4.1. Commercial and Residential Buildings to be the Largest Application for Construction Robots
- 4. Market Factor Analysis
- 4.1. Porters Five Forces
- 4.2. Supply/Value Chain
- 4.3. PESTEL analysis
- 4.4. Market Entropy
- 4.5. Patent/Trademark Analysis
- 5. Global Robotics in Construction Industry Analysis, Insights and Forecast, 2019-2031
- 5.1. Market Analysis, Insights and Forecast - by Type
- 5.1.1. Demolition
- 5.1.2. Bricklaying
- 5.1.3. 3D Printing
- 5.1.4. Other Types
- 5.2. Market Analysis, Insights and Forecast - by Application
- 5.2.1. Public Infrastructure
- 5.2.2. Commercial and Residential Buildings
- 5.2.3. Other Applications
- 5.3. Market Analysis, Insights and Forecast - by Region
- 5.3.1. North America
- 5.3.2. Europe
- 5.3.3. Asia Pacific
- 5.3.4. Rest of the World
- 5.1. Market Analysis, Insights and Forecast - by Type
- 6. North America Robotics in Construction Industry Analysis, Insights and Forecast, 2019-2031
- 6.1. Market Analysis, Insights and Forecast - by Type
- 6.1.1. Demolition
- 6.1.2. Bricklaying
- 6.1.3. 3D Printing
- 6.1.4. Other Types
- 6.2. Market Analysis, Insights and Forecast - by Application
- 6.2.1. Public Infrastructure
- 6.2.2. Commercial and Residential Buildings
- 6.2.3. Other Applications
- 6.1. Market Analysis, Insights and Forecast - by Type
- 7. Europe Robotics in Construction Industry Analysis, Insights and Forecast, 2019-2031
- 7.1. Market Analysis, Insights and Forecast - by Type
- 7.1.1. Demolition
- 7.1.2. Bricklaying
- 7.1.3. 3D Printing
- 7.1.4. Other Types
- 7.2. Market Analysis, Insights and Forecast - by Application
- 7.2.1. Public Infrastructure
- 7.2.2. Commercial and Residential Buildings
- 7.2.3. Other Applications
- 7.1. Market Analysis, Insights and Forecast - by Type
- 8. Asia Pacific Robotics in Construction Industry Analysis, Insights and Forecast, 2019-2031
- 8.1. Market Analysis, Insights and Forecast - by Type
- 8.1.1. Demolition
- 8.1.2. Bricklaying
- 8.1.3. 3D Printing
- 8.1.4. Other Types
- 8.2. Market Analysis, Insights and Forecast - by Application
- 8.2.1. Public Infrastructure
- 8.2.2. Commercial and Residential Buildings
- 8.2.3. Other Applications
- 8.1. Market Analysis, Insights and Forecast - by Type
- 9. Rest of the World Robotics in Construction Industry Analysis, Insights and Forecast, 2019-2031
- 9.1. Market Analysis, Insights and Forecast - by Type
- 9.1.1. Demolition
- 9.1.2. Bricklaying
- 9.1.3. 3D Printing
- 9.1.4. Other Types
- 9.2. Market Analysis, Insights and Forecast - by Application
- 9.2.1. Public Infrastructure
- 9.2.2. Commercial and Residential Buildings
- 9.2.3. Other Applications
- 9.1. Market Analysis, Insights and Forecast - by Type
- 10. North America Robotics in Construction Industry Analysis, Insights and Forecast, 2019-2031
- 10.1. Market Analysis, Insights and Forecast - By Country/Sub-region
- 10.1.1 United States
- 10.1.2 Canada
- 10.1.3 Mexico
- 11. Europe Robotics in Construction Industry Analysis, Insights and Forecast, 2019-2031
- 11.1. Market Analysis, Insights and Forecast - By Country/Sub-region
- 11.1.1 Germany
- 11.1.2 United Kingdom
- 11.1.3 France
- 11.1.4 Spain
- 11.1.5 Italy
- 11.1.6 Spain
- 11.1.7 Belgium
- 11.1.8 Netherland
- 11.1.9 Nordics
- 11.1.10 Rest of Europe
- 12. Asia Pacific Robotics in Construction Industry Analysis, Insights and Forecast, 2019-2031
- 12.1. Market Analysis, Insights and Forecast - By Country/Sub-region
- 12.1.1 China
- 12.1.2 Japan
- 12.1.3 India
- 12.1.4 South Korea
- 12.1.5 Southeast Asia
- 12.1.6 Australia
- 12.1.7 Indonesia
- 12.1.8 Phillipes
- 12.1.9 Singapore
- 12.1.10 Thailandc
- 12.1.11 Rest of Asia Pacific
- 13. South America Robotics in Construction Industry Analysis, Insights and Forecast, 2019-2031
- 13.1. Market Analysis, Insights and Forecast - By Country/Sub-region
- 13.1.1 Brazil
- 13.1.2 Argentina
- 13.1.3 Peru
- 13.1.4 Chile
- 13.1.5 Colombia
- 13.1.6 Ecuador
- 13.1.7 Venezuela
- 13.1.8 Rest of South America
- 14. North America Robotics in Construction Industry Analysis, Insights and Forecast, 2019-2031
- 14.1. Market Analysis, Insights and Forecast - By Country/Sub-region
- 14.1.1 United States
- 14.1.2 Canada
- 14.1.3 Mexico
- 15. MEA Robotics in Construction Industry Analysis, Insights and Forecast, 2019-2031
- 15.1. Market Analysis, Insights and Forecast - By Country/Sub-region
- 15.1.1 United Arab Emirates
- 15.1.2 Saudi Arabia
- 15.1.3 South Africa
- 15.1.4 Rest of Middle East and Africa
- 16. Competitive Analysis
- 16.1. Global Market Share Analysis 2024
- 16.2. Company Profiles
- 16.2.1 Dusty Robotics
- 16.2.1.1. Overview
- 16.2.1.2. Products
- 16.2.1.3. SWOT Analysis
- 16.2.1.4. Recent Developments
- 16.2.1.5. Financials (Based on Availability)
- 16.2.2 Advanced Construction Robotics Inc
- 16.2.2.1. Overview
- 16.2.2.2. Products
- 16.2.2.3. SWOT Analysis
- 16.2.2.4. Recent Developments
- 16.2.2.5. Financials (Based on Availability)
- 16.2.3 Apis Cor
- 16.2.3.1. Overview
- 16.2.3.2. Products
- 16.2.3.3. SWOT Analysis
- 16.2.3.4. Recent Developments
- 16.2.3.5. Financials (Based on Availability)
- 16.2.4 FBR Ltd
- 16.2.4.1. Overview
- 16.2.4.2. Products
- 16.2.4.3. SWOT Analysis
- 16.2.4.4. Recent Developments
- 16.2.4.5. Financials (Based on Availability)
- 16.2.5 Husqvarna AB
- 16.2.5.1. Overview
- 16.2.5.2. Products
- 16.2.5.3. SWOT Analysis
- 16.2.5.4. Recent Developments
- 16.2.5.5. Financials (Based on Availability)
- 16.2.6 Construction Robotics LLC
- 16.2.6.1. Overview
- 16.2.6.2. Products
- 16.2.6.3. SWOT Analysis
- 16.2.6.4. Recent Developments
- 16.2.6.5. Financials (Based on Availability)
- 16.2.7 BROKK AB (Lifco publ AB)
- 16.2.7.1. Overview
- 16.2.7.2. Products
- 16.2.7.3. SWOT Analysis
- 16.2.7.4. Recent Developments
- 16.2.7.5. Financials (Based on Availability)
- 16.2.8 Ekso Bionics
- 16.2.8.1. Overview
- 16.2.8.2. Products
- 16.2.8.3. SWOT Analysis
- 16.2.8.4. Recent Developments
- 16.2.8.5. Financials (Based on Availability)
- 16.2.9 COBOD International AS
- 16.2.9.1. Overview
- 16.2.9.2. Products
- 16.2.9.3. SWOT Analysis
- 16.2.9.4. Recent Developments
- 16.2.9.5. Financials (Based on Availability)
- 16.2.1 Dusty Robotics
List of Figures
- Figure 1: Global Robotics in Construction Industry Revenue Breakdown (Million, %) by Region 2024 & 2032
- Figure 2: Global Robotics in Construction Industry Volume Breakdown (cubic meters, %) by Region 2024 & 2032
- Figure 3: North America Robotics in Construction Industry Revenue (Million), by Country 2024 & 2032
- Figure 4: North America Robotics in Construction Industry Volume (cubic meters), by Country 2024 & 2032
- Figure 5: North America Robotics in Construction Industry Revenue Share (%), by Country 2024 & 2032
- Figure 6: North America Robotics in Construction Industry Volume Share (%), by Country 2024 & 2032
- Figure 7: Europe Robotics in Construction Industry Revenue (Million), by Country 2024 & 2032
- Figure 8: Europe Robotics in Construction Industry Volume (cubic meters), by Country 2024 & 2032
- Figure 9: Europe Robotics in Construction Industry Revenue Share (%), by Country 2024 & 2032
- Figure 10: Europe Robotics in Construction Industry Volume Share (%), by Country 2024 & 2032
- Figure 11: Asia Pacific Robotics in Construction Industry Revenue (Million), by Country 2024 & 2032
- Figure 12: Asia Pacific Robotics in Construction Industry Volume (cubic meters), by Country 2024 & 2032
- Figure 13: Asia Pacific Robotics in Construction Industry Revenue Share (%), by Country 2024 & 2032
- Figure 14: Asia Pacific Robotics in Construction Industry Volume Share (%), by Country 2024 & 2032
- Figure 15: South America Robotics in Construction Industry Revenue (Million), by Country 2024 & 2032
- Figure 16: South America Robotics in Construction Industry Volume (cubic meters), by Country 2024 & 2032
- Figure 17: South America Robotics in Construction Industry Revenue Share (%), by Country 2024 & 2032
- Figure 18: South America Robotics in Construction Industry Volume Share (%), by Country 2024 & 2032
- Figure 19: North America Robotics in Construction Industry Revenue (Million), by Country 2024 & 2032
- Figure 20: North America Robotics in Construction Industry Volume (cubic meters), by Country 2024 & 2032
- Figure 21: North America Robotics in Construction Industry Revenue Share (%), by Country 2024 & 2032
- Figure 22: North America Robotics in Construction Industry Volume Share (%), by Country 2024 & 2032
- Figure 23: MEA Robotics in Construction Industry Revenue (Million), by Country 2024 & 2032
- Figure 24: MEA Robotics in Construction Industry Volume (cubic meters), by Country 2024 & 2032
- Figure 25: MEA Robotics in Construction Industry Revenue Share (%), by Country 2024 & 2032
- Figure 26: MEA Robotics in Construction Industry Volume Share (%), by Country 2024 & 2032
- Figure 27: North America Robotics in Construction Industry Revenue (Million), by Type 2024 & 2032
- Figure 28: North America Robotics in Construction Industry Volume (cubic meters), by Type 2024 & 2032
- Figure 29: North America Robotics in Construction Industry Revenue Share (%), by Type 2024 & 2032
- Figure 30: North America Robotics in Construction Industry Volume Share (%), by Type 2024 & 2032
- Figure 31: North America Robotics in Construction Industry Revenue (Million), by Application 2024 & 2032
- Figure 32: North America Robotics in Construction Industry Volume (cubic meters), by Application 2024 & 2032
- Figure 33: North America Robotics in Construction Industry Revenue Share (%), by Application 2024 & 2032
- Figure 34: North America Robotics in Construction Industry Volume Share (%), by Application 2024 & 2032
- Figure 35: North America Robotics in Construction Industry Revenue (Million), by Country 2024 & 2032
- Figure 36: North America Robotics in Construction Industry Volume (cubic meters), by Country 2024 & 2032
- Figure 37: North America Robotics in Construction Industry Revenue Share (%), by Country 2024 & 2032
- Figure 38: North America Robotics in Construction Industry Volume Share (%), by Country 2024 & 2032
- Figure 39: Europe Robotics in Construction Industry Revenue (Million), by Type 2024 & 2032
- Figure 40: Europe Robotics in Construction Industry Volume (cubic meters), by Type 2024 & 2032
- Figure 41: Europe Robotics in Construction Industry Revenue Share (%), by Type 2024 & 2032
- Figure 42: Europe Robotics in Construction Industry Volume Share (%), by Type 2024 & 2032
- Figure 43: Europe Robotics in Construction Industry Revenue (Million), by Application 2024 & 2032
- Figure 44: Europe Robotics in Construction Industry Volume (cubic meters), by Application 2024 & 2032
- Figure 45: Europe Robotics in Construction Industry Revenue Share (%), by Application 2024 & 2032
- Figure 46: Europe Robotics in Construction Industry Volume Share (%), by Application 2024 & 2032
- Figure 47: Europe Robotics in Construction Industry Revenue (Million), by Country 2024 & 2032
- Figure 48: Europe Robotics in Construction Industry Volume (cubic meters), by Country 2024 & 2032
- Figure 49: Europe Robotics in Construction Industry Revenue Share (%), by Country 2024 & 2032
- Figure 50: Europe Robotics in Construction Industry Volume Share (%), by Country 2024 & 2032
- Figure 51: Asia Pacific Robotics in Construction Industry Revenue (Million), by Type 2024 & 2032
- Figure 52: Asia Pacific Robotics in Construction Industry Volume (cubic meters), by Type 2024 & 2032
- Figure 53: Asia Pacific Robotics in Construction Industry Revenue Share (%), by Type 2024 & 2032
- Figure 54: Asia Pacific Robotics in Construction Industry Volume Share (%), by Type 2024 & 2032
- Figure 55: Asia Pacific Robotics in Construction Industry Revenue (Million), by Application 2024 & 2032
- Figure 56: Asia Pacific Robotics in Construction Industry Volume (cubic meters), by Application 2024 & 2032
- Figure 57: Asia Pacific Robotics in Construction Industry Revenue Share (%), by Application 2024 & 2032
- Figure 58: Asia Pacific Robotics in Construction Industry Volume Share (%), by Application 2024 & 2032
- Figure 59: Asia Pacific Robotics in Construction Industry Revenue (Million), by Country 2024 & 2032
- Figure 60: Asia Pacific Robotics in Construction Industry Volume (cubic meters), by Country 2024 & 2032
- Figure 61: Asia Pacific Robotics in Construction Industry Revenue Share (%), by Country 2024 & 2032
- Figure 62: Asia Pacific Robotics in Construction Industry Volume Share (%), by Country 2024 & 2032
- Figure 63: Rest of the World Robotics in Construction Industry Revenue (Million), by Type 2024 & 2032
- Figure 64: Rest of the World Robotics in Construction Industry Volume (cubic meters), by Type 2024 & 2032
- Figure 65: Rest of the World Robotics in Construction Industry Revenue Share (%), by Type 2024 & 2032
- Figure 66: Rest of the World Robotics in Construction Industry Volume Share (%), by Type 2024 & 2032
- Figure 67: Rest of the World Robotics in Construction Industry Revenue (Million), by Application 2024 & 2032
- Figure 68: Rest of the World Robotics in Construction Industry Volume (cubic meters), by Application 2024 & 2032
- Figure 69: Rest of the World Robotics in Construction Industry Revenue Share (%), by Application 2024 & 2032
- Figure 70: Rest of the World Robotics in Construction Industry Volume Share (%), by Application 2024 & 2032
- Figure 71: Rest of the World Robotics in Construction Industry Revenue (Million), by Country 2024 & 2032
- Figure 72: Rest of the World Robotics in Construction Industry Volume (cubic meters), by Country 2024 & 2032
- Figure 73: Rest of the World Robotics in Construction Industry Revenue Share (%), by Country 2024 & 2032
- Figure 74: Rest of the World Robotics in Construction Industry Volume Share (%), by Country 2024 & 2032
List of Tables
- Table 1: Global Robotics in Construction Industry Revenue Million Forecast, by Region 2019 & 2032
- Table 2: Global Robotics in Construction Industry Volume cubic meters Forecast, by Region 2019 & 2032
- Table 3: Global Robotics in Construction Industry Revenue Million Forecast, by Type 2019 & 2032
- Table 4: Global Robotics in Construction Industry Volume cubic meters Forecast, by Type 2019 & 2032
- Table 5: Global Robotics in Construction Industry Revenue Million Forecast, by Application 2019 & 2032
- Table 6: Global Robotics in Construction Industry Volume cubic meters Forecast, by Application 2019 & 2032
- Table 7: Global Robotics in Construction Industry Revenue Million Forecast, by Region 2019 & 2032
- Table 8: Global Robotics in Construction Industry Volume cubic meters Forecast, by Region 2019 & 2032
- Table 9: Global Robotics in Construction Industry Revenue Million Forecast, by Country 2019 & 2032
- Table 10: Global Robotics in Construction Industry Volume cubic meters Forecast, by Country 2019 & 2032
- Table 11: United States Robotics in Construction Industry Revenue (Million) Forecast, by Application 2019 & 2032
- Table 12: United States Robotics in Construction Industry Volume (cubic meters) Forecast, by Application 2019 & 2032
- Table 13: Canada Robotics in Construction Industry Revenue (Million) Forecast, by Application 2019 & 2032
- Table 14: Canada Robotics in Construction Industry Volume (cubic meters) Forecast, by Application 2019 & 2032
- Table 15: Mexico Robotics in Construction Industry Revenue (Million) Forecast, by Application 2019 & 2032
- Table 16: Mexico Robotics in Construction Industry Volume (cubic meters) Forecast, by Application 2019 & 2032
- Table 17: Global Robotics in Construction Industry Revenue Million Forecast, by Country 2019 & 2032
- Table 18: Global Robotics in Construction Industry Volume cubic meters Forecast, by Country 2019 & 2032
- Table 19: Germany Robotics in Construction Industry Revenue (Million) Forecast, by Application 2019 & 2032
- Table 20: Germany Robotics in Construction Industry Volume (cubic meters) Forecast, by Application 2019 & 2032
- Table 21: United Kingdom Robotics in Construction Industry Revenue (Million) Forecast, by Application 2019 & 2032
- Table 22: United Kingdom Robotics in Construction Industry Volume (cubic meters) Forecast, by Application 2019 & 2032
- Table 23: France Robotics in Construction Industry Revenue (Million) Forecast, by Application 2019 & 2032
- Table 24: France Robotics in Construction Industry Volume (cubic meters) Forecast, by Application 2019 & 2032
- Table 25: Spain Robotics in Construction Industry Revenue (Million) Forecast, by Application 2019 & 2032
- Table 26: Spain Robotics in Construction Industry Volume (cubic meters) Forecast, by Application 2019 & 2032
- Table 27: Italy Robotics in Construction Industry Revenue (Million) Forecast, by Application 2019 & 2032
- Table 28: Italy Robotics in Construction Industry Volume (cubic meters) Forecast, by Application 2019 & 2032
- Table 29: Spain Robotics in Construction Industry Revenue (Million) Forecast, by Application 2019 & 2032
- Table 30: Spain Robotics in Construction Industry Volume (cubic meters) Forecast, by Application 2019 & 2032
- Table 31: Belgium Robotics in Construction Industry Revenue (Million) Forecast, by Application 2019 & 2032
- Table 32: Belgium Robotics in Construction Industry Volume (cubic meters) Forecast, by Application 2019 & 2032
- Table 33: Netherland Robotics in Construction Industry Revenue (Million) Forecast, by Application 2019 & 2032
- Table 34: Netherland Robotics in Construction Industry Volume (cubic meters) Forecast, by Application 2019 & 2032
- Table 35: Nordics Robotics in Construction Industry Revenue (Million) Forecast, by Application 2019 & 2032
- Table 36: Nordics Robotics in Construction Industry Volume (cubic meters) Forecast, by Application 2019 & 2032
- Table 37: Rest of Europe Robotics in Construction Industry Revenue (Million) Forecast, by Application 2019 & 2032
- Table 38: Rest of Europe Robotics in Construction Industry Volume (cubic meters) Forecast, by Application 2019 & 2032
- Table 39: Global Robotics in Construction Industry Revenue Million Forecast, by Country 2019 & 2032
- Table 40: Global Robotics in Construction Industry Volume cubic meters Forecast, by Country 2019 & 2032
- Table 41: China Robotics in Construction Industry Revenue (Million) Forecast, by Application 2019 & 2032
- Table 42: China Robotics in Construction Industry Volume (cubic meters) Forecast, by Application 2019 & 2032
- Table 43: Japan Robotics in Construction Industry Revenue (Million) Forecast, by Application 2019 & 2032
- Table 44: Japan Robotics in Construction Industry Volume (cubic meters) Forecast, by Application 2019 & 2032
- Table 45: India Robotics in Construction Industry Revenue (Million) Forecast, by Application 2019 & 2032
- Table 46: India Robotics in Construction Industry Volume (cubic meters) Forecast, by Application 2019 & 2032
- Table 47: South Korea Robotics in Construction Industry Revenue (Million) Forecast, by Application 2019 & 2032
- Table 48: South Korea Robotics in Construction Industry Volume (cubic meters) Forecast, by Application 2019 & 2032
- Table 49: Southeast Asia Robotics in Construction Industry Revenue (Million) Forecast, by Application 2019 & 2032
- Table 50: Southeast Asia Robotics in Construction Industry Volume (cubic meters) Forecast, by Application 2019 & 2032
- Table 51: Australia Robotics in Construction Industry Revenue (Million) Forecast, by Application 2019 & 2032
- Table 52: Australia Robotics in Construction Industry Volume (cubic meters) Forecast, by Application 2019 & 2032
- Table 53: Indonesia Robotics in Construction Industry Revenue (Million) Forecast, by Application 2019 & 2032
- Table 54: Indonesia Robotics in Construction Industry Volume (cubic meters) Forecast, by Application 2019 & 2032
- Table 55: Phillipes Robotics in Construction Industry Revenue (Million) Forecast, by Application 2019 & 2032
- Table 56: Phillipes Robotics in Construction Industry Volume (cubic meters) Forecast, by Application 2019 & 2032
- Table 57: Singapore Robotics in Construction Industry Revenue (Million) Forecast, by Application 2019 & 2032
- Table 58: Singapore Robotics in Construction Industry Volume (cubic meters) Forecast, by Application 2019 & 2032
- Table 59: Thailandc Robotics in Construction Industry Revenue (Million) Forecast, by Application 2019 & 2032
- Table 60: Thailandc Robotics in Construction Industry Volume (cubic meters) Forecast, by Application 2019 & 2032
- Table 61: Rest of Asia Pacific Robotics in Construction Industry Revenue (Million) Forecast, by Application 2019 & 2032
- Table 62: Rest of Asia Pacific Robotics in Construction Industry Volume (cubic meters) Forecast, by Application 2019 & 2032
- Table 63: Global Robotics in Construction Industry Revenue Million Forecast, by Country 2019 & 2032
- Table 64: Global Robotics in Construction Industry Volume cubic meters Forecast, by Country 2019 & 2032
- Table 65: Brazil Robotics in Construction Industry Revenue (Million) Forecast, by Application 2019 & 2032
- Table 66: Brazil Robotics in Construction Industry Volume (cubic meters) Forecast, by Application 2019 & 2032
- Table 67: Argentina Robotics in Construction Industry Revenue (Million) Forecast, by Application 2019 & 2032
- Table 68: Argentina Robotics in Construction Industry Volume (cubic meters) Forecast, by Application 2019 & 2032
- Table 69: Peru Robotics in Construction Industry Revenue (Million) Forecast, by Application 2019 & 2032
- Table 70: Peru Robotics in Construction Industry Volume (cubic meters) Forecast, by Application 2019 & 2032
- Table 71: Chile Robotics in Construction Industry Revenue (Million) Forecast, by Application 2019 & 2032
- Table 72: Chile Robotics in Construction Industry Volume (cubic meters) Forecast, by Application 2019 & 2032
- Table 73: Colombia Robotics in Construction Industry Revenue (Million) Forecast, by Application 2019 & 2032
- Table 74: Colombia Robotics in Construction Industry Volume (cubic meters) Forecast, by Application 2019 & 2032
- Table 75: Ecuador Robotics in Construction Industry Revenue (Million) Forecast, by Application 2019 & 2032
- Table 76: Ecuador Robotics in Construction Industry Volume (cubic meters) Forecast, by Application 2019 & 2032
- Table 77: Venezuela Robotics in Construction Industry Revenue (Million) Forecast, by Application 2019 & 2032
- Table 78: Venezuela Robotics in Construction Industry Volume (cubic meters) Forecast, by Application 2019 & 2032
- Table 79: Rest of South America Robotics in Construction Industry Revenue (Million) Forecast, by Application 2019 & 2032
- Table 80: Rest of South America Robotics in Construction Industry Volume (cubic meters) Forecast, by Application 2019 & 2032
- Table 81: Global Robotics in Construction Industry Revenue Million Forecast, by Country 2019 & 2032
- Table 82: Global Robotics in Construction Industry Volume cubic meters Forecast, by Country 2019 & 2032
- Table 83: United States Robotics in Construction Industry Revenue (Million) Forecast, by Application 2019 & 2032
- Table 84: United States Robotics in Construction Industry Volume (cubic meters) Forecast, by Application 2019 & 2032
- Table 85: Canada Robotics in Construction Industry Revenue (Million) Forecast, by Application 2019 & 2032
- Table 86: Canada Robotics in Construction Industry Volume (cubic meters) Forecast, by Application 2019 & 2032
- Table 87: Mexico Robotics in Construction Industry Revenue (Million) Forecast, by Application 2019 & 2032
- Table 88: Mexico Robotics in Construction Industry Volume (cubic meters) Forecast, by Application 2019 & 2032
- Table 89: Global Robotics in Construction Industry Revenue Million Forecast, by Country 2019 & 2032
- Table 90: Global Robotics in Construction Industry Volume cubic meters Forecast, by Country 2019 & 2032
- Table 91: United Arab Emirates Robotics in Construction Industry Revenue (Million) Forecast, by Application 2019 & 2032
- Table 92: United Arab Emirates Robotics in Construction Industry Volume (cubic meters) Forecast, by Application 2019 & 2032
- Table 93: Saudi Arabia Robotics in Construction Industry Revenue (Million) Forecast, by Application 2019 & 2032
- Table 94: Saudi Arabia Robotics in Construction Industry Volume (cubic meters) Forecast, by Application 2019 & 2032
- Table 95: South Africa Robotics in Construction Industry Revenue (Million) Forecast, by Application 2019 & 2032
- Table 96: South Africa Robotics in Construction Industry Volume (cubic meters) Forecast, by Application 2019 & 2032
- Table 97: Rest of Middle East and Africa Robotics in Construction Industry Revenue (Million) Forecast, by Application 2019 & 2032
- Table 98: Rest of Middle East and Africa Robotics in Construction Industry Volume (cubic meters) Forecast, by Application 2019 & 2032
- Table 99: Global Robotics in Construction Industry Revenue Million Forecast, by Type 2019 & 2032
- Table 100: Global Robotics in Construction Industry Volume cubic meters Forecast, by Type 2019 & 2032
- Table 101: Global Robotics in Construction Industry Revenue Million Forecast, by Application 2019 & 2032
- Table 102: Global Robotics in Construction Industry Volume cubic meters Forecast, by Application 2019 & 2032
- Table 103: Global Robotics in Construction Industry Revenue Million Forecast, by Country 2019 & 2032
- Table 104: Global Robotics in Construction Industry Volume cubic meters Forecast, by Country 2019 & 2032
- Table 105: Global Robotics in Construction Industry Revenue Million Forecast, by Type 2019 & 2032
- Table 106: Global Robotics in Construction Industry Volume cubic meters Forecast, by Type 2019 & 2032
- Table 107: Global Robotics in Construction Industry Revenue Million Forecast, by Application 2019 & 2032
- Table 108: Global Robotics in Construction Industry Volume cubic meters Forecast, by Application 2019 & 2032
- Table 109: Global Robotics in Construction Industry Revenue Million Forecast, by Country 2019 & 2032
- Table 110: Global Robotics in Construction Industry Volume cubic meters Forecast, by Country 2019 & 2032
- Table 111: Global Robotics in Construction Industry Revenue Million Forecast, by Type 2019 & 2032
- Table 112: Global Robotics in Construction Industry Volume cubic meters Forecast, by Type 2019 & 2032
- Table 113: Global Robotics in Construction Industry Revenue Million Forecast, by Application 2019 & 2032
- Table 114: Global Robotics in Construction Industry Volume cubic meters Forecast, by Application 2019 & 2032
- Table 115: Global Robotics in Construction Industry Revenue Million Forecast, by Country 2019 & 2032
- Table 116: Global Robotics in Construction Industry Volume cubic meters Forecast, by Country 2019 & 2032
- Table 117: Global Robotics in Construction Industry Revenue Million Forecast, by Type 2019 & 2032
- Table 118: Global Robotics in Construction Industry Volume cubic meters Forecast, by Type 2019 & 2032
- Table 119: Global Robotics in Construction Industry Revenue Million Forecast, by Application 2019 & 2032
- Table 120: Global Robotics in Construction Industry Volume cubic meters Forecast, by Application 2019 & 2032
- Table 121: Global Robotics in Construction Industry Revenue Million Forecast, by Country 2019 & 2032
- Table 122: Global Robotics in Construction Industry Volume cubic meters Forecast, by Country 2019 & 2032
Frequently Asked Questions
1. What is the projected Compound Annual Growth Rate (CAGR) of the Robotics in Construction Industry?
The projected CAGR is approximately 15.50%.
2. Which companies are prominent players in the Robotics in Construction Industry?
Key companies in the market include Dusty Robotics, Advanced Construction Robotics Inc, Apis Cor, FBR Ltd, Husqvarna AB, Construction Robotics LLC, BROKK AB (Lifco publ AB), Ekso Bionics, COBOD International AS.
3. What are the main segments of the Robotics in Construction Industry?
The market segments include Type, Application.
4. Can you provide details about the market size?
The market size is estimated to be USD 383.11 Million as of 2022.
5. What are some drivers contributing to market growth?
Rapid Urbanization; Stringent Government Regulations for Worker's Safety.
6. What are the notable trends driving market growth?
Commercial and Residential Buildings to be the Largest Application for Construction Robots.
7. Are there any restraints impacting market growth?
High Equipment and Setup Costs.
8. Can you provide examples of recent developments in the market?
March 2023: FBR Ltd. announced a strategic agreement with M&G Investment Management, a UK-based shareholder, to fund the production and deployment of three additional next-generation Hadrian X robots for use in the United States. The three new Hadrian X robots are expected to be built on truck bases in the United States before deployment to provide 'Wall as a Service' bricklaying services through the Perth firm's FastbrickAmericas joint venture.
9. What pricing options are available for accessing the report?
Pricing options include single-user, multi-user, and enterprise licenses priced at USD 4750, USD 5250, and USD 8750 respectively.
10. Is the market size provided in terms of value or volume?
The market size is provided in terms of value, measured in Million and volume, measured in cubic meters.
11. Are there any specific market keywords associated with the report?
Yes, the market keyword associated with the report is "Robotics in Construction Industry," which aids in identifying and referencing the specific market segment covered.
12. How do I determine which pricing option suits my needs best?
The pricing options vary based on user requirements and access needs. Individual users may opt for single-user licenses, while businesses requiring broader access may choose multi-user or enterprise licenses for cost-effective access to the report.
13. Are there any additional resources or data provided in the Robotics in Construction Industry report?
While the report offers comprehensive insights, it's advisable to review the specific contents or supplementary materials provided to ascertain if additional resources or data are available.
14. How can I stay updated on further developments or reports in the Robotics in Construction Industry?
To stay informed about further developments, trends, and reports in the Robotics in Construction Industry, consider subscribing to industry newsletters, following relevant companies and organizations, or regularly checking reputable industry news sources and publications.
Methodology
Step 1 - Identification of Relevant Samples Size from Population Database


Step 2 - Approaches for Defining Global Market Size (Value, Volume* & Price*)

Note*: In applicable scenarios
Step 3 - Data Sources
Primary Research
- Web Analytics
- Survey Reports
- Research Institute
- Latest Research Reports
- Opinion Leaders
Secondary Research
- Annual Reports
- White Paper
- Latest Press Release
- Industry Association
- Paid Database
- Investor Presentations

Step 4 - Data Triangulation
Involves using different sources of information in order to increase the validity of a study
These sources are likely to be stakeholders in a program - participants, other researchers, program staff, other community members, and so on.
Then we put all data in single framework & apply various statistical tools to find out the dynamic on the market.
During the analysis stage, feedback from the stakeholder groups would be compared to determine areas of agreement as well as areas of divergence


