
Key Insights
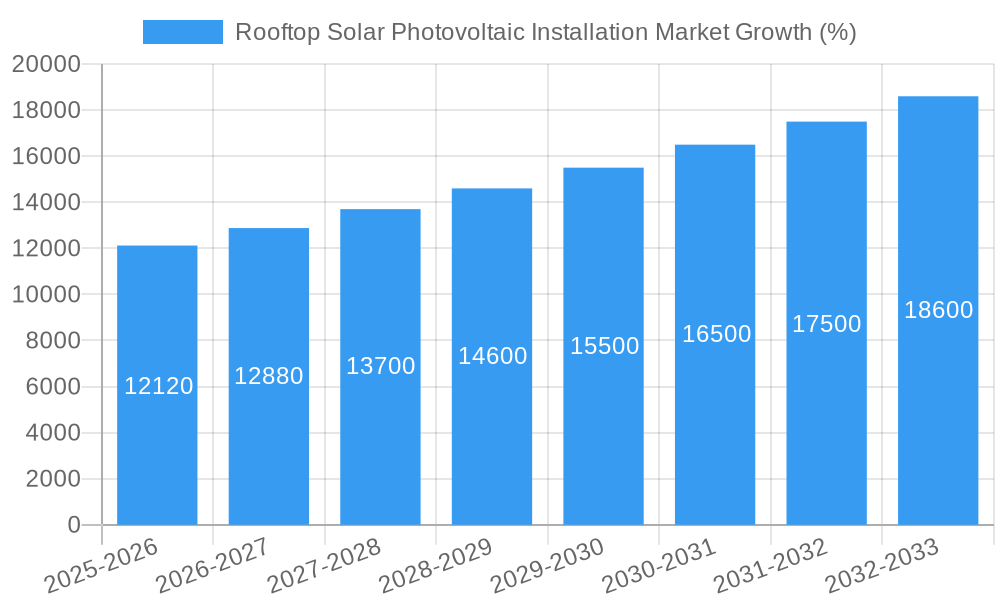
The global rooftop solar photovoltaic (PV) installation market is experiencing robust growth, driven by increasing concerns about climate change, rising energy costs, and supportive government policies promoting renewable energy adoption. The market's compound annual growth rate (CAGR) of 8.04% from 2019 to 2024 indicates a significant upward trajectory, projected to continue into the forecast period (2025-2033). Key drivers include decreasing PV system costs, technological advancements leading to improved efficiency and durability, and growing awareness among homeowners and businesses about the financial and environmental benefits of solar energy. The residential segment currently holds a substantial market share, fueled by individual incentives and decreasing installation costs making solar power accessible to a wider population. However, the commercial and industrial sectors are witnessing rapid growth, driven by large-scale installations and corporate sustainability initiatives. Geographic expansion is also a significant factor; North America, particularly the United States, remains a major market, but significant growth is anticipated in Asia-Pacific regions like China, India, and Japan, driven by government support and increasing energy demands. Competitive landscape analysis shows a mix of established players like Canadian Solar and newer entrants, indicating a dynamic and evolving market structure. While regulatory hurdles and intermittent energy supply remain restraints, the overall market outlook remains positive, with continued growth expected throughout the forecast period.
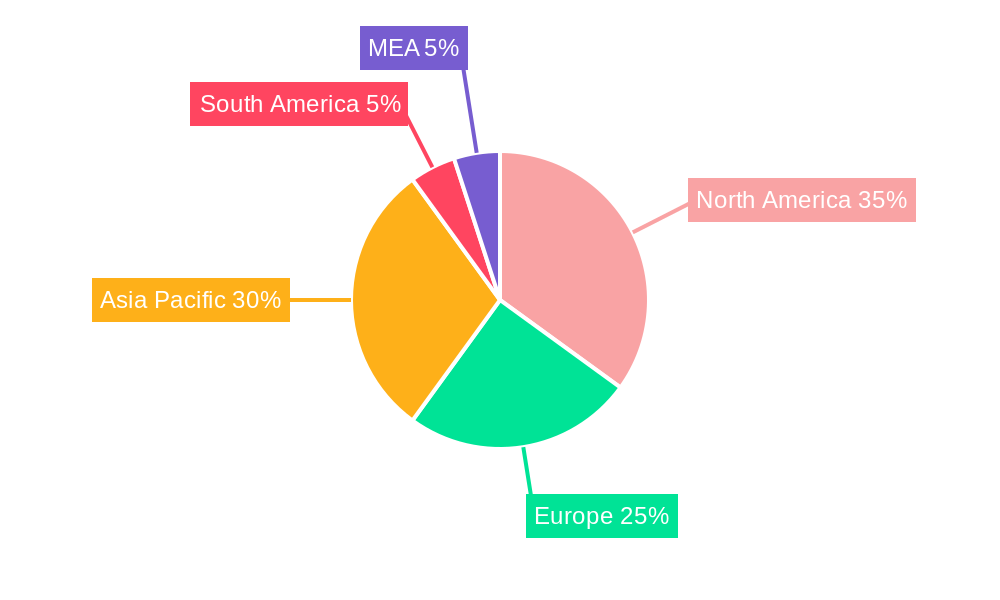
The market segmentation by location (residential, commercial, industrial) provides valuable insights into specific growth drivers and challenges within each sector. Residential installations benefit from individual incentives and decreasing costs, while commercial and industrial deployments are driven by corporate sustainability goals and potential cost savings. Regional variations reflect diverse regulatory landscapes, economic conditions, and consumer preferences. While North America currently holds a significant share, the Asia-Pacific region exhibits substantial growth potential due to its large population and expanding renewable energy initiatives. Market players are focusing on innovation, offering customized solutions, and exploring financing options to cater to diverse customer needs, further contributing to the market's overall expansion. Continued technological advancements, particularly in energy storage solutions, are expected to enhance the attractiveness and affordability of rooftop solar PV installations, ensuring sustained market growth in the coming years.
This comprehensive report provides an in-depth analysis of the Rooftop Solar Photovoltaic (PV) Installation Market from 2019 to 2033, offering invaluable insights for industry stakeholders, investors, and strategic decision-makers. The study covers market size, segmentation, competitive landscape, growth drivers, challenges, and emerging opportunities, providing a 360-degree view of this rapidly evolving sector. The base year for this report is 2025, with estimations for the same year and a forecast period spanning 2025-2033. The historical period analyzed is 2019-2024.
Rooftop Solar Photovoltaic Installation Market Concentration & Innovation
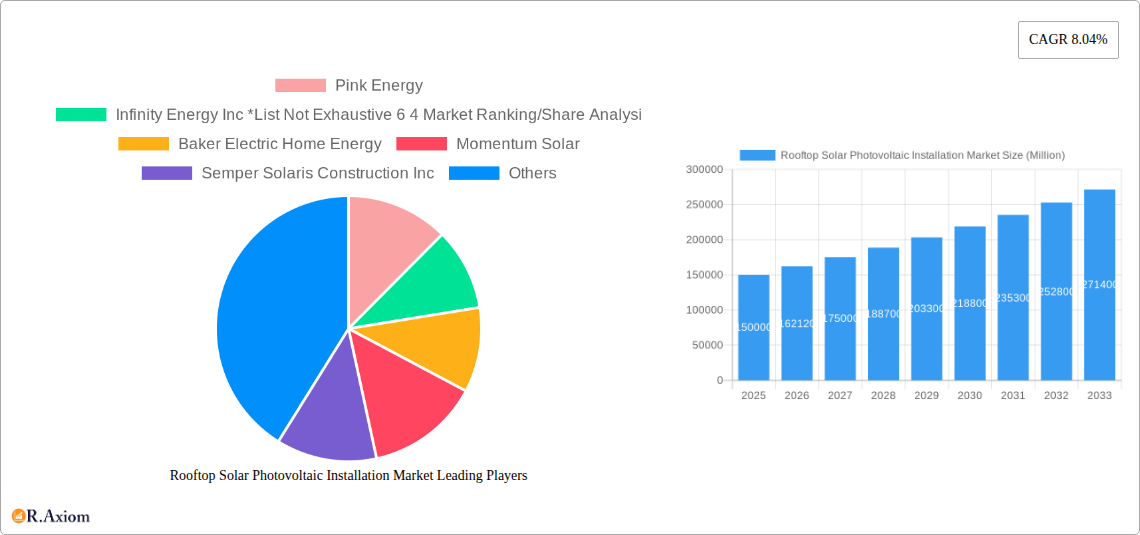
This section delves into the market's competitive dynamics, analyzing market concentration, innovation drivers, regulatory landscapes, product substitutes, end-user trends, and mergers and acquisitions (M&A) activities. The market is moderately concentrated, with a handful of major players holding significant market share. The top 6 companies—including Pink Energy, Infinity Energy Inc, Baker Electric Home Energy, Momentum Solar, Semper Solaris Construction Inc, and Canadian Solar Inc—account for approximately xx% of the total market in 2025. However, the market also includes numerous smaller, regional players, fostering competition. Innovation is driven by advancements in PV technology, including higher efficiency panels, improved energy storage solutions, and smart grid integration. Stringent environmental regulations and government incentives are further driving market growth. The M&A landscape is dynamic, with deal values exceeding $xx Million annually in recent years, reflecting consolidation and expansion strategies within the sector. Several factors influence market concentration, including:
- Market share distribution: The top 6 players hold xx% market share; smaller players constitute the remaining xx%.
- M&A activity: Consolidation is ongoing, with deals valued at over $xx Million annually.
- Technological innovation: Advancements in PV technology and energy storage create new competitive advantages.
- Regulatory frameworks: Government policies and incentives significantly influence market growth and player strategies.
Rooftop Solar Photovoltaic Installation Market Industry Trends & Insights
This section provides a detailed analysis of the market's growth trajectory, technological advancements, consumer preferences, and competitive dynamics. The global rooftop solar PV installation market is experiencing robust growth, with a Compound Annual Growth Rate (CAGR) of xx% projected from 2025 to 2033. This growth is fueled by several factors, including increasing energy prices, rising environmental concerns, supportive government policies, and declining solar PV system costs. Market penetration is steadily increasing, particularly in residential and commercial sectors. Technological disruptions are continuously reshaping the industry, with advancements such as improved energy storage, AI-powered monitoring systems, and higher efficiency solar panels improving system performance, reliability, and cost-effectiveness. Consumer preference is shifting towards aesthetically pleasing and efficient systems with integrated energy management features. Competitive dynamics are characterized by intense rivalry, with companies focusing on innovation, cost optimization, and customer service to gain market share. By 2033, market penetration is expected to reach xx%, driven by:
- Technological advancements: Higher efficiency panels, improved energy storage solutions, and smart grid integration.
- Government policies: Subsidies, tax credits, and renewable energy mandates accelerate market adoption.
- Consumer awareness: Growing concerns about climate change and environmental sustainability drive demand.
- Economic factors: Fluctuating energy prices make solar increasingly cost-competitive.
Dominant Markets & Segments in Rooftop Solar Photovoltaic Installation Market
The residential segment currently dominates the Rooftop Solar PV Installation Market, holding a xx% market share in 2025, followed by the commercial and industrial segments with xx% and xx%, respectively. This dominance is primarily driven by increasing consumer awareness of environmental issues and the availability of government incentives for residential installations. However, the commercial and industrial segments are expected to experience faster growth during the forecast period, due to the potential for significant energy cost savings and corporate sustainability initiatives.
Key Drivers for Residential Segment Dominance:
- Government incentives: Tax credits and rebates make solar more affordable.
- Energy cost savings: Reduced electricity bills are a significant attraction.
- Environmental awareness: Consumers are increasingly conscious of their carbon footprint.
Key Drivers for Commercial and Industrial Segment Growth:
- Energy cost reduction: Significant savings potential for large businesses.
- Corporate sustainability goals: Companies aim to reduce their environmental impact.
- Return on investment (ROI): Solar investments can offer strong financial returns.
Rooftop Solar Photovoltaic Installation Market Product Developments
Recent product innovations focus on enhancing efficiency, durability, and aesthetics. New high-efficiency panels, advanced inverters, and improved mounting systems are improving system performance and reducing costs. The integration of battery storage is becoming increasingly common, enabling greater energy independence and grid resilience. These developments are driving market growth by addressing key consumer concerns regarding reliability, cost-effectiveness, and visual appeal.
Report Scope & Segmentation Analysis
This report segments the Rooftop Solar PV Installation Market based on location of deployment:
Residential: This segment encompasses installations on residential buildings, including single-family homes and multi-family dwellings. Growth is projected at xx% CAGR during the forecast period. Competition is high due to many players servicing this market.
Commercial: This segment includes installations on commercial buildings, such as office buildings, retail spaces, and warehouses. It’s projected to grow at xx% CAGR, driven by corporate sustainability initiatives and cost savings. Larger projects and specialized expertise are involved.
Industrial: This segment covers large-scale installations on industrial facilities, often involving significant energy consumption. Growth is projected at xx% CAGR, driven by demand for on-site renewable energy and government incentives for energy efficiency. Large-scale projects require specialized expertise and financing.
Key Drivers of Rooftop Solar Photovoltaic Installation Market Growth
The market's growth is propelled by a confluence of factors: decreasing solar panel costs, supportive government policies (like tax credits and feed-in tariffs), increasing energy prices, rising environmental consciousness among consumers and businesses, and technological advancements leading to greater efficiency and reliability of PV systems. Furthermore, the increasing need for energy independence and the integration of smart grid technologies further accelerate market growth.
Challenges in the Rooftop Solar Photovoltaic Installation Market Sector
The Rooftop Solar PV Installation Market faces several challenges including high initial investment costs, dependence on weather conditions, intermittency issues, permitting complexities, and potential grid integration problems. Supply chain disruptions also impact availability and costs of components, affecting project timelines. Competition within the industry is fierce, requiring companies to continually innovate and offer competitive pricing.
Emerging Opportunities in Rooftop Solar Photovoltaic Installation Market
Emerging opportunities lie in integrating solar PV with energy storage systems, expanding into new geographic markets (particularly in developing economies), developing innovative financing models to reduce upfront costs, and focusing on community solar projects. The integration of solar PV with other renewable energy sources and smart building technologies also presents significant opportunities.
Leading Players in the Rooftop Solar Photovoltaic Installation Market
- Pink Energy
- Infinity Energy Inc
- Baker Electric Home Energy
- Momentum Solar
- Semper Solaris Construction Inc
- Canadian Solar Inc
- Elemental Energy Inc
- Titan Solar Power NV Inc
- ADT Solar
- ReVision Energy LLC
Key Developments in Rooftop Solar Photovoltaic Installation Market Industry
May 2022: The University at Albany and the New York Power Authority (NYPA) launched a 1.9 MWdc rooftop solar array, showcasing the potential for large-scale deployments in educational settings. This highlights the growing adoption of solar in the public sector and its contribution to sustainability initiatives.
April 2022: Cleantech Solar completed a 625 kWp rooftop solar PV system in India in just 59 days, demonstrating streamlined project execution and the potential for rapid deployment in emerging markets. This highlights efficiency gains in project delivery and the growing market in developing countries.
Strategic Outlook for Rooftop Solar Photovoltaic Installation Market
The Rooftop Solar PV Installation Market is poised for continued significant growth, driven by increasing energy demand, government support, technological progress, and heightened environmental concerns. Further advancements in energy storage and grid integration, coupled with innovative business models and financing options, will be critical to unlocking the market's full potential. Companies that can effectively navigate the evolving regulatory landscape, manage supply chain risks, and provide comprehensive customer solutions will be best positioned to succeed.
Rooftop Solar Photovoltaic Installation Market Segmentation
-
1. Location of Deployment
- 1.1. Residential
- 1.2. Commercial and Industrial
Rooftop Solar Photovoltaic Installation Market Segmentation By Geography
-
1. North America
- 1.1. United States
- 1.2. Canada
- 1.3. Rest of North America
-
2. Asia Pacific
- 2.1. China
- 2.2. India
- 2.3. Australia
- 2.4. Japan
- 2.5. Malaysia
- 2.6. Thailand
- 2.7. Indonesia
- 2.8. Vietnam
- 2.9. Rest of Asia Pacific
-
3. Europe
- 3.1. Germany
- 3.2. United Kingdom
- 3.3. Spain
- 3.4. Italy
- 3.5. France
- 3.6. Nordic Countries
- 3.7. Turkey
- 3.8. Russia
- 3.9. Rest of Europe
-
4. South America
- 4.1. Brazil
- 4.2. Argentina
- 4.3. Colombia
- 4.4. Rest of South America
-
5. Middle East and Africa
- 5.1. Saudi Arabia
- 5.2. United Arab Emirates
- 5.3. Qatar
- 5.4. South Africa
- 5.5. Egypt
- 5.6. Nigeria
- 5.7. Rest of Middle East and Africa
Rooftop Solar Photovoltaic Installation Market REPORT HIGHLIGHTS
| Aspects | Details |
|---|---|
| Study Period | 2019-2033 |
| Base Year | 2024 |
| Estimated Year | 2025 |
| Forecast Period | 2025-2033 |
| Historical Period | 2019-2024 |
| Growth Rate | CAGR of 8.04% from 2019-2033 |
| Segmentation |
|
Table of Contents
- 1. Introduction
- 1.1. Research Scope
- 1.2. Market Segmentation
- 1.3. Research Methodology
- 1.4. Definitions and Assumptions
- 2. Executive Summary
- 2.1. Introduction
- 3. Market Dynamics
- 3.1. Introduction
- 3.2. Market Drivers
- 3.2.1. 4.; Declining Solar Panel Costs4.; Supportive Government Policies
- 3.3. Market Restrains
- 3.3.1. 4.; High Upfront Cost
- 3.4. Market Trends
- 3.4.1. Residential Rooftop Installation Expected to Dominate the Market
- 4. Market Factor Analysis
- 4.1. Porters Five Forces
- 4.2. Supply/Value Chain
- 4.3. PESTEL analysis
- 4.4. Market Entropy
- 4.5. Patent/Trademark Analysis
- 5. Global Rooftop Solar Photovoltaic Installation Market Analysis, Insights and Forecast, 2019-2031
- 5.1. Market Analysis, Insights and Forecast - by Location of Deployment
- 5.1.1. Residential
- 5.1.2. Commercial and Industrial
- 5.2. Market Analysis, Insights and Forecast - by Region
- 5.2.1. North America
- 5.2.2. Asia Pacific
- 5.2.3. Europe
- 5.2.4. South America
- 5.2.5. Middle East and Africa
- 5.1. Market Analysis, Insights and Forecast - by Location of Deployment
- 6. North America Rooftop Solar Photovoltaic Installation Market Analysis, Insights and Forecast, 2019-2031
- 6.1. Market Analysis, Insights and Forecast - by Location of Deployment
- 6.1.1. Residential
- 6.1.2. Commercial and Industrial
- 6.1. Market Analysis, Insights and Forecast - by Location of Deployment
- 7. Asia Pacific Rooftop Solar Photovoltaic Installation Market Analysis, Insights and Forecast, 2019-2031
- 7.1. Market Analysis, Insights and Forecast - by Location of Deployment
- 7.1.1. Residential
- 7.1.2. Commercial and Industrial
- 7.1. Market Analysis, Insights and Forecast - by Location of Deployment
- 8. Europe Rooftop Solar Photovoltaic Installation Market Analysis, Insights and Forecast, 2019-2031
- 8.1. Market Analysis, Insights and Forecast - by Location of Deployment
- 8.1.1. Residential
- 8.1.2. Commercial and Industrial
- 8.1. Market Analysis, Insights and Forecast - by Location of Deployment
- 9. South America Rooftop Solar Photovoltaic Installation Market Analysis, Insights and Forecast, 2019-2031
- 9.1. Market Analysis, Insights and Forecast - by Location of Deployment
- 9.1.1. Residential
- 9.1.2. Commercial and Industrial
- 9.1. Market Analysis, Insights and Forecast - by Location of Deployment
- 10. Middle East and Africa Rooftop Solar Photovoltaic Installation Market Analysis, Insights and Forecast, 2019-2031
- 10.1. Market Analysis, Insights and Forecast - by Location of Deployment
- 10.1.1. Residential
- 10.1.2. Commercial and Industrial
- 10.1. Market Analysis, Insights and Forecast - by Location of Deployment
- 11. North America Rooftop Solar Photovoltaic Installation Market Analysis, Insights and Forecast, 2019-2031
- 11.1. Market Analysis, Insights and Forecast - By Country/Sub-region
- 11.1.1 United States
- 11.1.2 Canada
- 11.1.3 Mexico
- 12. Europe Rooftop Solar Photovoltaic Installation Market Analysis, Insights and Forecast, 2019-2031
- 12.1. Market Analysis, Insights and Forecast - By Country/Sub-region
- 12.1.1 Germany
- 12.1.2 United Kingdom
- 12.1.3 France
- 12.1.4 Spain
- 12.1.5 Italy
- 12.1.6 Spain
- 12.1.7 Belgium
- 12.1.8 Netherland
- 12.1.9 Nordics
- 12.1.10 Rest of Europe
- 13. Asia Pacific Rooftop Solar Photovoltaic Installation Market Analysis, Insights and Forecast, 2019-2031
- 13.1. Market Analysis, Insights and Forecast - By Country/Sub-region
- 13.1.1 China
- 13.1.2 Japan
- 13.1.3 India
- 13.1.4 South Korea
- 13.1.5 Southeast Asia
- 13.1.6 Australia
- 13.1.7 Indonesia
- 13.1.8 Phillipes
- 13.1.9 Singapore
- 13.1.10 Thailandc
- 13.1.11 Rest of Asia Pacific
- 14. South America Rooftop Solar Photovoltaic Installation Market Analysis, Insights and Forecast, 2019-2031
- 14.1. Market Analysis, Insights and Forecast - By Country/Sub-region
- 14.1.1 Brazil
- 14.1.2 Argentina
- 14.1.3 Peru
- 14.1.4 Chile
- 14.1.5 Colombia
- 14.1.6 Ecuador
- 14.1.7 Venezuela
- 14.1.8 Rest of South America
- 15. North America Rooftop Solar Photovoltaic Installation Market Analysis, Insights and Forecast, 2019-2031
- 15.1. Market Analysis, Insights and Forecast - By Country/Sub-region
- 15.1.1 United States
- 15.1.2 Canada
- 15.1.3 Mexico
- 16. MEA Rooftop Solar Photovoltaic Installation Market Analysis, Insights and Forecast, 2019-2031
- 16.1. Market Analysis, Insights and Forecast - By Country/Sub-region
- 16.1.1 United Arab Emirates
- 16.1.2 Saudi Arabia
- 16.1.3 South Africa
- 16.1.4 Rest of Middle East and Africa
- 17. Competitive Analysis
- 17.1. Global Market Share Analysis 2024
- 17.2. Company Profiles
- 17.2.1 Pink Energy
- 17.2.1.1. Overview
- 17.2.1.2. Products
- 17.2.1.3. SWOT Analysis
- 17.2.1.4. Recent Developments
- 17.2.1.5. Financials (Based on Availability)
- 17.2.2 Infinity Energy Inc *List Not Exhaustive 6 4 Market Ranking/Share Analysi
- 17.2.2.1. Overview
- 17.2.2.2. Products
- 17.2.2.3. SWOT Analysis
- 17.2.2.4. Recent Developments
- 17.2.2.5. Financials (Based on Availability)
- 17.2.3 Baker Electric Home Energy
- 17.2.3.1. Overview
- 17.2.3.2. Products
- 17.2.3.3. SWOT Analysis
- 17.2.3.4. Recent Developments
- 17.2.3.5. Financials (Based on Availability)
- 17.2.4 Momentum Solar
- 17.2.4.1. Overview
- 17.2.4.2. Products
- 17.2.4.3. SWOT Analysis
- 17.2.4.4. Recent Developments
- 17.2.4.5. Financials (Based on Availability)
- 17.2.5 Semper Solaris Construction Inc
- 17.2.5.1. Overview
- 17.2.5.2. Products
- 17.2.5.3. SWOT Analysis
- 17.2.5.4. Recent Developments
- 17.2.5.5. Financials (Based on Availability)
- 17.2.6 Canadian Solar Inc
- 17.2.6.1. Overview
- 17.2.6.2. Products
- 17.2.6.3. SWOT Analysis
- 17.2.6.4. Recent Developments
- 17.2.6.5. Financials (Based on Availability)
- 17.2.7 Elemental Energy Inc
- 17.2.7.1. Overview
- 17.2.7.2. Products
- 17.2.7.3. SWOT Analysis
- 17.2.7.4. Recent Developments
- 17.2.7.5. Financials (Based on Availability)
- 17.2.8 Titan Solar Power NV Inc
- 17.2.8.1. Overview
- 17.2.8.2. Products
- 17.2.8.3. SWOT Analysis
- 17.2.8.4. Recent Developments
- 17.2.8.5. Financials (Based on Availability)
- 17.2.9 ADT Solar
- 17.2.9.1. Overview
- 17.2.9.2. Products
- 17.2.9.3. SWOT Analysis
- 17.2.9.4. Recent Developments
- 17.2.9.5. Financials (Based on Availability)
- 17.2.10 ReVision Energy LLC
- 17.2.10.1. Overview
- 17.2.10.2. Products
- 17.2.10.3. SWOT Analysis
- 17.2.10.4. Recent Developments
- 17.2.10.5. Financials (Based on Availability)
- 17.2.1 Pink Energy
List of Figures
- Figure 1: Global Rooftop Solar Photovoltaic Installation Market Revenue Breakdown (Million, %) by Region 2024 & 2032
- Figure 2: Global Rooftop Solar Photovoltaic Installation Market Volume Breakdown (gigawatt, %) by Region 2024 & 2032
- Figure 3: North America Rooftop Solar Photovoltaic Installation Market Revenue (Million), by Country 2024 & 2032
- Figure 4: North America Rooftop Solar Photovoltaic Installation Market Volume (gigawatt), by Country 2024 & 2032
- Figure 5: North America Rooftop Solar Photovoltaic Installation Market Revenue Share (%), by Country 2024 & 2032
- Figure 6: North America Rooftop Solar Photovoltaic Installation Market Volume Share (%), by Country 2024 & 2032
- Figure 7: Europe Rooftop Solar Photovoltaic Installation Market Revenue (Million), by Country 2024 & 2032
- Figure 8: Europe Rooftop Solar Photovoltaic Installation Market Volume (gigawatt), by Country 2024 & 2032
- Figure 9: Europe Rooftop Solar Photovoltaic Installation Market Revenue Share (%), by Country 2024 & 2032
- Figure 10: Europe Rooftop Solar Photovoltaic Installation Market Volume Share (%), by Country 2024 & 2032
- Figure 11: Asia Pacific Rooftop Solar Photovoltaic Installation Market Revenue (Million), by Country 2024 & 2032
- Figure 12: Asia Pacific Rooftop Solar Photovoltaic Installation Market Volume (gigawatt), by Country 2024 & 2032
- Figure 13: Asia Pacific Rooftop Solar Photovoltaic Installation Market Revenue Share (%), by Country 2024 & 2032
- Figure 14: Asia Pacific Rooftop Solar Photovoltaic Installation Market Volume Share (%), by Country 2024 & 2032
- Figure 15: South America Rooftop Solar Photovoltaic Installation Market Revenue (Million), by Country 2024 & 2032
- Figure 16: South America Rooftop Solar Photovoltaic Installation Market Volume (gigawatt), by Country 2024 & 2032
- Figure 17: South America Rooftop Solar Photovoltaic Installation Market Revenue Share (%), by Country 2024 & 2032
- Figure 18: South America Rooftop Solar Photovoltaic Installation Market Volume Share (%), by Country 2024 & 2032
- Figure 19: North America Rooftop Solar Photovoltaic Installation Market Revenue (Million), by Country 2024 & 2032
- Figure 20: North America Rooftop Solar Photovoltaic Installation Market Volume (gigawatt), by Country 2024 & 2032
- Figure 21: North America Rooftop Solar Photovoltaic Installation Market Revenue Share (%), by Country 2024 & 2032
- Figure 22: North America Rooftop Solar Photovoltaic Installation Market Volume Share (%), by Country 2024 & 2032
- Figure 23: MEA Rooftop Solar Photovoltaic Installation Market Revenue (Million), by Country 2024 & 2032
- Figure 24: MEA Rooftop Solar Photovoltaic Installation Market Volume (gigawatt), by Country 2024 & 2032
- Figure 25: MEA Rooftop Solar Photovoltaic Installation Market Revenue Share (%), by Country 2024 & 2032
- Figure 26: MEA Rooftop Solar Photovoltaic Installation Market Volume Share (%), by Country 2024 & 2032
- Figure 27: North America Rooftop Solar Photovoltaic Installation Market Revenue (Million), by Location of Deployment 2024 & 2032
- Figure 28: North America Rooftop Solar Photovoltaic Installation Market Volume (gigawatt), by Location of Deployment 2024 & 2032
- Figure 29: North America Rooftop Solar Photovoltaic Installation Market Revenue Share (%), by Location of Deployment 2024 & 2032
- Figure 30: North America Rooftop Solar Photovoltaic Installation Market Volume Share (%), by Location of Deployment 2024 & 2032
- Figure 31: North America Rooftop Solar Photovoltaic Installation Market Revenue (Million), by Country 2024 & 2032
- Figure 32: North America Rooftop Solar Photovoltaic Installation Market Volume (gigawatt), by Country 2024 & 2032
- Figure 33: North America Rooftop Solar Photovoltaic Installation Market Revenue Share (%), by Country 2024 & 2032
- Figure 34: North America Rooftop Solar Photovoltaic Installation Market Volume Share (%), by Country 2024 & 2032
- Figure 35: Asia Pacific Rooftop Solar Photovoltaic Installation Market Revenue (Million), by Location of Deployment 2024 & 2032
- Figure 36: Asia Pacific Rooftop Solar Photovoltaic Installation Market Volume (gigawatt), by Location of Deployment 2024 & 2032
- Figure 37: Asia Pacific Rooftop Solar Photovoltaic Installation Market Revenue Share (%), by Location of Deployment 2024 & 2032
- Figure 38: Asia Pacific Rooftop Solar Photovoltaic Installation Market Volume Share (%), by Location of Deployment 2024 & 2032
- Figure 39: Asia Pacific Rooftop Solar Photovoltaic Installation Market Revenue (Million), by Country 2024 & 2032
- Figure 40: Asia Pacific Rooftop Solar Photovoltaic Installation Market Volume (gigawatt), by Country 2024 & 2032
- Figure 41: Asia Pacific Rooftop Solar Photovoltaic Installation Market Revenue Share (%), by Country 2024 & 2032
- Figure 42: Asia Pacific Rooftop Solar Photovoltaic Installation Market Volume Share (%), by Country 2024 & 2032
- Figure 43: Europe Rooftop Solar Photovoltaic Installation Market Revenue (Million), by Location of Deployment 2024 & 2032
- Figure 44: Europe Rooftop Solar Photovoltaic Installation Market Volume (gigawatt), by Location of Deployment 2024 & 2032
- Figure 45: Europe Rooftop Solar Photovoltaic Installation Market Revenue Share (%), by Location of Deployment 2024 & 2032
- Figure 46: Europe Rooftop Solar Photovoltaic Installation Market Volume Share (%), by Location of Deployment 2024 & 2032
- Figure 47: Europe Rooftop Solar Photovoltaic Installation Market Revenue (Million), by Country 2024 & 2032
- Figure 48: Europe Rooftop Solar Photovoltaic Installation Market Volume (gigawatt), by Country 2024 & 2032
- Figure 49: Europe Rooftop Solar Photovoltaic Installation Market Revenue Share (%), by Country 2024 & 2032
- Figure 50: Europe Rooftop Solar Photovoltaic Installation Market Volume Share (%), by Country 2024 & 2032
- Figure 51: South America Rooftop Solar Photovoltaic Installation Market Revenue (Million), by Location of Deployment 2024 & 2032
- Figure 52: South America Rooftop Solar Photovoltaic Installation Market Volume (gigawatt), by Location of Deployment 2024 & 2032
- Figure 53: South America Rooftop Solar Photovoltaic Installation Market Revenue Share (%), by Location of Deployment 2024 & 2032
- Figure 54: South America Rooftop Solar Photovoltaic Installation Market Volume Share (%), by Location of Deployment 2024 & 2032
- Figure 55: South America Rooftop Solar Photovoltaic Installation Market Revenue (Million), by Country 2024 & 2032
- Figure 56: South America Rooftop Solar Photovoltaic Installation Market Volume (gigawatt), by Country 2024 & 2032
- Figure 57: South America Rooftop Solar Photovoltaic Installation Market Revenue Share (%), by Country 2024 & 2032
- Figure 58: South America Rooftop Solar Photovoltaic Installation Market Volume Share (%), by Country 2024 & 2032
- Figure 59: Middle East and Africa Rooftop Solar Photovoltaic Installation Market Revenue (Million), by Location of Deployment 2024 & 2032
- Figure 60: Middle East and Africa Rooftop Solar Photovoltaic Installation Market Volume (gigawatt), by Location of Deployment 2024 & 2032
- Figure 61: Middle East and Africa Rooftop Solar Photovoltaic Installation Market Revenue Share (%), by Location of Deployment 2024 & 2032
- Figure 62: Middle East and Africa Rooftop Solar Photovoltaic Installation Market Volume Share (%), by Location of Deployment 2024 & 2032
- Figure 63: Middle East and Africa Rooftop Solar Photovoltaic Installation Market Revenue (Million), by Country 2024 & 2032
- Figure 64: Middle East and Africa Rooftop Solar Photovoltaic Installation Market Volume (gigawatt), by Country 2024 & 2032
- Figure 65: Middle East and Africa Rooftop Solar Photovoltaic Installation Market Revenue Share (%), by Country 2024 & 2032
- Figure 66: Middle East and Africa Rooftop Solar Photovoltaic Installation Market Volume Share (%), by Country 2024 & 2032
List of Tables
- Table 1: Global Rooftop Solar Photovoltaic Installation Market Revenue Million Forecast, by Region 2019 & 2032
- Table 2: Global Rooftop Solar Photovoltaic Installation Market Volume gigawatt Forecast, by Region 2019 & 2032
- Table 3: Global Rooftop Solar Photovoltaic Installation Market Revenue Million Forecast, by Location of Deployment 2019 & 2032
- Table 4: Global Rooftop Solar Photovoltaic Installation Market Volume gigawatt Forecast, by Location of Deployment 2019 & 2032
- Table 5: Global Rooftop Solar Photovoltaic Installation Market Revenue Million Forecast, by Region 2019 & 2032
- Table 6: Global Rooftop Solar Photovoltaic Installation Market Volume gigawatt Forecast, by Region 2019 & 2032
- Table 7: Global Rooftop Solar Photovoltaic Installation Market Revenue Million Forecast, by Country 2019 & 2032
- Table 8: Global Rooftop Solar Photovoltaic Installation Market Volume gigawatt Forecast, by Country 2019 & 2032
- Table 9: United States Rooftop Solar Photovoltaic Installation Market Revenue (Million) Forecast, by Application 2019 & 2032
- Table 10: United States Rooftop Solar Photovoltaic Installation Market Volume (gigawatt) Forecast, by Application 2019 & 2032
- Table 11: Canada Rooftop Solar Photovoltaic Installation Market Revenue (Million) Forecast, by Application 2019 & 2032
- Table 12: Canada Rooftop Solar Photovoltaic Installation Market Volume (gigawatt) Forecast, by Application 2019 & 2032
- Table 13: Mexico Rooftop Solar Photovoltaic Installation Market Revenue (Million) Forecast, by Application 2019 & 2032
- Table 14: Mexico Rooftop Solar Photovoltaic Installation Market Volume (gigawatt) Forecast, by Application 2019 & 2032
- Table 15: Global Rooftop Solar Photovoltaic Installation Market Revenue Million Forecast, by Country 2019 & 2032
- Table 16: Global Rooftop Solar Photovoltaic Installation Market Volume gigawatt Forecast, by Country 2019 & 2032
- Table 17: Germany Rooftop Solar Photovoltaic Installation Market Revenue (Million) Forecast, by Application 2019 & 2032
- Table 18: Germany Rooftop Solar Photovoltaic Installation Market Volume (gigawatt) Forecast, by Application 2019 & 2032
- Table 19: United Kingdom Rooftop Solar Photovoltaic Installation Market Revenue (Million) Forecast, by Application 2019 & 2032
- Table 20: United Kingdom Rooftop Solar Photovoltaic Installation Market Volume (gigawatt) Forecast, by Application 2019 & 2032
- Table 21: France Rooftop Solar Photovoltaic Installation Market Revenue (Million) Forecast, by Application 2019 & 2032
- Table 22: France Rooftop Solar Photovoltaic Installation Market Volume (gigawatt) Forecast, by Application 2019 & 2032
- Table 23: Spain Rooftop Solar Photovoltaic Installation Market Revenue (Million) Forecast, by Application 2019 & 2032
- Table 24: Spain Rooftop Solar Photovoltaic Installation Market Volume (gigawatt) Forecast, by Application 2019 & 2032
- Table 25: Italy Rooftop Solar Photovoltaic Installation Market Revenue (Million) Forecast, by Application 2019 & 2032
- Table 26: Italy Rooftop Solar Photovoltaic Installation Market Volume (gigawatt) Forecast, by Application 2019 & 2032
- Table 27: Spain Rooftop Solar Photovoltaic Installation Market Revenue (Million) Forecast, by Application 2019 & 2032
- Table 28: Spain Rooftop Solar Photovoltaic Installation Market Volume (gigawatt) Forecast, by Application 2019 & 2032
- Table 29: Belgium Rooftop Solar Photovoltaic Installation Market Revenue (Million) Forecast, by Application 2019 & 2032
- Table 30: Belgium Rooftop Solar Photovoltaic Installation Market Volume (gigawatt) Forecast, by Application 2019 & 2032
- Table 31: Netherland Rooftop Solar Photovoltaic Installation Market Revenue (Million) Forecast, by Application 2019 & 2032
- Table 32: Netherland Rooftop Solar Photovoltaic Installation Market Volume (gigawatt) Forecast, by Application 2019 & 2032
- Table 33: Nordics Rooftop Solar Photovoltaic Installation Market Revenue (Million) Forecast, by Application 2019 & 2032
- Table 34: Nordics Rooftop Solar Photovoltaic Installation Market Volume (gigawatt) Forecast, by Application 2019 & 2032
- Table 35: Rest of Europe Rooftop Solar Photovoltaic Installation Market Revenue (Million) Forecast, by Application 2019 & 2032
- Table 36: Rest of Europe Rooftop Solar Photovoltaic Installation Market Volume (gigawatt) Forecast, by Application 2019 & 2032
- Table 37: Global Rooftop Solar Photovoltaic Installation Market Revenue Million Forecast, by Country 2019 & 2032
- Table 38: Global Rooftop Solar Photovoltaic Installation Market Volume gigawatt Forecast, by Country 2019 & 2032
- Table 39: China Rooftop Solar Photovoltaic Installation Market Revenue (Million) Forecast, by Application 2019 & 2032
- Table 40: China Rooftop Solar Photovoltaic Installation Market Volume (gigawatt) Forecast, by Application 2019 & 2032
- Table 41: Japan Rooftop Solar Photovoltaic Installation Market Revenue (Million) Forecast, by Application 2019 & 2032
- Table 42: Japan Rooftop Solar Photovoltaic Installation Market Volume (gigawatt) Forecast, by Application 2019 & 2032
- Table 43: India Rooftop Solar Photovoltaic Installation Market Revenue (Million) Forecast, by Application 2019 & 2032
- Table 44: India Rooftop Solar Photovoltaic Installation Market Volume (gigawatt) Forecast, by Application 2019 & 2032
- Table 45: South Korea Rooftop Solar Photovoltaic Installation Market Revenue (Million) Forecast, by Application 2019 & 2032
- Table 46: South Korea Rooftop Solar Photovoltaic Installation Market Volume (gigawatt) Forecast, by Application 2019 & 2032
- Table 47: Southeast Asia Rooftop Solar Photovoltaic Installation Market Revenue (Million) Forecast, by Application 2019 & 2032
- Table 48: Southeast Asia Rooftop Solar Photovoltaic Installation Market Volume (gigawatt) Forecast, by Application 2019 & 2032
- Table 49: Australia Rooftop Solar Photovoltaic Installation Market Revenue (Million) Forecast, by Application 2019 & 2032
- Table 50: Australia Rooftop Solar Photovoltaic Installation Market Volume (gigawatt) Forecast, by Application 2019 & 2032
- Table 51: Indonesia Rooftop Solar Photovoltaic Installation Market Revenue (Million) Forecast, by Application 2019 & 2032
- Table 52: Indonesia Rooftop Solar Photovoltaic Installation Market Volume (gigawatt) Forecast, by Application 2019 & 2032
- Table 53: Phillipes Rooftop Solar Photovoltaic Installation Market Revenue (Million) Forecast, by Application 2019 & 2032
- Table 54: Phillipes Rooftop Solar Photovoltaic Installation Market Volume (gigawatt) Forecast, by Application 2019 & 2032
- Table 55: Singapore Rooftop Solar Photovoltaic Installation Market Revenue (Million) Forecast, by Application 2019 & 2032
- Table 56: Singapore Rooftop Solar Photovoltaic Installation Market Volume (gigawatt) Forecast, by Application 2019 & 2032
- Table 57: Thailandc Rooftop Solar Photovoltaic Installation Market Revenue (Million) Forecast, by Application 2019 & 2032
- Table 58: Thailandc Rooftop Solar Photovoltaic Installation Market Volume (gigawatt) Forecast, by Application 2019 & 2032
- Table 59: Rest of Asia Pacific Rooftop Solar Photovoltaic Installation Market Revenue (Million) Forecast, by Application 2019 & 2032
- Table 60: Rest of Asia Pacific Rooftop Solar Photovoltaic Installation Market Volume (gigawatt) Forecast, by Application 2019 & 2032
- Table 61: Global Rooftop Solar Photovoltaic Installation Market Revenue Million Forecast, by Country 2019 & 2032
- Table 62: Global Rooftop Solar Photovoltaic Installation Market Volume gigawatt Forecast, by Country 2019 & 2032
- Table 63: Brazil Rooftop Solar Photovoltaic Installation Market Revenue (Million) Forecast, by Application 2019 & 2032
- Table 64: Brazil Rooftop Solar Photovoltaic Installation Market Volume (gigawatt) Forecast, by Application 2019 & 2032
- Table 65: Argentina Rooftop Solar Photovoltaic Installation Market Revenue (Million) Forecast, by Application 2019 & 2032
- Table 66: Argentina Rooftop Solar Photovoltaic Installation Market Volume (gigawatt) Forecast, by Application 2019 & 2032
- Table 67: Peru Rooftop Solar Photovoltaic Installation Market Revenue (Million) Forecast, by Application 2019 & 2032
- Table 68: Peru Rooftop Solar Photovoltaic Installation Market Volume (gigawatt) Forecast, by Application 2019 & 2032
- Table 69: Chile Rooftop Solar Photovoltaic Installation Market Revenue (Million) Forecast, by Application 2019 & 2032
- Table 70: Chile Rooftop Solar Photovoltaic Installation Market Volume (gigawatt) Forecast, by Application 2019 & 2032
- Table 71: Colombia Rooftop Solar Photovoltaic Installation Market Revenue (Million) Forecast, by Application 2019 & 2032
- Table 72: Colombia Rooftop Solar Photovoltaic Installation Market Volume (gigawatt) Forecast, by Application 2019 & 2032
- Table 73: Ecuador Rooftop Solar Photovoltaic Installation Market Revenue (Million) Forecast, by Application 2019 & 2032
- Table 74: Ecuador Rooftop Solar Photovoltaic Installation Market Volume (gigawatt) Forecast, by Application 2019 & 2032
- Table 75: Venezuela Rooftop Solar Photovoltaic Installation Market Revenue (Million) Forecast, by Application 2019 & 2032
- Table 76: Venezuela Rooftop Solar Photovoltaic Installation Market Volume (gigawatt) Forecast, by Application 2019 & 2032
- Table 77: Rest of South America Rooftop Solar Photovoltaic Installation Market Revenue (Million) Forecast, by Application 2019 & 2032
- Table 78: Rest of South America Rooftop Solar Photovoltaic Installation Market Volume (gigawatt) Forecast, by Application 2019 & 2032
- Table 79: Global Rooftop Solar Photovoltaic Installation Market Revenue Million Forecast, by Country 2019 & 2032
- Table 80: Global Rooftop Solar Photovoltaic Installation Market Volume gigawatt Forecast, by Country 2019 & 2032
- Table 81: United States Rooftop Solar Photovoltaic Installation Market Revenue (Million) Forecast, by Application 2019 & 2032
- Table 82: United States Rooftop Solar Photovoltaic Installation Market Volume (gigawatt) Forecast, by Application 2019 & 2032
- Table 83: Canada Rooftop Solar Photovoltaic Installation Market Revenue (Million) Forecast, by Application 2019 & 2032
- Table 84: Canada Rooftop Solar Photovoltaic Installation Market Volume (gigawatt) Forecast, by Application 2019 & 2032
- Table 85: Mexico Rooftop Solar Photovoltaic Installation Market Revenue (Million) Forecast, by Application 2019 & 2032
- Table 86: Mexico Rooftop Solar Photovoltaic Installation Market Volume (gigawatt) Forecast, by Application 2019 & 2032
- Table 87: Global Rooftop Solar Photovoltaic Installation Market Revenue Million Forecast, by Country 2019 & 2032
- Table 88: Global Rooftop Solar Photovoltaic Installation Market Volume gigawatt Forecast, by Country 2019 & 2032
- Table 89: United Arab Emirates Rooftop Solar Photovoltaic Installation Market Revenue (Million) Forecast, by Application 2019 & 2032
- Table 90: United Arab Emirates Rooftop Solar Photovoltaic Installation Market Volume (gigawatt) Forecast, by Application 2019 & 2032
- Table 91: Saudi Arabia Rooftop Solar Photovoltaic Installation Market Revenue (Million) Forecast, by Application 2019 & 2032
- Table 92: Saudi Arabia Rooftop Solar Photovoltaic Installation Market Volume (gigawatt) Forecast, by Application 2019 & 2032
- Table 93: South Africa Rooftop Solar Photovoltaic Installation Market Revenue (Million) Forecast, by Application 2019 & 2032
- Table 94: South Africa Rooftop Solar Photovoltaic Installation Market Volume (gigawatt) Forecast, by Application 2019 & 2032
- Table 95: Rest of Middle East and Africa Rooftop Solar Photovoltaic Installation Market Revenue (Million) Forecast, by Application 2019 & 2032
- Table 96: Rest of Middle East and Africa Rooftop Solar Photovoltaic Installation Market Volume (gigawatt) Forecast, by Application 2019 & 2032
- Table 97: Global Rooftop Solar Photovoltaic Installation Market Revenue Million Forecast, by Location of Deployment 2019 & 2032
- Table 98: Global Rooftop Solar Photovoltaic Installation Market Volume gigawatt Forecast, by Location of Deployment 2019 & 2032
- Table 99: Global Rooftop Solar Photovoltaic Installation Market Revenue Million Forecast, by Country 2019 & 2032
- Table 100: Global Rooftop Solar Photovoltaic Installation Market Volume gigawatt Forecast, by Country 2019 & 2032
- Table 101: United States Rooftop Solar Photovoltaic Installation Market Revenue (Million) Forecast, by Application 2019 & 2032
- Table 102: United States Rooftop Solar Photovoltaic Installation Market Volume (gigawatt) Forecast, by Application 2019 & 2032
- Table 103: Canada Rooftop Solar Photovoltaic Installation Market Revenue (Million) Forecast, by Application 2019 & 2032
- Table 104: Canada Rooftop Solar Photovoltaic Installation Market Volume (gigawatt) Forecast, by Application 2019 & 2032
- Table 105: Rest of North America Rooftop Solar Photovoltaic Installation Market Revenue (Million) Forecast, by Application 2019 & 2032
- Table 106: Rest of North America Rooftop Solar Photovoltaic Installation Market Volume (gigawatt) Forecast, by Application 2019 & 2032
- Table 107: Global Rooftop Solar Photovoltaic Installation Market Revenue Million Forecast, by Location of Deployment 2019 & 2032
- Table 108: Global Rooftop Solar Photovoltaic Installation Market Volume gigawatt Forecast, by Location of Deployment 2019 & 2032
- Table 109: Global Rooftop Solar Photovoltaic Installation Market Revenue Million Forecast, by Country 2019 & 2032
- Table 110: Global Rooftop Solar Photovoltaic Installation Market Volume gigawatt Forecast, by Country 2019 & 2032
- Table 111: China Rooftop Solar Photovoltaic Installation Market Revenue (Million) Forecast, by Application 2019 & 2032
- Table 112: China Rooftop Solar Photovoltaic Installation Market Volume (gigawatt) Forecast, by Application 2019 & 2032
- Table 113: India Rooftop Solar Photovoltaic Installation Market Revenue (Million) Forecast, by Application 2019 & 2032
- Table 114: India Rooftop Solar Photovoltaic Installation Market Volume (gigawatt) Forecast, by Application 2019 & 2032
- Table 115: Australia Rooftop Solar Photovoltaic Installation Market Revenue (Million) Forecast, by Application 2019 & 2032
- Table 116: Australia Rooftop Solar Photovoltaic Installation Market Volume (gigawatt) Forecast, by Application 2019 & 2032
- Table 117: Japan Rooftop Solar Photovoltaic Installation Market Revenue (Million) Forecast, by Application 2019 & 2032
- Table 118: Japan Rooftop Solar Photovoltaic Installation Market Volume (gigawatt) Forecast, by Application 2019 & 2032
- Table 119: Malaysia Rooftop Solar Photovoltaic Installation Market Revenue (Million) Forecast, by Application 2019 & 2032
- Table 120: Malaysia Rooftop Solar Photovoltaic Installation Market Volume (gigawatt) Forecast, by Application 2019 & 2032
- Table 121: Thailand Rooftop Solar Photovoltaic Installation Market Revenue (Million) Forecast, by Application 2019 & 2032
- Table 122: Thailand Rooftop Solar Photovoltaic Installation Market Volume (gigawatt) Forecast, by Application 2019 & 2032
- Table 123: Indonesia Rooftop Solar Photovoltaic Installation Market Revenue (Million) Forecast, by Application 2019 & 2032
- Table 124: Indonesia Rooftop Solar Photovoltaic Installation Market Volume (gigawatt) Forecast, by Application 2019 & 2032
- Table 125: Vietnam Rooftop Solar Photovoltaic Installation Market Revenue (Million) Forecast, by Application 2019 & 2032
- Table 126: Vietnam Rooftop Solar Photovoltaic Installation Market Volume (gigawatt) Forecast, by Application 2019 & 2032
- Table 127: Rest of Asia Pacific Rooftop Solar Photovoltaic Installation Market Revenue (Million) Forecast, by Application 2019 & 2032
- Table 128: Rest of Asia Pacific Rooftop Solar Photovoltaic Installation Market Volume (gigawatt) Forecast, by Application 2019 & 2032
- Table 129: Global Rooftop Solar Photovoltaic Installation Market Revenue Million Forecast, by Location of Deployment 2019 & 2032
- Table 130: Global Rooftop Solar Photovoltaic Installation Market Volume gigawatt Forecast, by Location of Deployment 2019 & 2032
- Table 131: Global Rooftop Solar Photovoltaic Installation Market Revenue Million Forecast, by Country 2019 & 2032
- Table 132: Global Rooftop Solar Photovoltaic Installation Market Volume gigawatt Forecast, by Country 2019 & 2032
- Table 133: Germany Rooftop Solar Photovoltaic Installation Market Revenue (Million) Forecast, by Application 2019 & 2032
- Table 134: Germany Rooftop Solar Photovoltaic Installation Market Volume (gigawatt) Forecast, by Application 2019 & 2032
- Table 135: United Kingdom Rooftop Solar Photovoltaic Installation Market Revenue (Million) Forecast, by Application 2019 & 2032
- Table 136: United Kingdom Rooftop Solar Photovoltaic Installation Market Volume (gigawatt) Forecast, by Application 2019 & 2032
- Table 137: Spain Rooftop Solar Photovoltaic Installation Market Revenue (Million) Forecast, by Application 2019 & 2032
- Table 138: Spain Rooftop Solar Photovoltaic Installation Market Volume (gigawatt) Forecast, by Application 2019 & 2032
- Table 139: Italy Rooftop Solar Photovoltaic Installation Market Revenue (Million) Forecast, by Application 2019 & 2032
- Table 140: Italy Rooftop Solar Photovoltaic Installation Market Volume (gigawatt) Forecast, by Application 2019 & 2032
- Table 141: France Rooftop Solar Photovoltaic Installation Market Revenue (Million) Forecast, by Application 2019 & 2032
- Table 142: France Rooftop Solar Photovoltaic Installation Market Volume (gigawatt) Forecast, by Application 2019 & 2032
- Table 143: Nordic Countries Rooftop Solar Photovoltaic Installation Market Revenue (Million) Forecast, by Application 2019 & 2032
- Table 144: Nordic Countries Rooftop Solar Photovoltaic Installation Market Volume (gigawatt) Forecast, by Application 2019 & 2032
- Table 145: Turkey Rooftop Solar Photovoltaic Installation Market Revenue (Million) Forecast, by Application 2019 & 2032
- Table 146: Turkey Rooftop Solar Photovoltaic Installation Market Volume (gigawatt) Forecast, by Application 2019 & 2032
- Table 147: Russia Rooftop Solar Photovoltaic Installation Market Revenue (Million) Forecast, by Application 2019 & 2032
- Table 148: Russia Rooftop Solar Photovoltaic Installation Market Volume (gigawatt) Forecast, by Application 2019 & 2032
- Table 149: Rest of Europe Rooftop Solar Photovoltaic Installation Market Revenue (Million) Forecast, by Application 2019 & 2032
- Table 150: Rest of Europe Rooftop Solar Photovoltaic Installation Market Volume (gigawatt) Forecast, by Application 2019 & 2032
- Table 151: Global Rooftop Solar Photovoltaic Installation Market Revenue Million Forecast, by Location of Deployment 2019 & 2032
- Table 152: Global Rooftop Solar Photovoltaic Installation Market Volume gigawatt Forecast, by Location of Deployment 2019 & 2032
- Table 153: Global Rooftop Solar Photovoltaic Installation Market Revenue Million Forecast, by Country 2019 & 2032
- Table 154: Global Rooftop Solar Photovoltaic Installation Market Volume gigawatt Forecast, by Country 2019 & 2032
- Table 155: Brazil Rooftop Solar Photovoltaic Installation Market Revenue (Million) Forecast, by Application 2019 & 2032
- Table 156: Brazil Rooftop Solar Photovoltaic Installation Market Volume (gigawatt) Forecast, by Application 2019 & 2032
- Table 157: Argentina Rooftop Solar Photovoltaic Installation Market Revenue (Million) Forecast, by Application 2019 & 2032
- Table 158: Argentina Rooftop Solar Photovoltaic Installation Market Volume (gigawatt) Forecast, by Application 2019 & 2032
- Table 159: Colombia Rooftop Solar Photovoltaic Installation Market Revenue (Million) Forecast, by Application 2019 & 2032
- Table 160: Colombia Rooftop Solar Photovoltaic Installation Market Volume (gigawatt) Forecast, by Application 2019 & 2032
- Table 161: Rest of South America Rooftop Solar Photovoltaic Installation Market Revenue (Million) Forecast, by Application 2019 & 2032
- Table 162: Rest of South America Rooftop Solar Photovoltaic Installation Market Volume (gigawatt) Forecast, by Application 2019 & 2032
- Table 163: Global Rooftop Solar Photovoltaic Installation Market Revenue Million Forecast, by Location of Deployment 2019 & 2032
- Table 164: Global Rooftop Solar Photovoltaic Installation Market Volume gigawatt Forecast, by Location of Deployment 2019 & 2032
- Table 165: Global Rooftop Solar Photovoltaic Installation Market Revenue Million Forecast, by Country 2019 & 2032
- Table 166: Global Rooftop Solar Photovoltaic Installation Market Volume gigawatt Forecast, by Country 2019 & 2032
- Table 167: Saudi Arabia Rooftop Solar Photovoltaic Installation Market Revenue (Million) Forecast, by Application 2019 & 2032
- Table 168: Saudi Arabia Rooftop Solar Photovoltaic Installation Market Volume (gigawatt) Forecast, by Application 2019 & 2032
- Table 169: United Arab Emirates Rooftop Solar Photovoltaic Installation Market Revenue (Million) Forecast, by Application 2019 & 2032
- Table 170: United Arab Emirates Rooftop Solar Photovoltaic Installation Market Volume (gigawatt) Forecast, by Application 2019 & 2032
- Table 171: Qatar Rooftop Solar Photovoltaic Installation Market Revenue (Million) Forecast, by Application 2019 & 2032
- Table 172: Qatar Rooftop Solar Photovoltaic Installation Market Volume (gigawatt) Forecast, by Application 2019 & 2032
- Table 173: South Africa Rooftop Solar Photovoltaic Installation Market Revenue (Million) Forecast, by Application 2019 & 2032
- Table 174: South Africa Rooftop Solar Photovoltaic Installation Market Volume (gigawatt) Forecast, by Application 2019 & 2032
- Table 175: Egypt Rooftop Solar Photovoltaic Installation Market Revenue (Million) Forecast, by Application 2019 & 2032
- Table 176: Egypt Rooftop Solar Photovoltaic Installation Market Volume (gigawatt) Forecast, by Application 2019 & 2032
- Table 177: Nigeria Rooftop Solar Photovoltaic Installation Market Revenue (Million) Forecast, by Application 2019 & 2032
- Table 178: Nigeria Rooftop Solar Photovoltaic Installation Market Volume (gigawatt) Forecast, by Application 2019 & 2032
- Table 179: Rest of Middle East and Africa Rooftop Solar Photovoltaic Installation Market Revenue (Million) Forecast, by Application 2019 & 2032
- Table 180: Rest of Middle East and Africa Rooftop Solar Photovoltaic Installation Market Volume (gigawatt) Forecast, by Application 2019 & 2032
Frequently Asked Questions
1. What is the projected Compound Annual Growth Rate (CAGR) of the Rooftop Solar Photovoltaic Installation Market?
The projected CAGR is approximately 8.04%.
2. Which companies are prominent players in the Rooftop Solar Photovoltaic Installation Market?
Key companies in the market include Pink Energy, Infinity Energy Inc *List Not Exhaustive 6 4 Market Ranking/Share Analysi, Baker Electric Home Energy, Momentum Solar, Semper Solaris Construction Inc, Canadian Solar Inc, Elemental Energy Inc, Titan Solar Power NV Inc, ADT Solar, ReVision Energy LLC.
3. What are the main segments of the Rooftop Solar Photovoltaic Installation Market?
The market segments include Location of Deployment.
4. Can you provide details about the market size?
The market size is estimated to be USD XX Million as of 2022.
5. What are some drivers contributing to market growth?
4.; Declining Solar Panel Costs4.; Supportive Government Policies.
6. What are the notable trends driving market growth?
Residential Rooftop Installation Expected to Dominate the Market.
7. Are there any restraints impacting market growth?
4.; High Upfront Cost.
8. Can you provide examples of recent developments in the market?
May 2022: The University at Albany and the New York Power Authority (NYPA) announced the operation of the most extensive rooftop solar array in the State University of New York. The 1.9MW of direct current (MWdc) solar project, constructed under NYPA, covers several rooftops on the campus and will bring long-term energy cost savings and sustainability benefits.
9. What pricing options are available for accessing the report?
Pricing options include single-user, multi-user, and enterprise licenses priced at USD 4750, USD 5250, and USD 8750 respectively.
10. Is the market size provided in terms of value or volume?
The market size is provided in terms of value, measured in Million and volume, measured in gigawatt.
11. Are there any specific market keywords associated with the report?
Yes, the market keyword associated with the report is "Rooftop Solar Photovoltaic Installation Market," which aids in identifying and referencing the specific market segment covered.
12. How do I determine which pricing option suits my needs best?
The pricing options vary based on user requirements and access needs. Individual users may opt for single-user licenses, while businesses requiring broader access may choose multi-user or enterprise licenses for cost-effective access to the report.
13. Are there any additional resources or data provided in the Rooftop Solar Photovoltaic Installation Market report?
While the report offers comprehensive insights, it's advisable to review the specific contents or supplementary materials provided to ascertain if additional resources or data are available.
14. How can I stay updated on further developments or reports in the Rooftop Solar Photovoltaic Installation Market?
To stay informed about further developments, trends, and reports in the Rooftop Solar Photovoltaic Installation Market, consider subscribing to industry newsletters, following relevant companies and organizations, or regularly checking reputable industry news sources and publications.
Methodology
Step 1 - Identification of Relevant Samples Size from Population Database


Step 2 - Approaches for Defining Global Market Size (Value, Volume* & Price*)

Note*: In applicable scenarios
Step 3 - Data Sources
Primary Research
- Web Analytics
- Survey Reports
- Research Institute
- Latest Research Reports
- Opinion Leaders
Secondary Research
- Annual Reports
- White Paper
- Latest Press Release
- Industry Association
- Paid Database
- Investor Presentations

Step 4 - Data Triangulation
Involves using different sources of information in order to increase the validity of a study
These sources are likely to be stakeholders in a program - participants, other researchers, program staff, other community members, and so on.
Then we put all data in single framework & apply various statistical tools to find out the dynamic on the market.
During the analysis stage, feedback from the stakeholder groups would be compared to determine areas of agreement as well as areas of divergence


