
Key Insights
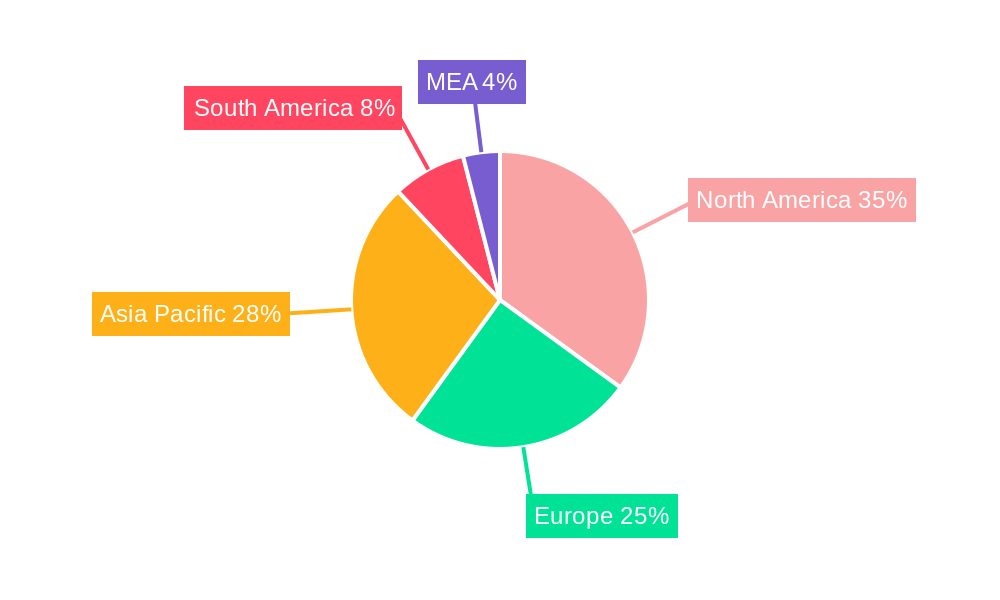
The global sand control systems market is experiencing robust growth, driven by increasing oil and gas exploration and production activities worldwide. A Compound Annual Growth Rate (CAGR) exceeding 4% from 2019-2033 signifies a consistently expanding market. This growth is fueled by several key factors. Firstly, the ongoing demand for energy necessitates enhanced oil and gas recovery techniques, making sand control systems vital for maximizing production from wells prone to sand influx. Secondly, technological advancements in sand control methods, particularly in active sand control solutions, are improving efficiency and reducing operational costs, further stimulating market expansion. The market is segmented by well type (open hole and cased hole), location (onshore and offshore), and sand control method (passive and active). While onshore operations currently dominate, the offshore segment is expected to witness significant growth due to increasing exploration and production activities in deepwater fields. Leading players such as Schlumberger, Halliburton, and Baker Hughes are actively investing in research and development to enhance their product portfolios and expand their market share. The geographical distribution reflects substantial growth across North America, driven by strong domestic production, and robust expansion in the Asia-Pacific region, fueled by increasing energy demands. Europe and the Middle East and Africa (MEA) also show significant potential for growth, driven by exploration and production activities.
Competition in the sand control systems market is intense, with several major players vying for market share. However, the market also offers opportunities for smaller companies specializing in niche technologies or geographical areas. The market is expected to see further consolidation as larger companies acquire smaller players to expand their technological capabilities and geographic reach. Challenges remain, including fluctuating oil and gas prices, stringent environmental regulations, and the complexity of deploying sand control systems in challenging environments. However, the long-term outlook for the sand control systems market remains positive, driven by the continuous need for efficient and reliable oil and gas production. The market is poised for continued expansion, benefiting from technological innovation and increasing global energy demand.
Sand Control Systems Industry: A Comprehensive Market Report (2019-2033)
This in-depth report provides a comprehensive analysis of the global Sand Control Systems industry, offering actionable insights for stakeholders across the value chain. The study covers the period from 2019 to 2033, with a focus on the forecast period (2025-2033) and a base year of 2025. The report meticulously examines market dynamics, competitive landscapes, technological advancements, and future growth potential, enabling informed strategic decision-making. The global market size in 2025 is estimated at $XX Million.
Sand Control Systems Industry Market Concentration & Innovation
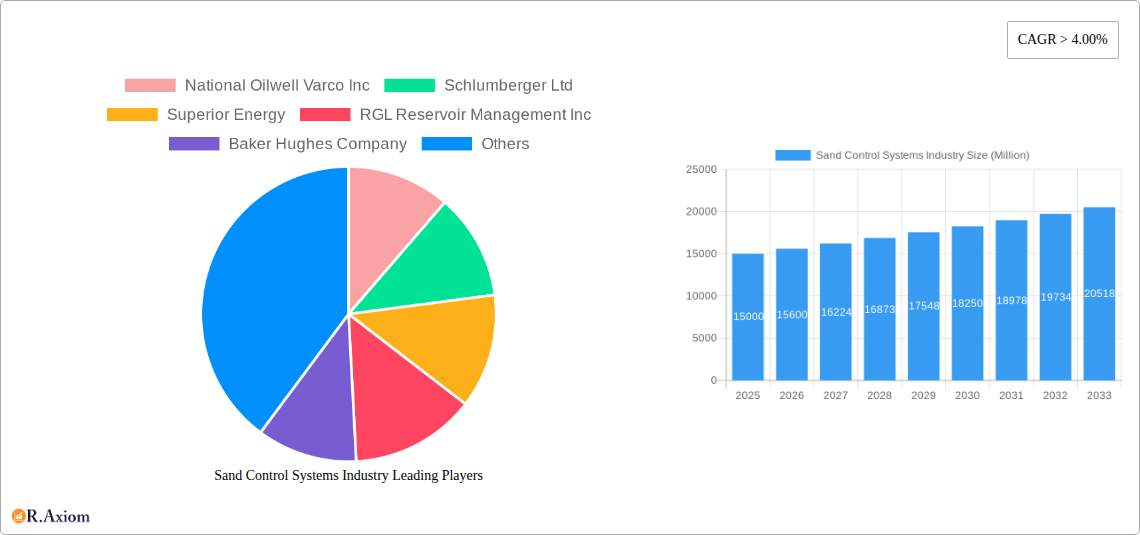
The Sand Control Systems market exhibits a moderately concentrated structure, with key players like National Oilwell Varco Inc, Schlumberger Ltd, Superior Energy, RGL Reservoir Management Inc, Baker Hughes Company, Halliburton Company, Welltec A/S, and Weatherford International Ltd holding significant market share. However, the presence of several smaller players and ongoing technological advancements fosters a dynamic competitive landscape. Market share data for 2025 estimates Schlumberger at approximately 25%, Halliburton at 20%, and National Oilwell Varco at 15%, with the remaining share distributed among other players.
Innovation is a crucial driver, fueled by the need for enhanced efficiency, reduced operational costs, and improved sand control effectiveness in challenging reservoir conditions. Regulatory frameworks, particularly concerning environmental protection and safety, significantly influence technology adoption and product development. The market witnesses continuous innovation in materials science, automation, and data analytics. Substitute technologies, while limited, pose a competitive threat, particularly in specific niche applications. End-user trends towards sustainable and environmentally friendly solutions are shaping product development strategies.
Mergers and acquisitions (M&A) activities have played a significant role in shaping market dynamics. In the period 2019-2024, M&A deal values totalled approximately $XX Million, largely driven by strategic consolidations and technology acquisitions. These activities are expected to continue, driven by the pursuit of economies of scale and technological advancements.
Sand Control Systems Industry Industry Trends & Insights
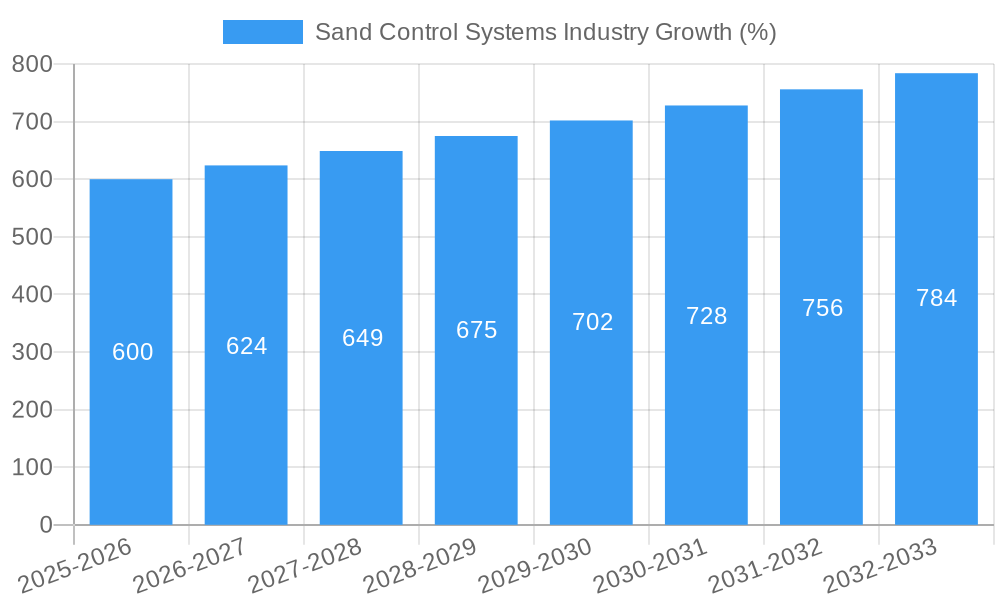
The Sand Control Systems market is projected to experience a Compound Annual Growth Rate (CAGR) of XX% during the forecast period (2025-2033). This growth is primarily driven by the increasing demand for oil and gas globally, coupled with the growing need for effective sand control solutions in challenging reservoir environments. Technological disruptions, including the adoption of advanced materials, automation, and data-driven optimization, are further propelling market growth. The market penetration of advanced sand control techniques is steadily increasing, particularly in offshore and deepwater applications where sand production poses significant operational challenges. Consumer preferences are shifting towards solutions that offer superior performance, improved longevity, and reduced environmental impact. Competitive dynamics are characterized by intense rivalry among established players and the emergence of innovative startups. The market is witnessing a gradual shift from traditional passive methods towards advanced active sand control technologies, driven by their superior performance and efficiency. The development of smart sand control systems integrated with digital technologies is also gaining traction.
Dominant Markets & Segments in Sand Control Systems Industry
The offshore segment holds the largest market share within the Sand Control Systems market due to the high concentration of oil and gas reserves in offshore fields and the greater challenges associated with sand production in these locations. The Middle East and North America represent the dominant geographical markets, fueled by robust oil and gas production activities and substantial investments in infrastructure.
- Key Drivers for Offshore Dominance: Higher sand production rates, complex reservoir conditions, and stringent regulatory requirements necessitate advanced sand control solutions.
- Key Drivers for Middle East & North America Dominance: Large-scale oil and gas production, significant investments in exploration and production activities, and favorable regulatory environment.
Within the well type segment, the cased hole segment dominates due to the prevalence of cased hole completions in oil and gas wells. Active sand control methods are gaining traction due to their superior performance compared to passive methods. However, passive sand control continues to maintain a considerable share driven by its lower cost and simplicity in certain applications.
- Key Drivers for Cased Hole Dominance: Higher prevalence of cased hole completions, and improved adaptability of sand control technologies within the existing infrastructure.
- Key Drivers for Active Sand Control Dominance: Superior performance in controlling sand production and enhanced longevity.
Sand Control Systems Industry Product Developments
Recent product innovations include the development of high-strength, corrosion-resistant materials for sand control screens, advanced gravel packing techniques for improved efficiency, and smart sand control systems with integrated sensors and data analytics capabilities. These innovations are designed to enhance sand control effectiveness, reduce operational costs, and improve well productivity. The market is also witnessing the emergence of specialized sand control solutions tailored to specific reservoir conditions and well architectures. This focus on tailoring solutions to specific needs enhances performance and cost-effectiveness.
Report Scope & Segmentation Analysis
This report segments the Sand Control Systems market based on well type (open hole, cased hole), location of deployment (onshore, offshore), and sand control method (passive, active). Each segment's growth projections, market sizes, and competitive dynamics are thoroughly analyzed. The open hole segment is expected to witness a CAGR of XX% driven by applications in certain unconventional resource extraction. The onshore segment holds a larger market share than offshore due to the greater number of onshore wells, however, offshore is projected to have a higher CAGR. Passive sand control is expected to show stable growth, whereas active sand control will exhibit significantly higher growth due to technological advancements.
Key Drivers of Sand Control Systems Industry Growth
The growth of the Sand Control Systems industry is driven by several factors: the increasing demand for oil and gas, particularly in challenging reservoir environments, the need for enhanced well productivity and efficiency, stricter environmental regulations promoting sustainable practices, and continuous technological advancements in sand control technologies. Government support for oil & gas extraction, especially in high-production regions, also contributes significantly.
Challenges in the Sand Control Systems Industry Sector
Challenges include the high upfront capital costs associated with implementing advanced sand control solutions, the complexity of integrating new technologies into existing well architectures, the potential for equipment failure and operational disruptions, and the need for specialized expertise and skilled labor. Fluctuations in oil and gas prices and global supply chain disruptions further add to these challenges. These factors collectively can reduce the overall profitability and attractiveness of investments in sand control technologies.
Emerging Opportunities in Sand Control Systems Industry
Emerging opportunities include the growing adoption of smart sand control systems integrated with digital technologies for enhanced monitoring and optimization, the development of advanced materials and techniques for improved sand control performance, and the expansion into new markets such as unconventional resources and geothermal energy applications. The increasing focus on sustainability is also creating opportunities for eco-friendly sand control solutions.
Leading Players in the Sand Control Systems Industry Market
- National Oilwell Varco Inc
- Schlumberger Ltd
- Superior Energy
- RGL Reservoir Management Inc
- Baker Hughes Company
- Halliburton Company
- Welltec A/S
- Weatherford International Ltd
Key Developments in Sand Control Systems Industry Industry
- January 2023: Schlumberger launched a new generation of smart sand control system.
- June 2022: Baker Hughes acquired a smaller sand control technology company, expanding its product portfolio.
- October 2021: Halliburton announced a significant investment in R&D for advanced sand control materials.
- (Further details on specific developments with dates and impact will be included in the full report)
Strategic Outlook for Sand Control Systems Industry Market
The Sand Control Systems market is poised for substantial growth over the forecast period, driven by technological advancements, increasing demand for oil and gas, and favorable regulatory environment in key regions. Companies focusing on innovation, strategic partnerships, and expansion into new markets will be well-positioned to capitalize on future growth opportunities. The adoption of sustainable and environmentally friendly technologies will play a key role in shaping the future of the industry.
Sand Control Systems Industry Segmentation
-
1. Well Type
- 1.1. Open Hole
- 1.2. Cased Hole
-
2. Location of Deployment
- 2.1. Onshore
- 2.2. Offshore
-
3. Sand Control Method
- 3.1. Passive Sand Control (Non-intrusive Measures)
-
3.2. Active Sand Control (Intrusive Measures)
- 3.2.1. Resin Injection
- 3.2.2. Gravel Pack
- 3.2.3. Slotted Liners
- 3.2.4. Frack Pack
- 3.2.5. Other Methods
Sand Control Systems Industry Segmentation By Geography
- 1. North America
- 2. Europe
- 3. Asia Pacific
- 4. South America
- 5. Middle East and Africa
Sand Control Systems Industry REPORT HIGHLIGHTS
| Aspects | Details |
|---|---|
| Study Period | 2019-2033 |
| Base Year | 2024 |
| Estimated Year | 2025 |
| Forecast Period | 2025-2033 |
| Historical Period | 2019-2024 |
| Growth Rate | CAGR of > 4.00% from 2019-2033 |
| Segmentation |
|
Table of Contents
- 1. Introduction
- 1.1. Research Scope
- 1.2. Market Segmentation
- 1.3. Research Methodology
- 1.4. Definitions and Assumptions
- 2. Executive Summary
- 2.1. Introduction
- 3. Market Dynamics
- 3.1. Introduction
- 3.2. Market Drivers
- 3.2.1. 4.; The Rise in Oil and Gas Drilling Activities4.; Increased Shale Gas Exploration
- 3.3. Market Restrains
- 3.3.1. 4.; Increasing Share of Renewable Energy
- 3.4. Market Trends
- 3.4.1. Offshore Segment to Dominate the Market
- 4. Market Factor Analysis
- 4.1. Porters Five Forces
- 4.2. Supply/Value Chain
- 4.3. PESTEL analysis
- 4.4. Market Entropy
- 4.5. Patent/Trademark Analysis
- 5. Global Sand Control Systems Industry Analysis, Insights and Forecast, 2019-2031
- 5.1. Market Analysis, Insights and Forecast - by Well Type
- 5.1.1. Open Hole
- 5.1.2. Cased Hole
- 5.2. Market Analysis, Insights and Forecast - by Location of Deployment
- 5.2.1. Onshore
- 5.2.2. Offshore
- 5.3. Market Analysis, Insights and Forecast - by Sand Control Method
- 5.3.1. Passive Sand Control (Non-intrusive Measures)
- 5.3.2. Active Sand Control (Intrusive Measures)
- 5.3.2.1. Resin Injection
- 5.3.2.2. Gravel Pack
- 5.3.2.3. Slotted Liners
- 5.3.2.4. Frack Pack
- 5.3.2.5. Other Methods
- 5.4. Market Analysis, Insights and Forecast - by Region
- 5.4.1. North America
- 5.4.2. Europe
- 5.4.3. Asia Pacific
- 5.4.4. South America
- 5.4.5. Middle East and Africa
- 5.1. Market Analysis, Insights and Forecast - by Well Type
- 6. North America Sand Control Systems Industry Analysis, Insights and Forecast, 2019-2031
- 6.1. Market Analysis, Insights and Forecast - by Well Type
- 6.1.1. Open Hole
- 6.1.2. Cased Hole
- 6.2. Market Analysis, Insights and Forecast - by Location of Deployment
- 6.2.1. Onshore
- 6.2.2. Offshore
- 6.3. Market Analysis, Insights and Forecast - by Sand Control Method
- 6.3.1. Passive Sand Control (Non-intrusive Measures)
- 6.3.2. Active Sand Control (Intrusive Measures)
- 6.3.2.1. Resin Injection
- 6.3.2.2. Gravel Pack
- 6.3.2.3. Slotted Liners
- 6.3.2.4. Frack Pack
- 6.3.2.5. Other Methods
- 6.1. Market Analysis, Insights and Forecast - by Well Type
- 7. Europe Sand Control Systems Industry Analysis, Insights and Forecast, 2019-2031
- 7.1. Market Analysis, Insights and Forecast - by Well Type
- 7.1.1. Open Hole
- 7.1.2. Cased Hole
- 7.2. Market Analysis, Insights and Forecast - by Location of Deployment
- 7.2.1. Onshore
- 7.2.2. Offshore
- 7.3. Market Analysis, Insights and Forecast - by Sand Control Method
- 7.3.1. Passive Sand Control (Non-intrusive Measures)
- 7.3.2. Active Sand Control (Intrusive Measures)
- 7.3.2.1. Resin Injection
- 7.3.2.2. Gravel Pack
- 7.3.2.3. Slotted Liners
- 7.3.2.4. Frack Pack
- 7.3.2.5. Other Methods
- 7.1. Market Analysis, Insights and Forecast - by Well Type
- 8. Asia Pacific Sand Control Systems Industry Analysis, Insights and Forecast, 2019-2031
- 8.1. Market Analysis, Insights and Forecast - by Well Type
- 8.1.1. Open Hole
- 8.1.2. Cased Hole
- 8.2. Market Analysis, Insights and Forecast - by Location of Deployment
- 8.2.1. Onshore
- 8.2.2. Offshore
- 8.3. Market Analysis, Insights and Forecast - by Sand Control Method
- 8.3.1. Passive Sand Control (Non-intrusive Measures)
- 8.3.2. Active Sand Control (Intrusive Measures)
- 8.3.2.1. Resin Injection
- 8.3.2.2. Gravel Pack
- 8.3.2.3. Slotted Liners
- 8.3.2.4. Frack Pack
- 8.3.2.5. Other Methods
- 8.1. Market Analysis, Insights and Forecast - by Well Type
- 9. South America Sand Control Systems Industry Analysis, Insights and Forecast, 2019-2031
- 9.1. Market Analysis, Insights and Forecast - by Well Type
- 9.1.1. Open Hole
- 9.1.2. Cased Hole
- 9.2. Market Analysis, Insights and Forecast - by Location of Deployment
- 9.2.1. Onshore
- 9.2.2. Offshore
- 9.3. Market Analysis, Insights and Forecast - by Sand Control Method
- 9.3.1. Passive Sand Control (Non-intrusive Measures)
- 9.3.2. Active Sand Control (Intrusive Measures)
- 9.3.2.1. Resin Injection
- 9.3.2.2. Gravel Pack
- 9.3.2.3. Slotted Liners
- 9.3.2.4. Frack Pack
- 9.3.2.5. Other Methods
- 9.1. Market Analysis, Insights and Forecast - by Well Type
- 10. Middle East and Africa Sand Control Systems Industry Analysis, Insights and Forecast, 2019-2031
- 10.1. Market Analysis, Insights and Forecast - by Well Type
- 10.1.1. Open Hole
- 10.1.2. Cased Hole
- 10.2. Market Analysis, Insights and Forecast - by Location of Deployment
- 10.2.1. Onshore
- 10.2.2. Offshore
- 10.3. Market Analysis, Insights and Forecast - by Sand Control Method
- 10.3.1. Passive Sand Control (Non-intrusive Measures)
- 10.3.2. Active Sand Control (Intrusive Measures)
- 10.3.2.1. Resin Injection
- 10.3.2.2. Gravel Pack
- 10.3.2.3. Slotted Liners
- 10.3.2.4. Frack Pack
- 10.3.2.5. Other Methods
- 10.1. Market Analysis, Insights and Forecast - by Well Type
- 11. North America Sand Control Systems Industry Analysis, Insights and Forecast, 2019-2031
- 11.1. Market Analysis, Insights and Forecast - By Country/Sub-region
- 11.1.1 United States
- 11.1.2 Canada
- 11.1.3 Mexico
- 12. Europe Sand Control Systems Industry Analysis, Insights and Forecast, 2019-2031
- 12.1. Market Analysis, Insights and Forecast - By Country/Sub-region
- 12.1.1 Germany
- 12.1.2 United Kingdom
- 12.1.3 France
- 12.1.4 Spain
- 12.1.5 Italy
- 12.1.6 Spain
- 12.1.7 Belgium
- 12.1.8 Netherland
- 12.1.9 Nordics
- 12.1.10 Rest of Europe
- 13. Asia Pacific Sand Control Systems Industry Analysis, Insights and Forecast, 2019-2031
- 13.1. Market Analysis, Insights and Forecast - By Country/Sub-region
- 13.1.1 China
- 13.1.2 Japan
- 13.1.3 India
- 13.1.4 South Korea
- 13.1.5 Southeast Asia
- 13.1.6 Australia
- 13.1.7 Indonesia
- 13.1.8 Phillipes
- 13.1.9 Singapore
- 13.1.10 Thailandc
- 13.1.11 Rest of Asia Pacific
- 14. South America Sand Control Systems Industry Analysis, Insights and Forecast, 2019-2031
- 14.1. Market Analysis, Insights and Forecast - By Country/Sub-region
- 14.1.1 Brazil
- 14.1.2 Argentina
- 14.1.3 Peru
- 14.1.4 Chile
- 14.1.5 Colombia
- 14.1.6 Ecuador
- 14.1.7 Venezuela
- 14.1.8 Rest of South America
- 15. North America Sand Control Systems Industry Analysis, Insights and Forecast, 2019-2031
- 15.1. Market Analysis, Insights and Forecast - By Country/Sub-region
- 15.1.1 United States
- 15.1.2 Canada
- 15.1.3 Mexico
- 16. MEA Sand Control Systems Industry Analysis, Insights and Forecast, 2019-2031
- 16.1. Market Analysis, Insights and Forecast - By Country/Sub-region
- 16.1.1 United Arab Emirates
- 16.1.2 Saudi Arabia
- 16.1.3 South Africa
- 16.1.4 Rest of Middle East and Africa
- 17. Competitive Analysis
- 17.1. Global Market Share Analysis 2024
- 17.2. Company Profiles
- 17.2.1 National Oilwell Varco Inc
- 17.2.1.1. Overview
- 17.2.1.2. Products
- 17.2.1.3. SWOT Analysis
- 17.2.1.4. Recent Developments
- 17.2.1.5. Financials (Based on Availability)
- 17.2.2 Schlumberger Ltd
- 17.2.2.1. Overview
- 17.2.2.2. Products
- 17.2.2.3. SWOT Analysis
- 17.2.2.4. Recent Developments
- 17.2.2.5. Financials (Based on Availability)
- 17.2.3 Superior Energy
- 17.2.3.1. Overview
- 17.2.3.2. Products
- 17.2.3.3. SWOT Analysis
- 17.2.3.4. Recent Developments
- 17.2.3.5. Financials (Based on Availability)
- 17.2.4 RGL Reservoir Management Inc
- 17.2.4.1. Overview
- 17.2.4.2. Products
- 17.2.4.3. SWOT Analysis
- 17.2.4.4. Recent Developments
- 17.2.4.5. Financials (Based on Availability)
- 17.2.5 Baker Hughes Company
- 17.2.5.1. Overview
- 17.2.5.2. Products
- 17.2.5.3. SWOT Analysis
- 17.2.5.4. Recent Developments
- 17.2.5.5. Financials (Based on Availability)
- 17.2.6 Halliburton Company
- 17.2.6.1. Overview
- 17.2.6.2. Products
- 17.2.6.3. SWOT Analysis
- 17.2.6.4. Recent Developments
- 17.2.6.5. Financials (Based on Availability)
- 17.2.7 Welltec A/S*List Not Exhaustive
- 17.2.7.1. Overview
- 17.2.7.2. Products
- 17.2.7.3. SWOT Analysis
- 17.2.7.4. Recent Developments
- 17.2.7.5. Financials (Based on Availability)
- 17.2.8 Weatherford International Ltd
- 17.2.8.1. Overview
- 17.2.8.2. Products
- 17.2.8.3. SWOT Analysis
- 17.2.8.4. Recent Developments
- 17.2.8.5. Financials (Based on Availability)
- 17.2.1 National Oilwell Varco Inc
List of Figures
- Figure 1: Global Sand Control Systems Industry Revenue Breakdown (Million, %) by Region 2024 & 2032
- Figure 2: Global Sand Control Systems Industry Volume Breakdown (K Unit, %) by Region 2024 & 2032
- Figure 3: North America Sand Control Systems Industry Revenue (Million), by Country 2024 & 2032
- Figure 4: North America Sand Control Systems Industry Volume (K Unit), by Country 2024 & 2032
- Figure 5: North America Sand Control Systems Industry Revenue Share (%), by Country 2024 & 2032
- Figure 6: North America Sand Control Systems Industry Volume Share (%), by Country 2024 & 2032
- Figure 7: Europe Sand Control Systems Industry Revenue (Million), by Country 2024 & 2032
- Figure 8: Europe Sand Control Systems Industry Volume (K Unit), by Country 2024 & 2032
- Figure 9: Europe Sand Control Systems Industry Revenue Share (%), by Country 2024 & 2032
- Figure 10: Europe Sand Control Systems Industry Volume Share (%), by Country 2024 & 2032
- Figure 11: Asia Pacific Sand Control Systems Industry Revenue (Million), by Country 2024 & 2032
- Figure 12: Asia Pacific Sand Control Systems Industry Volume (K Unit), by Country 2024 & 2032
- Figure 13: Asia Pacific Sand Control Systems Industry Revenue Share (%), by Country 2024 & 2032
- Figure 14: Asia Pacific Sand Control Systems Industry Volume Share (%), by Country 2024 & 2032
- Figure 15: South America Sand Control Systems Industry Revenue (Million), by Country 2024 & 2032
- Figure 16: South America Sand Control Systems Industry Volume (K Unit), by Country 2024 & 2032
- Figure 17: South America Sand Control Systems Industry Revenue Share (%), by Country 2024 & 2032
- Figure 18: South America Sand Control Systems Industry Volume Share (%), by Country 2024 & 2032
- Figure 19: North America Sand Control Systems Industry Revenue (Million), by Country 2024 & 2032
- Figure 20: North America Sand Control Systems Industry Volume (K Unit), by Country 2024 & 2032
- Figure 21: North America Sand Control Systems Industry Revenue Share (%), by Country 2024 & 2032
- Figure 22: North America Sand Control Systems Industry Volume Share (%), by Country 2024 & 2032
- Figure 23: MEA Sand Control Systems Industry Revenue (Million), by Country 2024 & 2032
- Figure 24: MEA Sand Control Systems Industry Volume (K Unit), by Country 2024 & 2032
- Figure 25: MEA Sand Control Systems Industry Revenue Share (%), by Country 2024 & 2032
- Figure 26: MEA Sand Control Systems Industry Volume Share (%), by Country 2024 & 2032
- Figure 27: North America Sand Control Systems Industry Revenue (Million), by Well Type 2024 & 2032
- Figure 28: North America Sand Control Systems Industry Volume (K Unit), by Well Type 2024 & 2032
- Figure 29: North America Sand Control Systems Industry Revenue Share (%), by Well Type 2024 & 2032
- Figure 30: North America Sand Control Systems Industry Volume Share (%), by Well Type 2024 & 2032
- Figure 31: North America Sand Control Systems Industry Revenue (Million), by Location of Deployment 2024 & 2032
- Figure 32: North America Sand Control Systems Industry Volume (K Unit), by Location of Deployment 2024 & 2032
- Figure 33: North America Sand Control Systems Industry Revenue Share (%), by Location of Deployment 2024 & 2032
- Figure 34: North America Sand Control Systems Industry Volume Share (%), by Location of Deployment 2024 & 2032
- Figure 35: North America Sand Control Systems Industry Revenue (Million), by Sand Control Method 2024 & 2032
- Figure 36: North America Sand Control Systems Industry Volume (K Unit), by Sand Control Method 2024 & 2032
- Figure 37: North America Sand Control Systems Industry Revenue Share (%), by Sand Control Method 2024 & 2032
- Figure 38: North America Sand Control Systems Industry Volume Share (%), by Sand Control Method 2024 & 2032
- Figure 39: North America Sand Control Systems Industry Revenue (Million), by Country 2024 & 2032
- Figure 40: North America Sand Control Systems Industry Volume (K Unit), by Country 2024 & 2032
- Figure 41: North America Sand Control Systems Industry Revenue Share (%), by Country 2024 & 2032
- Figure 42: North America Sand Control Systems Industry Volume Share (%), by Country 2024 & 2032
- Figure 43: Europe Sand Control Systems Industry Revenue (Million), by Well Type 2024 & 2032
- Figure 44: Europe Sand Control Systems Industry Volume (K Unit), by Well Type 2024 & 2032
- Figure 45: Europe Sand Control Systems Industry Revenue Share (%), by Well Type 2024 & 2032
- Figure 46: Europe Sand Control Systems Industry Volume Share (%), by Well Type 2024 & 2032
- Figure 47: Europe Sand Control Systems Industry Revenue (Million), by Location of Deployment 2024 & 2032
- Figure 48: Europe Sand Control Systems Industry Volume (K Unit), by Location of Deployment 2024 & 2032
- Figure 49: Europe Sand Control Systems Industry Revenue Share (%), by Location of Deployment 2024 & 2032
- Figure 50: Europe Sand Control Systems Industry Volume Share (%), by Location of Deployment 2024 & 2032
- Figure 51: Europe Sand Control Systems Industry Revenue (Million), by Sand Control Method 2024 & 2032
- Figure 52: Europe Sand Control Systems Industry Volume (K Unit), by Sand Control Method 2024 & 2032
- Figure 53: Europe Sand Control Systems Industry Revenue Share (%), by Sand Control Method 2024 & 2032
- Figure 54: Europe Sand Control Systems Industry Volume Share (%), by Sand Control Method 2024 & 2032
- Figure 55: Europe Sand Control Systems Industry Revenue (Million), by Country 2024 & 2032
- Figure 56: Europe Sand Control Systems Industry Volume (K Unit), by Country 2024 & 2032
- Figure 57: Europe Sand Control Systems Industry Revenue Share (%), by Country 2024 & 2032
- Figure 58: Europe Sand Control Systems Industry Volume Share (%), by Country 2024 & 2032
- Figure 59: Asia Pacific Sand Control Systems Industry Revenue (Million), by Well Type 2024 & 2032
- Figure 60: Asia Pacific Sand Control Systems Industry Volume (K Unit), by Well Type 2024 & 2032
- Figure 61: Asia Pacific Sand Control Systems Industry Revenue Share (%), by Well Type 2024 & 2032
- Figure 62: Asia Pacific Sand Control Systems Industry Volume Share (%), by Well Type 2024 & 2032
- Figure 63: Asia Pacific Sand Control Systems Industry Revenue (Million), by Location of Deployment 2024 & 2032
- Figure 64: Asia Pacific Sand Control Systems Industry Volume (K Unit), by Location of Deployment 2024 & 2032
- Figure 65: Asia Pacific Sand Control Systems Industry Revenue Share (%), by Location of Deployment 2024 & 2032
- Figure 66: Asia Pacific Sand Control Systems Industry Volume Share (%), by Location of Deployment 2024 & 2032
- Figure 67: Asia Pacific Sand Control Systems Industry Revenue (Million), by Sand Control Method 2024 & 2032
- Figure 68: Asia Pacific Sand Control Systems Industry Volume (K Unit), by Sand Control Method 2024 & 2032
- Figure 69: Asia Pacific Sand Control Systems Industry Revenue Share (%), by Sand Control Method 2024 & 2032
- Figure 70: Asia Pacific Sand Control Systems Industry Volume Share (%), by Sand Control Method 2024 & 2032
- Figure 71: Asia Pacific Sand Control Systems Industry Revenue (Million), by Country 2024 & 2032
- Figure 72: Asia Pacific Sand Control Systems Industry Volume (K Unit), by Country 2024 & 2032
- Figure 73: Asia Pacific Sand Control Systems Industry Revenue Share (%), by Country 2024 & 2032
- Figure 74: Asia Pacific Sand Control Systems Industry Volume Share (%), by Country 2024 & 2032
- Figure 75: South America Sand Control Systems Industry Revenue (Million), by Well Type 2024 & 2032
- Figure 76: South America Sand Control Systems Industry Volume (K Unit), by Well Type 2024 & 2032
- Figure 77: South America Sand Control Systems Industry Revenue Share (%), by Well Type 2024 & 2032
- Figure 78: South America Sand Control Systems Industry Volume Share (%), by Well Type 2024 & 2032
- Figure 79: South America Sand Control Systems Industry Revenue (Million), by Location of Deployment 2024 & 2032
- Figure 80: South America Sand Control Systems Industry Volume (K Unit), by Location of Deployment 2024 & 2032
- Figure 81: South America Sand Control Systems Industry Revenue Share (%), by Location of Deployment 2024 & 2032
- Figure 82: South America Sand Control Systems Industry Volume Share (%), by Location of Deployment 2024 & 2032
- Figure 83: South America Sand Control Systems Industry Revenue (Million), by Sand Control Method 2024 & 2032
- Figure 84: South America Sand Control Systems Industry Volume (K Unit), by Sand Control Method 2024 & 2032
- Figure 85: South America Sand Control Systems Industry Revenue Share (%), by Sand Control Method 2024 & 2032
- Figure 86: South America Sand Control Systems Industry Volume Share (%), by Sand Control Method 2024 & 2032
- Figure 87: South America Sand Control Systems Industry Revenue (Million), by Country 2024 & 2032
- Figure 88: South America Sand Control Systems Industry Volume (K Unit), by Country 2024 & 2032
- Figure 89: South America Sand Control Systems Industry Revenue Share (%), by Country 2024 & 2032
- Figure 90: South America Sand Control Systems Industry Volume Share (%), by Country 2024 & 2032
- Figure 91: Middle East and Africa Sand Control Systems Industry Revenue (Million), by Well Type 2024 & 2032
- Figure 92: Middle East and Africa Sand Control Systems Industry Volume (K Unit), by Well Type 2024 & 2032
- Figure 93: Middle East and Africa Sand Control Systems Industry Revenue Share (%), by Well Type 2024 & 2032
- Figure 94: Middle East and Africa Sand Control Systems Industry Volume Share (%), by Well Type 2024 & 2032
- Figure 95: Middle East and Africa Sand Control Systems Industry Revenue (Million), by Location of Deployment 2024 & 2032
- Figure 96: Middle East and Africa Sand Control Systems Industry Volume (K Unit), by Location of Deployment 2024 & 2032
- Figure 97: Middle East and Africa Sand Control Systems Industry Revenue Share (%), by Location of Deployment 2024 & 2032
- Figure 98: Middle East and Africa Sand Control Systems Industry Volume Share (%), by Location of Deployment 2024 & 2032
- Figure 99: Middle East and Africa Sand Control Systems Industry Revenue (Million), by Sand Control Method 2024 & 2032
- Figure 100: Middle East and Africa Sand Control Systems Industry Volume (K Unit), by Sand Control Method 2024 & 2032
- Figure 101: Middle East and Africa Sand Control Systems Industry Revenue Share (%), by Sand Control Method 2024 & 2032
- Figure 102: Middle East and Africa Sand Control Systems Industry Volume Share (%), by Sand Control Method 2024 & 2032
- Figure 103: Middle East and Africa Sand Control Systems Industry Revenue (Million), by Country 2024 & 2032
- Figure 104: Middle East and Africa Sand Control Systems Industry Volume (K Unit), by Country 2024 & 2032
- Figure 105: Middle East and Africa Sand Control Systems Industry Revenue Share (%), by Country 2024 & 2032
- Figure 106: Middle East and Africa Sand Control Systems Industry Volume Share (%), by Country 2024 & 2032
List of Tables
- Table 1: Global Sand Control Systems Industry Revenue Million Forecast, by Region 2019 & 2032
- Table 2: Global Sand Control Systems Industry Volume K Unit Forecast, by Region 2019 & 2032
- Table 3: Global Sand Control Systems Industry Revenue Million Forecast, by Well Type 2019 & 2032
- Table 4: Global Sand Control Systems Industry Volume K Unit Forecast, by Well Type 2019 & 2032
- Table 5: Global Sand Control Systems Industry Revenue Million Forecast, by Location of Deployment 2019 & 2032
- Table 6: Global Sand Control Systems Industry Volume K Unit Forecast, by Location of Deployment 2019 & 2032
- Table 7: Global Sand Control Systems Industry Revenue Million Forecast, by Sand Control Method 2019 & 2032
- Table 8: Global Sand Control Systems Industry Volume K Unit Forecast, by Sand Control Method 2019 & 2032
- Table 9: Global Sand Control Systems Industry Revenue Million Forecast, by Region 2019 & 2032
- Table 10: Global Sand Control Systems Industry Volume K Unit Forecast, by Region 2019 & 2032
- Table 11: Global Sand Control Systems Industry Revenue Million Forecast, by Country 2019 & 2032
- Table 12: Global Sand Control Systems Industry Volume K Unit Forecast, by Country 2019 & 2032
- Table 13: United States Sand Control Systems Industry Revenue (Million) Forecast, by Application 2019 & 2032
- Table 14: United States Sand Control Systems Industry Volume (K Unit) Forecast, by Application 2019 & 2032
- Table 15: Canada Sand Control Systems Industry Revenue (Million) Forecast, by Application 2019 & 2032
- Table 16: Canada Sand Control Systems Industry Volume (K Unit) Forecast, by Application 2019 & 2032
- Table 17: Mexico Sand Control Systems Industry Revenue (Million) Forecast, by Application 2019 & 2032
- Table 18: Mexico Sand Control Systems Industry Volume (K Unit) Forecast, by Application 2019 & 2032
- Table 19: Global Sand Control Systems Industry Revenue Million Forecast, by Country 2019 & 2032
- Table 20: Global Sand Control Systems Industry Volume K Unit Forecast, by Country 2019 & 2032
- Table 21: Germany Sand Control Systems Industry Revenue (Million) Forecast, by Application 2019 & 2032
- Table 22: Germany Sand Control Systems Industry Volume (K Unit) Forecast, by Application 2019 & 2032
- Table 23: United Kingdom Sand Control Systems Industry Revenue (Million) Forecast, by Application 2019 & 2032
- Table 24: United Kingdom Sand Control Systems Industry Volume (K Unit) Forecast, by Application 2019 & 2032
- Table 25: France Sand Control Systems Industry Revenue (Million) Forecast, by Application 2019 & 2032
- Table 26: France Sand Control Systems Industry Volume (K Unit) Forecast, by Application 2019 & 2032
- Table 27: Spain Sand Control Systems Industry Revenue (Million) Forecast, by Application 2019 & 2032
- Table 28: Spain Sand Control Systems Industry Volume (K Unit) Forecast, by Application 2019 & 2032
- Table 29: Italy Sand Control Systems Industry Revenue (Million) Forecast, by Application 2019 & 2032
- Table 30: Italy Sand Control Systems Industry Volume (K Unit) Forecast, by Application 2019 & 2032
- Table 31: Spain Sand Control Systems Industry Revenue (Million) Forecast, by Application 2019 & 2032
- Table 32: Spain Sand Control Systems Industry Volume (K Unit) Forecast, by Application 2019 & 2032
- Table 33: Belgium Sand Control Systems Industry Revenue (Million) Forecast, by Application 2019 & 2032
- Table 34: Belgium Sand Control Systems Industry Volume (K Unit) Forecast, by Application 2019 & 2032
- Table 35: Netherland Sand Control Systems Industry Revenue (Million) Forecast, by Application 2019 & 2032
- Table 36: Netherland Sand Control Systems Industry Volume (K Unit) Forecast, by Application 2019 & 2032
- Table 37: Nordics Sand Control Systems Industry Revenue (Million) Forecast, by Application 2019 & 2032
- Table 38: Nordics Sand Control Systems Industry Volume (K Unit) Forecast, by Application 2019 & 2032
- Table 39: Rest of Europe Sand Control Systems Industry Revenue (Million) Forecast, by Application 2019 & 2032
- Table 40: Rest of Europe Sand Control Systems Industry Volume (K Unit) Forecast, by Application 2019 & 2032
- Table 41: Global Sand Control Systems Industry Revenue Million Forecast, by Country 2019 & 2032
- Table 42: Global Sand Control Systems Industry Volume K Unit Forecast, by Country 2019 & 2032
- Table 43: China Sand Control Systems Industry Revenue (Million) Forecast, by Application 2019 & 2032
- Table 44: China Sand Control Systems Industry Volume (K Unit) Forecast, by Application 2019 & 2032
- Table 45: Japan Sand Control Systems Industry Revenue (Million) Forecast, by Application 2019 & 2032
- Table 46: Japan Sand Control Systems Industry Volume (K Unit) Forecast, by Application 2019 & 2032
- Table 47: India Sand Control Systems Industry Revenue (Million) Forecast, by Application 2019 & 2032
- Table 48: India Sand Control Systems Industry Volume (K Unit) Forecast, by Application 2019 & 2032
- Table 49: South Korea Sand Control Systems Industry Revenue (Million) Forecast, by Application 2019 & 2032
- Table 50: South Korea Sand Control Systems Industry Volume (K Unit) Forecast, by Application 2019 & 2032
- Table 51: Southeast Asia Sand Control Systems Industry Revenue (Million) Forecast, by Application 2019 & 2032
- Table 52: Southeast Asia Sand Control Systems Industry Volume (K Unit) Forecast, by Application 2019 & 2032
- Table 53: Australia Sand Control Systems Industry Revenue (Million) Forecast, by Application 2019 & 2032
- Table 54: Australia Sand Control Systems Industry Volume (K Unit) Forecast, by Application 2019 & 2032
- Table 55: Indonesia Sand Control Systems Industry Revenue (Million) Forecast, by Application 2019 & 2032
- Table 56: Indonesia Sand Control Systems Industry Volume (K Unit) Forecast, by Application 2019 & 2032
- Table 57: Phillipes Sand Control Systems Industry Revenue (Million) Forecast, by Application 2019 & 2032
- Table 58: Phillipes Sand Control Systems Industry Volume (K Unit) Forecast, by Application 2019 & 2032
- Table 59: Singapore Sand Control Systems Industry Revenue (Million) Forecast, by Application 2019 & 2032
- Table 60: Singapore Sand Control Systems Industry Volume (K Unit) Forecast, by Application 2019 & 2032
- Table 61: Thailandc Sand Control Systems Industry Revenue (Million) Forecast, by Application 2019 & 2032
- Table 62: Thailandc Sand Control Systems Industry Volume (K Unit) Forecast, by Application 2019 & 2032
- Table 63: Rest of Asia Pacific Sand Control Systems Industry Revenue (Million) Forecast, by Application 2019 & 2032
- Table 64: Rest of Asia Pacific Sand Control Systems Industry Volume (K Unit) Forecast, by Application 2019 & 2032
- Table 65: Global Sand Control Systems Industry Revenue Million Forecast, by Country 2019 & 2032
- Table 66: Global Sand Control Systems Industry Volume K Unit Forecast, by Country 2019 & 2032
- Table 67: Brazil Sand Control Systems Industry Revenue (Million) Forecast, by Application 2019 & 2032
- Table 68: Brazil Sand Control Systems Industry Volume (K Unit) Forecast, by Application 2019 & 2032
- Table 69: Argentina Sand Control Systems Industry Revenue (Million) Forecast, by Application 2019 & 2032
- Table 70: Argentina Sand Control Systems Industry Volume (K Unit) Forecast, by Application 2019 & 2032
- Table 71: Peru Sand Control Systems Industry Revenue (Million) Forecast, by Application 2019 & 2032
- Table 72: Peru Sand Control Systems Industry Volume (K Unit) Forecast, by Application 2019 & 2032
- Table 73: Chile Sand Control Systems Industry Revenue (Million) Forecast, by Application 2019 & 2032
- Table 74: Chile Sand Control Systems Industry Volume (K Unit) Forecast, by Application 2019 & 2032
- Table 75: Colombia Sand Control Systems Industry Revenue (Million) Forecast, by Application 2019 & 2032
- Table 76: Colombia Sand Control Systems Industry Volume (K Unit) Forecast, by Application 2019 & 2032
- Table 77: Ecuador Sand Control Systems Industry Revenue (Million) Forecast, by Application 2019 & 2032
- Table 78: Ecuador Sand Control Systems Industry Volume (K Unit) Forecast, by Application 2019 & 2032
- Table 79: Venezuela Sand Control Systems Industry Revenue (Million) Forecast, by Application 2019 & 2032
- Table 80: Venezuela Sand Control Systems Industry Volume (K Unit) Forecast, by Application 2019 & 2032
- Table 81: Rest of South America Sand Control Systems Industry Revenue (Million) Forecast, by Application 2019 & 2032
- Table 82: Rest of South America Sand Control Systems Industry Volume (K Unit) Forecast, by Application 2019 & 2032
- Table 83: Global Sand Control Systems Industry Revenue Million Forecast, by Country 2019 & 2032
- Table 84: Global Sand Control Systems Industry Volume K Unit Forecast, by Country 2019 & 2032
- Table 85: United States Sand Control Systems Industry Revenue (Million) Forecast, by Application 2019 & 2032
- Table 86: United States Sand Control Systems Industry Volume (K Unit) Forecast, by Application 2019 & 2032
- Table 87: Canada Sand Control Systems Industry Revenue (Million) Forecast, by Application 2019 & 2032
- Table 88: Canada Sand Control Systems Industry Volume (K Unit) Forecast, by Application 2019 & 2032
- Table 89: Mexico Sand Control Systems Industry Revenue (Million) Forecast, by Application 2019 & 2032
- Table 90: Mexico Sand Control Systems Industry Volume (K Unit) Forecast, by Application 2019 & 2032
- Table 91: Global Sand Control Systems Industry Revenue Million Forecast, by Country 2019 & 2032
- Table 92: Global Sand Control Systems Industry Volume K Unit Forecast, by Country 2019 & 2032
- Table 93: United Arab Emirates Sand Control Systems Industry Revenue (Million) Forecast, by Application 2019 & 2032
- Table 94: United Arab Emirates Sand Control Systems Industry Volume (K Unit) Forecast, by Application 2019 & 2032
- Table 95: Saudi Arabia Sand Control Systems Industry Revenue (Million) Forecast, by Application 2019 & 2032
- Table 96: Saudi Arabia Sand Control Systems Industry Volume (K Unit) Forecast, by Application 2019 & 2032
- Table 97: South Africa Sand Control Systems Industry Revenue (Million) Forecast, by Application 2019 & 2032
- Table 98: South Africa Sand Control Systems Industry Volume (K Unit) Forecast, by Application 2019 & 2032
- Table 99: Rest of Middle East and Africa Sand Control Systems Industry Revenue (Million) Forecast, by Application 2019 & 2032
- Table 100: Rest of Middle East and Africa Sand Control Systems Industry Volume (K Unit) Forecast, by Application 2019 & 2032
- Table 101: Global Sand Control Systems Industry Revenue Million Forecast, by Well Type 2019 & 2032
- Table 102: Global Sand Control Systems Industry Volume K Unit Forecast, by Well Type 2019 & 2032
- Table 103: Global Sand Control Systems Industry Revenue Million Forecast, by Location of Deployment 2019 & 2032
- Table 104: Global Sand Control Systems Industry Volume K Unit Forecast, by Location of Deployment 2019 & 2032
- Table 105: Global Sand Control Systems Industry Revenue Million Forecast, by Sand Control Method 2019 & 2032
- Table 106: Global Sand Control Systems Industry Volume K Unit Forecast, by Sand Control Method 2019 & 2032
- Table 107: Global Sand Control Systems Industry Revenue Million Forecast, by Country 2019 & 2032
- Table 108: Global Sand Control Systems Industry Volume K Unit Forecast, by Country 2019 & 2032
- Table 109: Global Sand Control Systems Industry Revenue Million Forecast, by Well Type 2019 & 2032
- Table 110: Global Sand Control Systems Industry Volume K Unit Forecast, by Well Type 2019 & 2032
- Table 111: Global Sand Control Systems Industry Revenue Million Forecast, by Location of Deployment 2019 & 2032
- Table 112: Global Sand Control Systems Industry Volume K Unit Forecast, by Location of Deployment 2019 & 2032
- Table 113: Global Sand Control Systems Industry Revenue Million Forecast, by Sand Control Method 2019 & 2032
- Table 114: Global Sand Control Systems Industry Volume K Unit Forecast, by Sand Control Method 2019 & 2032
- Table 115: Global Sand Control Systems Industry Revenue Million Forecast, by Country 2019 & 2032
- Table 116: Global Sand Control Systems Industry Volume K Unit Forecast, by Country 2019 & 2032
- Table 117: Global Sand Control Systems Industry Revenue Million Forecast, by Well Type 2019 & 2032
- Table 118: Global Sand Control Systems Industry Volume K Unit Forecast, by Well Type 2019 & 2032
- Table 119: Global Sand Control Systems Industry Revenue Million Forecast, by Location of Deployment 2019 & 2032
- Table 120: Global Sand Control Systems Industry Volume K Unit Forecast, by Location of Deployment 2019 & 2032
- Table 121: Global Sand Control Systems Industry Revenue Million Forecast, by Sand Control Method 2019 & 2032
- Table 122: Global Sand Control Systems Industry Volume K Unit Forecast, by Sand Control Method 2019 & 2032
- Table 123: Global Sand Control Systems Industry Revenue Million Forecast, by Country 2019 & 2032
- Table 124: Global Sand Control Systems Industry Volume K Unit Forecast, by Country 2019 & 2032
- Table 125: Global Sand Control Systems Industry Revenue Million Forecast, by Well Type 2019 & 2032
- Table 126: Global Sand Control Systems Industry Volume K Unit Forecast, by Well Type 2019 & 2032
- Table 127: Global Sand Control Systems Industry Revenue Million Forecast, by Location of Deployment 2019 & 2032
- Table 128: Global Sand Control Systems Industry Volume K Unit Forecast, by Location of Deployment 2019 & 2032
- Table 129: Global Sand Control Systems Industry Revenue Million Forecast, by Sand Control Method 2019 & 2032
- Table 130: Global Sand Control Systems Industry Volume K Unit Forecast, by Sand Control Method 2019 & 2032
- Table 131: Global Sand Control Systems Industry Revenue Million Forecast, by Country 2019 & 2032
- Table 132: Global Sand Control Systems Industry Volume K Unit Forecast, by Country 2019 & 2032
- Table 133: Global Sand Control Systems Industry Revenue Million Forecast, by Well Type 2019 & 2032
- Table 134: Global Sand Control Systems Industry Volume K Unit Forecast, by Well Type 2019 & 2032
- Table 135: Global Sand Control Systems Industry Revenue Million Forecast, by Location of Deployment 2019 & 2032
- Table 136: Global Sand Control Systems Industry Volume K Unit Forecast, by Location of Deployment 2019 & 2032
- Table 137: Global Sand Control Systems Industry Revenue Million Forecast, by Sand Control Method 2019 & 2032
- Table 138: Global Sand Control Systems Industry Volume K Unit Forecast, by Sand Control Method 2019 & 2032
- Table 139: Global Sand Control Systems Industry Revenue Million Forecast, by Country 2019 & 2032
- Table 140: Global Sand Control Systems Industry Volume K Unit Forecast, by Country 2019 & 2032
Frequently Asked Questions
1. What is the projected Compound Annual Growth Rate (CAGR) of the Sand Control Systems Industry?
The projected CAGR is approximately > 4.00%.
2. Which companies are prominent players in the Sand Control Systems Industry?
Key companies in the market include National Oilwell Varco Inc, Schlumberger Ltd, Superior Energy, RGL Reservoir Management Inc, Baker Hughes Company, Halliburton Company, Welltec A/S*List Not Exhaustive, Weatherford International Ltd.
3. What are the main segments of the Sand Control Systems Industry?
The market segments include Well Type, Location of Deployment, Sand Control Method.
4. Can you provide details about the market size?
The market size is estimated to be USD XX Million as of 2022.
5. What are some drivers contributing to market growth?
4.; The Rise in Oil and Gas Drilling Activities4.; Increased Shale Gas Exploration.
6. What are the notable trends driving market growth?
Offshore Segment to Dominate the Market.
7. Are there any restraints impacting market growth?
4.; Increasing Share of Renewable Energy.
8. Can you provide examples of recent developments in the market?
N/A
9. What pricing options are available for accessing the report?
Pricing options include single-user, multi-user, and enterprise licenses priced at USD 4750, USD 5250, and USD 8750 respectively.
10. Is the market size provided in terms of value or volume?
The market size is provided in terms of value, measured in Million and volume, measured in K Unit.
11. Are there any specific market keywords associated with the report?
Yes, the market keyword associated with the report is "Sand Control Systems Industry," which aids in identifying and referencing the specific market segment covered.
12. How do I determine which pricing option suits my needs best?
The pricing options vary based on user requirements and access needs. Individual users may opt for single-user licenses, while businesses requiring broader access may choose multi-user or enterprise licenses for cost-effective access to the report.
13. Are there any additional resources or data provided in the Sand Control Systems Industry report?
While the report offers comprehensive insights, it's advisable to review the specific contents or supplementary materials provided to ascertain if additional resources or data are available.
14. How can I stay updated on further developments or reports in the Sand Control Systems Industry?
To stay informed about further developments, trends, and reports in the Sand Control Systems Industry, consider subscribing to industry newsletters, following relevant companies and organizations, or regularly checking reputable industry news sources and publications.
Methodology
Step 1 - Identification of Relevant Samples Size from Population Database


Step 2 - Approaches for Defining Global Market Size (Value, Volume* & Price*)

Note*: In applicable scenarios
Step 3 - Data Sources
Primary Research
- Web Analytics
- Survey Reports
- Research Institute
- Latest Research Reports
- Opinion Leaders
Secondary Research
- Annual Reports
- White Paper
- Latest Press Release
- Industry Association
- Paid Database
- Investor Presentations

Step 4 - Data Triangulation
Involves using different sources of information in order to increase the validity of a study
These sources are likely to be stakeholders in a program - participants, other researchers, program staff, other community members, and so on.
Then we put all data in single framework & apply various statistical tools to find out the dynamic on the market.
During the analysis stage, feedback from the stakeholder groups would be compared to determine areas of agreement as well as areas of divergence


