
Key Insights
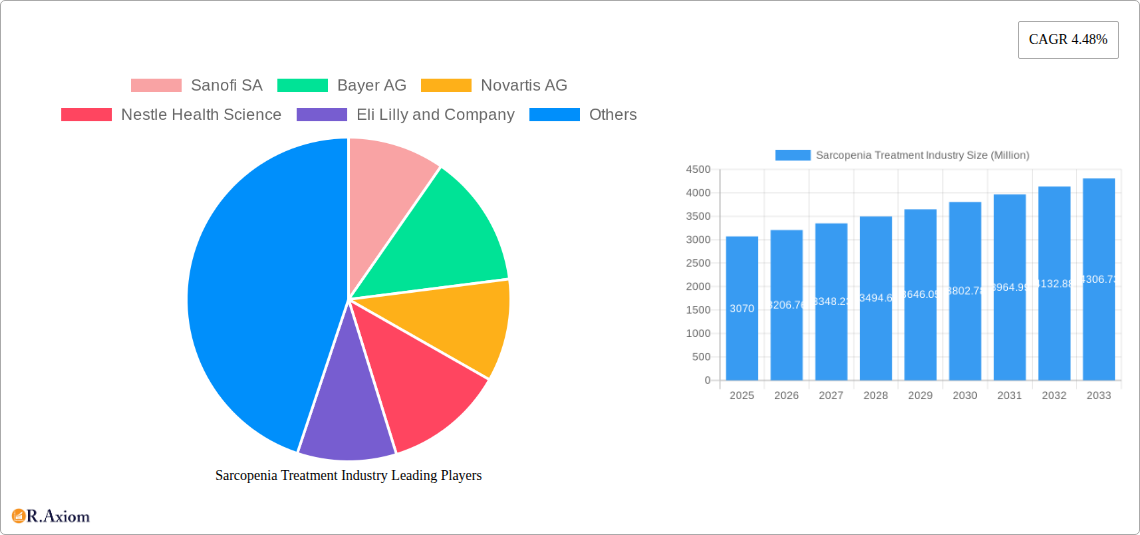
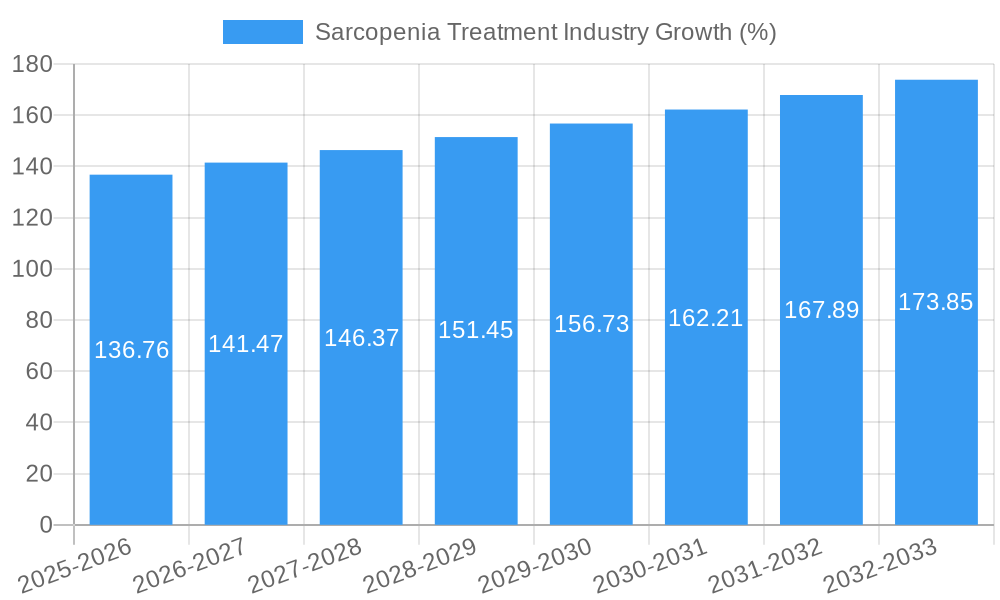
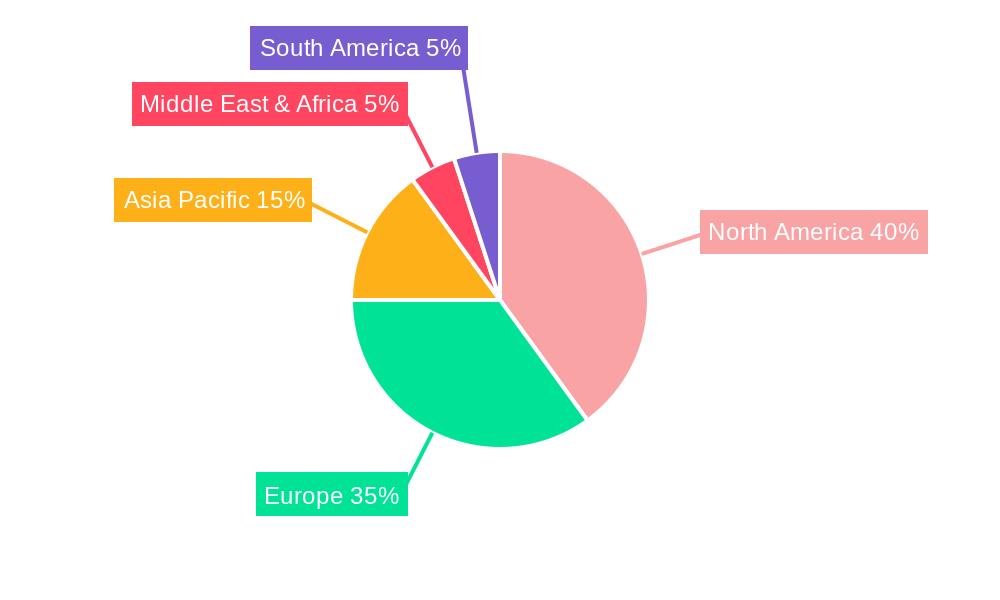
The global sarcopenia treatment market, valued at $3.07 billion in 2025, is projected to experience robust growth, driven by a rapidly aging global population and increasing awareness of sarcopenia's debilitating effects. A compound annual growth rate (CAGR) of 4.48% from 2025 to 2033 indicates a significant expansion of this market. Key drivers include rising healthcare expenditure, advancements in diagnostic tools for early detection, and the development of innovative therapeutic interventions beyond nutritional supplements. The market is segmented by treatment type, with protein supplements currently holding a substantial share, followed by Vitamin B12, Vitamin D and Calcium supplements. However, the emergence of novel therapeutic approaches, such as pharmaceuticals targeting muscle growth and regeneration, is poised to significantly reshape the market landscape in the coming years. Growth is also being fueled by increasing access to advanced healthcare facilities and a rising preference for convenient online pharmacies. Geographic variations in healthcare infrastructure and awareness levels contribute to regional disparities in market penetration, with North America and Europe currently dominating due to higher healthcare spending and early adoption of new therapies. However, the Asia-Pacific region is expected to demonstrate accelerated growth driven by an aging population and increasing disposable income. Restraints on market growth may include high treatment costs, limited insurance coverage in certain regions, and potential side effects associated with some treatments.
The forecast period (2025-2033) will witness a significant shift towards personalized medicine approaches in sarcopenia management, tailoring interventions to individual patient needs and characteristics. This will involve a greater emphasis on genetic testing, advanced diagnostic imaging, and the development of targeted therapies with improved efficacy and reduced side effects. The increasing collaboration between pharmaceutical companies, research institutions, and healthcare providers is fostering innovation and accelerating the translation of research findings into effective clinical treatments. Furthermore, government initiatives aimed at promoting healthy aging and improving geriatric care will play a crucial role in driving market expansion. Competition among established pharmaceutical companies and emerging biotech firms is anticipated to intensify, leading to further innovation and price competition, ultimately benefiting patients. The continuous evaluation of existing treatments and the development of new therapies addressing specific subtypes of sarcopenia will remain a key area of focus in shaping the future of this market.
Sarcopenia Treatment Industry: A Comprehensive Market Report (2019-2033)
This comprehensive report provides an in-depth analysis of the global sarcopenia treatment industry, covering market size, segmentation, growth drivers, challenges, and key players. The study period spans from 2019 to 2033, with 2025 serving as the base and estimated year. The forecast period extends from 2025 to 2033, while the historical period covers 2019-2024. The report offers actionable insights for industry stakeholders, including pharmaceutical companies, investors, and healthcare professionals. The market is segmented by treatment type (Protein Supplements, Vitamin B12 Supplements, Vitamin D and Calcium Supplements, Other Treatment Types) and distribution channel (Hospital Pharmacies, Retail Pharmacies, Online Pharmacies, Other Distribution Channels). Key companies analyzed include Sanofi SA, Bayer AG, Novartis AG, Nestle Health Science, Eli Lilly and Company, Haleon Group of Companies, and Zydus Life Sciences Limited.
Sarcopenia Treatment Industry Market Concentration & Innovation
The global sarcopenia treatment market exhibits a moderately concentrated landscape, with a few large multinational pharmaceutical companies holding significant market share. While precise market share figures for individual companies are proprietary, estimates suggest that the top five players control approximately xx% of the market in 2025. This concentration is driven by substantial R&D investments and established distribution networks. However, the market also shows potential for disruption from smaller innovative companies focusing on novel treatment modalities.
Innovation Drivers:
- Significant unmet medical need for effective sarcopenia treatments.
- Advancements in understanding the pathophysiology of sarcopenia.
- Development of novel therapeutic agents targeting muscle loss and dysfunction.
- Growing adoption of personalized medicine approaches.
Regulatory Frameworks: Stringent regulatory requirements for drug approvals pose a challenge but also ensure product safety and efficacy. The FDA's approval processes, for example, significantly impact market entry timelines and costs.
Product Substitutes: Currently, the primary substitutes are lifestyle modifications (diet, exercise), but their effectiveness is limited, providing ample opportunity for pharmaceutical interventions.
End-User Trends: The aging global population is the primary driver, creating a substantial and growing market. Increased awareness of sarcopenia and its impact on quality of life fuels demand.
M&A Activities: The industry has witnessed a moderate level of M&A activity in recent years, with deal values totaling approximately $xx Million in the period 2019-2024. These activities reflect strategic efforts to expand product portfolios and market access.
Sarcopenia Treatment Industry Industry Trends & Insights
The sarcopenia treatment market is experiencing robust growth, driven by the expanding geriatric population globally. The market is projected to reach $xx Million by 2033, exhibiting a compound annual growth rate (CAGR) of xx% during the forecast period (2025-2033). This growth is significantly influenced by increased healthcare expenditure, rising awareness about sarcopenia, and technological advancements in diagnostics and therapeutics. Market penetration is currently low, but expected to increase significantly with the introduction of more effective treatments.
Technological disruptions, such as advancements in personalized medicine and the development of novel biomarkers for early detection, are expected to propel market growth. Consumer preferences are shifting towards less invasive and more effective treatments with minimal side effects, influencing the development of new drug delivery systems and therapeutic modalities. Competitive dynamics are characterized by both established pharmaceutical giants and emerging biotech companies vying for market share, leading to increased innovation and potentially more affordable therapies.
Dominant Markets & Segments in Sarcopenia Treatment Industry
Dominant Region/Country: North America currently holds the largest market share, driven by high healthcare expenditure and a substantial aging population. However, Asia-Pacific is expected to witness the fastest growth rate in the coming years due to rapid population aging and increasing healthcare infrastructure development.
Dominant Segments:
By Treatment Type: Protein supplements currently dominate the market, followed by Vitamin D and Calcium supplements. However, the "Other Treatment Types" segment is expected to show significant growth due to the emergence of novel therapeutic agents.
By Distribution Channel: Hospital pharmacies are a major distribution channel, particularly for novel therapeutics requiring administration under medical supervision. However, Retail and Online pharmacies are expected to play increasingly crucial roles, especially for over-the-counter supplements and more established therapies.
Key Drivers for Dominant Segments and Regions:
- High healthcare expenditure.
- Well-established healthcare infrastructure.
- High prevalence of sarcopenia.
- Strong regulatory framework.
Sarcopenia Treatment Industry Product Developments
Recent innovations have focused on developing novel therapeutic agents targeting specific molecular pathways involved in sarcopenia. These include small molecule drugs, biologics, and gene therapies, alongside enhanced nutritional supplements with improved bioavailability and efficacy. These products aim to address the limitations of existing treatments, focusing on improved muscle mass, strength, and functional capacity. Market fit is assessed based on efficacy, safety, cost-effectiveness, and ease of administration, ensuring that these advanced treatments are viable and accessible to patients. Technological trends are influencing development towards personalized therapies based on individual genetic profiles and disease severity.
Report Scope & Segmentation Analysis
This report segments the sarcopenia treatment market by treatment type and distribution channel. The treatment type segment includes Protein Supplements (market size: $xx Million in 2025, projected CAGR: xx%), Vitamin B12 Supplements ($xx Million, CAGR: xx%), Vitamin D and Calcium Supplements ($xx Million, CAGR: xx%), and Other Treatment Types ($xx Million, CAGR: xx%). These segments show varying growth rates based on the efficacy and adoption of different treatments.
The distribution channel segment includes Hospital Pharmacies ($xx Million, CAGR: xx%), Retail Pharmacies ($xx Million, CAGR: xx%), Online Pharmacies ($xx Million, CAGR: xx%), and Other Distribution Channels ($xx Million, CAGR: xx%). Competitive dynamics within each segment are shaped by factors like pricing strategies, brand loyalty, and regulatory approvals.
Key Drivers of Sarcopenia Treatment Industry Growth
The key drivers for the industry's growth are the aging global population, increasing healthcare expenditure, rising awareness of sarcopenia and its debilitating effects, and technological advancements in diagnostics and therapeutics. Furthermore, supportive regulatory frameworks encouraging development and adoption of effective treatments also significantly contribute. The development of novel biomarkers for early detection is also contributing to increased market growth.
Challenges in the Sarcopenia Treatment Industry Sector
Challenges include the high cost of drug development and regulatory approvals, lengthy clinical trial processes, and the complexities of targeting a heterogeneous patient population. Supply chain disruptions, especially during the post-pandemic period, also impacted market dynamics. The competitive landscape, with both established players and new entrants, puts pressure on pricing and profitability. The variability in the clinical presentation of sarcopenia adds difficulty in identifying suitable treatment targets for all patients.
Emerging Opportunities in Sarcopenia Treatment Industry
Emerging opportunities lie in personalized medicine approaches, utilizing genetic information and biomarkers to tailor treatments to individual patients. Advancements in diagnostic tools, allowing for earlier and more accurate detection, create greater potential for preventative and therapeutic interventions. Expansion into untapped markets with rapidly aging populations, especially in emerging economies, offers significant growth potential.
Leading Players in the Sarcopenia Treatment Industry Market
- Sanofi SA
- Bayer AG
- Novartis AG
- Nestle Health Science
- Eli Lilly and Company
- Haleon Group of Companies
- Zydus Life Sciences Limited
Key Developments in Sarcopenia Treatment Industry Industry
July 2023: Biophytis filed for FDA approval to launch SARA-31, a Phase III study for Sarconeos (BIO101) in treating sarcopenic patients at risk of mobility disability. This signifies a significant step towards bringing a new treatment to market.
February 2023: University College Dublin initiated a clinical trial examining the efficacy of resistance exercise combined with nutritional supplements for sarcopenia prevention in home-care patients. This highlights the increasing focus on combined therapeutic and lifestyle interventions.
Strategic Outlook for Sarcopenia Treatment Industry Market
The sarcopenia treatment market holds significant future potential driven by the global aging demographic, innovation in treatment approaches, and increasing healthcare spending. The market is poised for substantial growth with opportunities for both established pharmaceutical companies and emerging biotech firms. Future success will depend on developing effective, safe, and cost-effective treatments tailored to diverse patient populations, alongside strengthening partnerships across the healthcare ecosystem to improve access and affordability.
Sarcopenia Treatment Industry Segmentation
-
1. Treatment Type
- 1.1. Protein Supplements
- 1.2. Vitamin B12 Supplements
- 1.3. Vitamin D and Calcium Supplements
- 1.4. Other Treatment Types
-
2. Distribution Channel
- 2.1. Hospital Pharmacies
- 2.2. Retail Pharmacies
- 2.3. Online Pharmacies
- 2.4. Other Distribution Channels
Sarcopenia Treatment Industry Segmentation By Geography
-
1. North America
- 1.1. United States
- 1.2. Canada
- 1.3. Mexico
-
2. Europe
- 2.1. Germany
- 2.2. United Kingdom
- 2.3. France
- 2.4. Italy
- 2.5. Spain
- 2.6. Rest of Europe
-
3. Asia Pacific
- 3.1. China
- 3.2. Japan
- 3.3. India
- 3.4. Australia
- 3.5. South Korea
- 3.6. Rest of Asia Pacific
- 4. Middle East
-
5. GCC
- 5.1. South Africa
- 5.2. Rest of Middle East
-
6. South America
- 6.1. Brazil
- 6.2. Argentina
- 6.3. Rest of South America
Sarcopenia Treatment Industry REPORT HIGHLIGHTS
| Aspects | Details |
|---|---|
| Study Period | 2019-2033 |
| Base Year | 2024 |
| Estimated Year | 2025 |
| Forecast Period | 2025-2033 |
| Historical Period | 2019-2024 |
| Growth Rate | CAGR of 4.48% from 2019-2033 |
| Segmentation |
|
Table of Contents
- 1. Introduction
- 1.1. Research Scope
- 1.2. Market Segmentation
- 1.3. Research Methodology
- 1.4. Definitions and Assumptions
- 2. Executive Summary
- 2.1. Introduction
- 3. Market Dynamics
- 3.1. Introduction
- 3.2. Market Drivers
- 3.2.1. Increasing Geriatric Population; Rise in Malnutrition and Vitamin Deficiency in Developing Countries
- 3.3. Market Restrains
- 3.3.1. Non-availability of New Drugs
- 3.4. Market Trends
- 3.4.1. Protein Supplement Anticipated to Show Considerable Growth During the Forecast Period
- 4. Market Factor Analysis
- 4.1. Porters Five Forces
- 4.2. Supply/Value Chain
- 4.3. PESTEL analysis
- 4.4. Market Entropy
- 4.5. Patent/Trademark Analysis
- 5. Global Sarcopenia Treatment Industry Analysis, Insights and Forecast, 2019-2031
- 5.1. Market Analysis, Insights and Forecast - by Treatment Type
- 5.1.1. Protein Supplements
- 5.1.2. Vitamin B12 Supplements
- 5.1.3. Vitamin D and Calcium Supplements
- 5.1.4. Other Treatment Types
- 5.2. Market Analysis, Insights and Forecast - by Distribution Channel
- 5.2.1. Hospital Pharmacies
- 5.2.2. Retail Pharmacies
- 5.2.3. Online Pharmacies
- 5.2.4. Other Distribution Channels
- 5.3. Market Analysis, Insights and Forecast - by Region
- 5.3.1. North America
- 5.3.2. Europe
- 5.3.3. Asia Pacific
- 5.3.4. Middle East
- 5.3.5. GCC
- 5.3.6. South America
- 5.1. Market Analysis, Insights and Forecast - by Treatment Type
- 6. North America Sarcopenia Treatment Industry Analysis, Insights and Forecast, 2019-2031
- 6.1. Market Analysis, Insights and Forecast - by Treatment Type
- 6.1.1. Protein Supplements
- 6.1.2. Vitamin B12 Supplements
- 6.1.3. Vitamin D and Calcium Supplements
- 6.1.4. Other Treatment Types
- 6.2. Market Analysis, Insights and Forecast - by Distribution Channel
- 6.2.1. Hospital Pharmacies
- 6.2.2. Retail Pharmacies
- 6.2.3. Online Pharmacies
- 6.2.4. Other Distribution Channels
- 6.1. Market Analysis, Insights and Forecast - by Treatment Type
- 7. Europe Sarcopenia Treatment Industry Analysis, Insights and Forecast, 2019-2031
- 7.1. Market Analysis, Insights and Forecast - by Treatment Type
- 7.1.1. Protein Supplements
- 7.1.2. Vitamin B12 Supplements
- 7.1.3. Vitamin D and Calcium Supplements
- 7.1.4. Other Treatment Types
- 7.2. Market Analysis, Insights and Forecast - by Distribution Channel
- 7.2.1. Hospital Pharmacies
- 7.2.2. Retail Pharmacies
- 7.2.3. Online Pharmacies
- 7.2.4. Other Distribution Channels
- 7.1. Market Analysis, Insights and Forecast - by Treatment Type
- 8. Asia Pacific Sarcopenia Treatment Industry Analysis, Insights and Forecast, 2019-2031
- 8.1. Market Analysis, Insights and Forecast - by Treatment Type
- 8.1.1. Protein Supplements
- 8.1.2. Vitamin B12 Supplements
- 8.1.3. Vitamin D and Calcium Supplements
- 8.1.4. Other Treatment Types
- 8.2. Market Analysis, Insights and Forecast - by Distribution Channel
- 8.2.1. Hospital Pharmacies
- 8.2.2. Retail Pharmacies
- 8.2.3. Online Pharmacies
- 8.2.4. Other Distribution Channels
- 8.1. Market Analysis, Insights and Forecast - by Treatment Type
- 9. Middle East Sarcopenia Treatment Industry Analysis, Insights and Forecast, 2019-2031
- 9.1. Market Analysis, Insights and Forecast - by Treatment Type
- 9.1.1. Protein Supplements
- 9.1.2. Vitamin B12 Supplements
- 9.1.3. Vitamin D and Calcium Supplements
- 9.1.4. Other Treatment Types
- 9.2. Market Analysis, Insights and Forecast - by Distribution Channel
- 9.2.1. Hospital Pharmacies
- 9.2.2. Retail Pharmacies
- 9.2.3. Online Pharmacies
- 9.2.4. Other Distribution Channels
- 9.1. Market Analysis, Insights and Forecast - by Treatment Type
- 10. GCC Sarcopenia Treatment Industry Analysis, Insights and Forecast, 2019-2031
- 10.1. Market Analysis, Insights and Forecast - by Treatment Type
- 10.1.1. Protein Supplements
- 10.1.2. Vitamin B12 Supplements
- 10.1.3. Vitamin D and Calcium Supplements
- 10.1.4. Other Treatment Types
- 10.2. Market Analysis, Insights and Forecast - by Distribution Channel
- 10.2.1. Hospital Pharmacies
- 10.2.2. Retail Pharmacies
- 10.2.3. Online Pharmacies
- 10.2.4. Other Distribution Channels
- 10.1. Market Analysis, Insights and Forecast - by Treatment Type
- 11. South America Sarcopenia Treatment Industry Analysis, Insights and Forecast, 2019-2031
- 11.1. Market Analysis, Insights and Forecast - by Treatment Type
- 11.1.1. Protein Supplements
- 11.1.2. Vitamin B12 Supplements
- 11.1.3. Vitamin D and Calcium Supplements
- 11.1.4. Other Treatment Types
- 11.2. Market Analysis, Insights and Forecast - by Distribution Channel
- 11.2.1. Hospital Pharmacies
- 11.2.2. Retail Pharmacies
- 11.2.3. Online Pharmacies
- 11.2.4. Other Distribution Channels
- 11.1. Market Analysis, Insights and Forecast - by Treatment Type
- 12. North America Sarcopenia Treatment Industry Analysis, Insights and Forecast, 2019-2031
- 12.1. Market Analysis, Insights and Forecast - By Country/Sub-region
- 12.1.1 United States
- 12.1.2 Canada
- 12.1.3 Mexico
- 13. Europe Sarcopenia Treatment Industry Analysis, Insights and Forecast, 2019-2031
- 13.1. Market Analysis, Insights and Forecast - By Country/Sub-region
- 13.1.1 Germany
- 13.1.2 United Kingdom
- 13.1.3 France
- 13.1.4 Italy
- 13.1.5 Spain
- 13.1.6 Rest of Europe
- 14. Asia Pacific Sarcopenia Treatment Industry Analysis, Insights and Forecast, 2019-2031
- 14.1. Market Analysis, Insights and Forecast - By Country/Sub-region
- 14.1.1 China
- 14.1.2 Japan
- 14.1.3 India
- 14.1.4 Australia
- 14.1.5 South Korea
- 14.1.6 Rest of Asia Pacific
- 15. Middle East Sarcopenia Treatment Industry Analysis, Insights and Forecast, 2019-2031
- 15.1. Market Analysis, Insights and Forecast - By Country/Sub-region
- 15.1.1.
- 16. GCC Sarcopenia Treatment Industry Analysis, Insights and Forecast, 2019-2031
- 16.1. Market Analysis, Insights and Forecast - By Country/Sub-region
- 16.1.1 South Africa
- 16.1.2 Rest of Middle East
- 17. South America Sarcopenia Treatment Industry Analysis, Insights and Forecast, 2019-2031
- 17.1. Market Analysis, Insights and Forecast - By Country/Sub-region
- 17.1.1 Brazil
- 17.1.2 Argentina
- 17.1.3 Rest of South America
- 18. Competitive Analysis
- 18.1. Global Market Share Analysis 2024
- 18.2. Company Profiles
- 18.2.1 Sanofi SA
- 18.2.1.1. Overview
- 18.2.1.2. Products
- 18.2.1.3. SWOT Analysis
- 18.2.1.4. Recent Developments
- 18.2.1.5. Financials (Based on Availability)
- 18.2.2 Bayer AG
- 18.2.2.1. Overview
- 18.2.2.2. Products
- 18.2.2.3. SWOT Analysis
- 18.2.2.4. Recent Developments
- 18.2.2.5. Financials (Based on Availability)
- 18.2.3 Novartis AG
- 18.2.3.1. Overview
- 18.2.3.2. Products
- 18.2.3.3. SWOT Analysis
- 18.2.3.4. Recent Developments
- 18.2.3.5. Financials (Based on Availability)
- 18.2.4 Nestle Health Science
- 18.2.4.1. Overview
- 18.2.4.2. Products
- 18.2.4.3. SWOT Analysis
- 18.2.4.4. Recent Developments
- 18.2.4.5. Financials (Based on Availability)
- 18.2.5 Eli Lilly and Company
- 18.2.5.1. Overview
- 18.2.5.2. Products
- 18.2.5.3. SWOT Analysis
- 18.2.5.4. Recent Developments
- 18.2.5.5. Financials (Based on Availability)
- 18.2.6 Haleon Group of Companies
- 18.2.6.1. Overview
- 18.2.6.2. Products
- 18.2.6.3. SWOT Analysis
- 18.2.6.4. Recent Developments
- 18.2.6.5. Financials (Based on Availability)
- 18.2.7 Zydus Life Sciences Limited
- 18.2.7.1. Overview
- 18.2.7.2. Products
- 18.2.7.3. SWOT Analysis
- 18.2.7.4. Recent Developments
- 18.2.7.5. Financials (Based on Availability)
- 18.2.1 Sanofi SA
List of Figures
- Figure 1: Global Sarcopenia Treatment Industry Revenue Breakdown (Million, %) by Region 2024 & 2032
- Figure 2: Global Sarcopenia Treatment Industry Volume Breakdown (K Unit, %) by Region 2024 & 2032
- Figure 3: North America Sarcopenia Treatment Industry Revenue (Million), by Country 2024 & 2032
- Figure 4: North America Sarcopenia Treatment Industry Volume (K Unit), by Country 2024 & 2032
- Figure 5: North America Sarcopenia Treatment Industry Revenue Share (%), by Country 2024 & 2032
- Figure 6: North America Sarcopenia Treatment Industry Volume Share (%), by Country 2024 & 2032
- Figure 7: Europe Sarcopenia Treatment Industry Revenue (Million), by Country 2024 & 2032
- Figure 8: Europe Sarcopenia Treatment Industry Volume (K Unit), by Country 2024 & 2032
- Figure 9: Europe Sarcopenia Treatment Industry Revenue Share (%), by Country 2024 & 2032
- Figure 10: Europe Sarcopenia Treatment Industry Volume Share (%), by Country 2024 & 2032
- Figure 11: Asia Pacific Sarcopenia Treatment Industry Revenue (Million), by Country 2024 & 2032
- Figure 12: Asia Pacific Sarcopenia Treatment Industry Volume (K Unit), by Country 2024 & 2032
- Figure 13: Asia Pacific Sarcopenia Treatment Industry Revenue Share (%), by Country 2024 & 2032
- Figure 14: Asia Pacific Sarcopenia Treatment Industry Volume Share (%), by Country 2024 & 2032
- Figure 15: Middle East Sarcopenia Treatment Industry Revenue (Million), by Country 2024 & 2032
- Figure 16: Middle East Sarcopenia Treatment Industry Volume (K Unit), by Country 2024 & 2032
- Figure 17: Middle East Sarcopenia Treatment Industry Revenue Share (%), by Country 2024 & 2032
- Figure 18: Middle East Sarcopenia Treatment Industry Volume Share (%), by Country 2024 & 2032
- Figure 19: GCC Sarcopenia Treatment Industry Revenue (Million), by Country 2024 & 2032
- Figure 20: GCC Sarcopenia Treatment Industry Volume (K Unit), by Country 2024 & 2032
- Figure 21: GCC Sarcopenia Treatment Industry Revenue Share (%), by Country 2024 & 2032
- Figure 22: GCC Sarcopenia Treatment Industry Volume Share (%), by Country 2024 & 2032
- Figure 23: South America Sarcopenia Treatment Industry Revenue (Million), by Country 2024 & 2032
- Figure 24: South America Sarcopenia Treatment Industry Volume (K Unit), by Country 2024 & 2032
- Figure 25: South America Sarcopenia Treatment Industry Revenue Share (%), by Country 2024 & 2032
- Figure 26: South America Sarcopenia Treatment Industry Volume Share (%), by Country 2024 & 2032
- Figure 27: North America Sarcopenia Treatment Industry Revenue (Million), by Treatment Type 2024 & 2032
- Figure 28: North America Sarcopenia Treatment Industry Volume (K Unit), by Treatment Type 2024 & 2032
- Figure 29: North America Sarcopenia Treatment Industry Revenue Share (%), by Treatment Type 2024 & 2032
- Figure 30: North America Sarcopenia Treatment Industry Volume Share (%), by Treatment Type 2024 & 2032
- Figure 31: North America Sarcopenia Treatment Industry Revenue (Million), by Distribution Channel 2024 & 2032
- Figure 32: North America Sarcopenia Treatment Industry Volume (K Unit), by Distribution Channel 2024 & 2032
- Figure 33: North America Sarcopenia Treatment Industry Revenue Share (%), by Distribution Channel 2024 & 2032
- Figure 34: North America Sarcopenia Treatment Industry Volume Share (%), by Distribution Channel 2024 & 2032
- Figure 35: North America Sarcopenia Treatment Industry Revenue (Million), by Country 2024 & 2032
- Figure 36: North America Sarcopenia Treatment Industry Volume (K Unit), by Country 2024 & 2032
- Figure 37: North America Sarcopenia Treatment Industry Revenue Share (%), by Country 2024 & 2032
- Figure 38: North America Sarcopenia Treatment Industry Volume Share (%), by Country 2024 & 2032
- Figure 39: Europe Sarcopenia Treatment Industry Revenue (Million), by Treatment Type 2024 & 2032
- Figure 40: Europe Sarcopenia Treatment Industry Volume (K Unit), by Treatment Type 2024 & 2032
- Figure 41: Europe Sarcopenia Treatment Industry Revenue Share (%), by Treatment Type 2024 & 2032
- Figure 42: Europe Sarcopenia Treatment Industry Volume Share (%), by Treatment Type 2024 & 2032
- Figure 43: Europe Sarcopenia Treatment Industry Revenue (Million), by Distribution Channel 2024 & 2032
- Figure 44: Europe Sarcopenia Treatment Industry Volume (K Unit), by Distribution Channel 2024 & 2032
- Figure 45: Europe Sarcopenia Treatment Industry Revenue Share (%), by Distribution Channel 2024 & 2032
- Figure 46: Europe Sarcopenia Treatment Industry Volume Share (%), by Distribution Channel 2024 & 2032
- Figure 47: Europe Sarcopenia Treatment Industry Revenue (Million), by Country 2024 & 2032
- Figure 48: Europe Sarcopenia Treatment Industry Volume (K Unit), by Country 2024 & 2032
- Figure 49: Europe Sarcopenia Treatment Industry Revenue Share (%), by Country 2024 & 2032
- Figure 50: Europe Sarcopenia Treatment Industry Volume Share (%), by Country 2024 & 2032
- Figure 51: Asia Pacific Sarcopenia Treatment Industry Revenue (Million), by Treatment Type 2024 & 2032
- Figure 52: Asia Pacific Sarcopenia Treatment Industry Volume (K Unit), by Treatment Type 2024 & 2032
- Figure 53: Asia Pacific Sarcopenia Treatment Industry Revenue Share (%), by Treatment Type 2024 & 2032
- Figure 54: Asia Pacific Sarcopenia Treatment Industry Volume Share (%), by Treatment Type 2024 & 2032
- Figure 55: Asia Pacific Sarcopenia Treatment Industry Revenue (Million), by Distribution Channel 2024 & 2032
- Figure 56: Asia Pacific Sarcopenia Treatment Industry Volume (K Unit), by Distribution Channel 2024 & 2032
- Figure 57: Asia Pacific Sarcopenia Treatment Industry Revenue Share (%), by Distribution Channel 2024 & 2032
- Figure 58: Asia Pacific Sarcopenia Treatment Industry Volume Share (%), by Distribution Channel 2024 & 2032
- Figure 59: Asia Pacific Sarcopenia Treatment Industry Revenue (Million), by Country 2024 & 2032
- Figure 60: Asia Pacific Sarcopenia Treatment Industry Volume (K Unit), by Country 2024 & 2032
- Figure 61: Asia Pacific Sarcopenia Treatment Industry Revenue Share (%), by Country 2024 & 2032
- Figure 62: Asia Pacific Sarcopenia Treatment Industry Volume Share (%), by Country 2024 & 2032
- Figure 63: Middle East Sarcopenia Treatment Industry Revenue (Million), by Treatment Type 2024 & 2032
- Figure 64: Middle East Sarcopenia Treatment Industry Volume (K Unit), by Treatment Type 2024 & 2032
- Figure 65: Middle East Sarcopenia Treatment Industry Revenue Share (%), by Treatment Type 2024 & 2032
- Figure 66: Middle East Sarcopenia Treatment Industry Volume Share (%), by Treatment Type 2024 & 2032
- Figure 67: Middle East Sarcopenia Treatment Industry Revenue (Million), by Distribution Channel 2024 & 2032
- Figure 68: Middle East Sarcopenia Treatment Industry Volume (K Unit), by Distribution Channel 2024 & 2032
- Figure 69: Middle East Sarcopenia Treatment Industry Revenue Share (%), by Distribution Channel 2024 & 2032
- Figure 70: Middle East Sarcopenia Treatment Industry Volume Share (%), by Distribution Channel 2024 & 2032
- Figure 71: Middle East Sarcopenia Treatment Industry Revenue (Million), by Country 2024 & 2032
- Figure 72: Middle East Sarcopenia Treatment Industry Volume (K Unit), by Country 2024 & 2032
- Figure 73: Middle East Sarcopenia Treatment Industry Revenue Share (%), by Country 2024 & 2032
- Figure 74: Middle East Sarcopenia Treatment Industry Volume Share (%), by Country 2024 & 2032
- Figure 75: GCC Sarcopenia Treatment Industry Revenue (Million), by Treatment Type 2024 & 2032
- Figure 76: GCC Sarcopenia Treatment Industry Volume (K Unit), by Treatment Type 2024 & 2032
- Figure 77: GCC Sarcopenia Treatment Industry Revenue Share (%), by Treatment Type 2024 & 2032
- Figure 78: GCC Sarcopenia Treatment Industry Volume Share (%), by Treatment Type 2024 & 2032
- Figure 79: GCC Sarcopenia Treatment Industry Revenue (Million), by Distribution Channel 2024 & 2032
- Figure 80: GCC Sarcopenia Treatment Industry Volume (K Unit), by Distribution Channel 2024 & 2032
- Figure 81: GCC Sarcopenia Treatment Industry Revenue Share (%), by Distribution Channel 2024 & 2032
- Figure 82: GCC Sarcopenia Treatment Industry Volume Share (%), by Distribution Channel 2024 & 2032
- Figure 83: GCC Sarcopenia Treatment Industry Revenue (Million), by Country 2024 & 2032
- Figure 84: GCC Sarcopenia Treatment Industry Volume (K Unit), by Country 2024 & 2032
- Figure 85: GCC Sarcopenia Treatment Industry Revenue Share (%), by Country 2024 & 2032
- Figure 86: GCC Sarcopenia Treatment Industry Volume Share (%), by Country 2024 & 2032
- Figure 87: South America Sarcopenia Treatment Industry Revenue (Million), by Treatment Type 2024 & 2032
- Figure 88: South America Sarcopenia Treatment Industry Volume (K Unit), by Treatment Type 2024 & 2032
- Figure 89: South America Sarcopenia Treatment Industry Revenue Share (%), by Treatment Type 2024 & 2032
- Figure 90: South America Sarcopenia Treatment Industry Volume Share (%), by Treatment Type 2024 & 2032
- Figure 91: South America Sarcopenia Treatment Industry Revenue (Million), by Distribution Channel 2024 & 2032
- Figure 92: South America Sarcopenia Treatment Industry Volume (K Unit), by Distribution Channel 2024 & 2032
- Figure 93: South America Sarcopenia Treatment Industry Revenue Share (%), by Distribution Channel 2024 & 2032
- Figure 94: South America Sarcopenia Treatment Industry Volume Share (%), by Distribution Channel 2024 & 2032
- Figure 95: South America Sarcopenia Treatment Industry Revenue (Million), by Country 2024 & 2032
- Figure 96: South America Sarcopenia Treatment Industry Volume (K Unit), by Country 2024 & 2032
- Figure 97: South America Sarcopenia Treatment Industry Revenue Share (%), by Country 2024 & 2032
- Figure 98: South America Sarcopenia Treatment Industry Volume Share (%), by Country 2024 & 2032
List of Tables
- Table 1: Global Sarcopenia Treatment Industry Revenue Million Forecast, by Region 2019 & 2032
- Table 2: Global Sarcopenia Treatment Industry Volume K Unit Forecast, by Region 2019 & 2032
- Table 3: Global Sarcopenia Treatment Industry Revenue Million Forecast, by Treatment Type 2019 & 2032
- Table 4: Global Sarcopenia Treatment Industry Volume K Unit Forecast, by Treatment Type 2019 & 2032
- Table 5: Global Sarcopenia Treatment Industry Revenue Million Forecast, by Distribution Channel 2019 & 2032
- Table 6: Global Sarcopenia Treatment Industry Volume K Unit Forecast, by Distribution Channel 2019 & 2032
- Table 7: Global Sarcopenia Treatment Industry Revenue Million Forecast, by Region 2019 & 2032
- Table 8: Global Sarcopenia Treatment Industry Volume K Unit Forecast, by Region 2019 & 2032
- Table 9: Global Sarcopenia Treatment Industry Revenue Million Forecast, by Country 2019 & 2032
- Table 10: Global Sarcopenia Treatment Industry Volume K Unit Forecast, by Country 2019 & 2032
- Table 11: United States Sarcopenia Treatment Industry Revenue (Million) Forecast, by Application 2019 & 2032
- Table 12: United States Sarcopenia Treatment Industry Volume (K Unit) Forecast, by Application 2019 & 2032
- Table 13: Canada Sarcopenia Treatment Industry Revenue (Million) Forecast, by Application 2019 & 2032
- Table 14: Canada Sarcopenia Treatment Industry Volume (K Unit) Forecast, by Application 2019 & 2032
- Table 15: Mexico Sarcopenia Treatment Industry Revenue (Million) Forecast, by Application 2019 & 2032
- Table 16: Mexico Sarcopenia Treatment Industry Volume (K Unit) Forecast, by Application 2019 & 2032
- Table 17: Global Sarcopenia Treatment Industry Revenue Million Forecast, by Country 2019 & 2032
- Table 18: Global Sarcopenia Treatment Industry Volume K Unit Forecast, by Country 2019 & 2032
- Table 19: Germany Sarcopenia Treatment Industry Revenue (Million) Forecast, by Application 2019 & 2032
- Table 20: Germany Sarcopenia Treatment Industry Volume (K Unit) Forecast, by Application 2019 & 2032
- Table 21: United Kingdom Sarcopenia Treatment Industry Revenue (Million) Forecast, by Application 2019 & 2032
- Table 22: United Kingdom Sarcopenia Treatment Industry Volume (K Unit) Forecast, by Application 2019 & 2032
- Table 23: France Sarcopenia Treatment Industry Revenue (Million) Forecast, by Application 2019 & 2032
- Table 24: France Sarcopenia Treatment Industry Volume (K Unit) Forecast, by Application 2019 & 2032
- Table 25: Italy Sarcopenia Treatment Industry Revenue (Million) Forecast, by Application 2019 & 2032
- Table 26: Italy Sarcopenia Treatment Industry Volume (K Unit) Forecast, by Application 2019 & 2032
- Table 27: Spain Sarcopenia Treatment Industry Revenue (Million) Forecast, by Application 2019 & 2032
- Table 28: Spain Sarcopenia Treatment Industry Volume (K Unit) Forecast, by Application 2019 & 2032
- Table 29: Rest of Europe Sarcopenia Treatment Industry Revenue (Million) Forecast, by Application 2019 & 2032
- Table 30: Rest of Europe Sarcopenia Treatment Industry Volume (K Unit) Forecast, by Application 2019 & 2032
- Table 31: Global Sarcopenia Treatment Industry Revenue Million Forecast, by Country 2019 & 2032
- Table 32: Global Sarcopenia Treatment Industry Volume K Unit Forecast, by Country 2019 & 2032
- Table 33: China Sarcopenia Treatment Industry Revenue (Million) Forecast, by Application 2019 & 2032
- Table 34: China Sarcopenia Treatment Industry Volume (K Unit) Forecast, by Application 2019 & 2032
- Table 35: Japan Sarcopenia Treatment Industry Revenue (Million) Forecast, by Application 2019 & 2032
- Table 36: Japan Sarcopenia Treatment Industry Volume (K Unit) Forecast, by Application 2019 & 2032
- Table 37: India Sarcopenia Treatment Industry Revenue (Million) Forecast, by Application 2019 & 2032
- Table 38: India Sarcopenia Treatment Industry Volume (K Unit) Forecast, by Application 2019 & 2032
- Table 39: Australia Sarcopenia Treatment Industry Revenue (Million) Forecast, by Application 2019 & 2032
- Table 40: Australia Sarcopenia Treatment Industry Volume (K Unit) Forecast, by Application 2019 & 2032
- Table 41: South Korea Sarcopenia Treatment Industry Revenue (Million) Forecast, by Application 2019 & 2032
- Table 42: South Korea Sarcopenia Treatment Industry Volume (K Unit) Forecast, by Application 2019 & 2032
- Table 43: Rest of Asia Pacific Sarcopenia Treatment Industry Revenue (Million) Forecast, by Application 2019 & 2032
- Table 44: Rest of Asia Pacific Sarcopenia Treatment Industry Volume (K Unit) Forecast, by Application 2019 & 2032
- Table 45: Global Sarcopenia Treatment Industry Revenue Million Forecast, by Country 2019 & 2032
- Table 46: Global Sarcopenia Treatment Industry Volume K Unit Forecast, by Country 2019 & 2032
- Table 47: Sarcopenia Treatment Industry Revenue (Million) Forecast, by Application 2019 & 2032
- Table 48: Sarcopenia Treatment Industry Volume (K Unit) Forecast, by Application 2019 & 2032
- Table 49: Global Sarcopenia Treatment Industry Revenue Million Forecast, by Country 2019 & 2032
- Table 50: Global Sarcopenia Treatment Industry Volume K Unit Forecast, by Country 2019 & 2032
- Table 51: South Africa Sarcopenia Treatment Industry Revenue (Million) Forecast, by Application 2019 & 2032
- Table 52: South Africa Sarcopenia Treatment Industry Volume (K Unit) Forecast, by Application 2019 & 2032
- Table 53: Rest of Middle East Sarcopenia Treatment Industry Revenue (Million) Forecast, by Application 2019 & 2032
- Table 54: Rest of Middle East Sarcopenia Treatment Industry Volume (K Unit) Forecast, by Application 2019 & 2032
- Table 55: Global Sarcopenia Treatment Industry Revenue Million Forecast, by Country 2019 & 2032
- Table 56: Global Sarcopenia Treatment Industry Volume K Unit Forecast, by Country 2019 & 2032
- Table 57: Brazil Sarcopenia Treatment Industry Revenue (Million) Forecast, by Application 2019 & 2032
- Table 58: Brazil Sarcopenia Treatment Industry Volume (K Unit) Forecast, by Application 2019 & 2032
- Table 59: Argentina Sarcopenia Treatment Industry Revenue (Million) Forecast, by Application 2019 & 2032
- Table 60: Argentina Sarcopenia Treatment Industry Volume (K Unit) Forecast, by Application 2019 & 2032
- Table 61: Rest of South America Sarcopenia Treatment Industry Revenue (Million) Forecast, by Application 2019 & 2032
- Table 62: Rest of South America Sarcopenia Treatment Industry Volume (K Unit) Forecast, by Application 2019 & 2032
- Table 63: Global Sarcopenia Treatment Industry Revenue Million Forecast, by Treatment Type 2019 & 2032
- Table 64: Global Sarcopenia Treatment Industry Volume K Unit Forecast, by Treatment Type 2019 & 2032
- Table 65: Global Sarcopenia Treatment Industry Revenue Million Forecast, by Distribution Channel 2019 & 2032
- Table 66: Global Sarcopenia Treatment Industry Volume K Unit Forecast, by Distribution Channel 2019 & 2032
- Table 67: Global Sarcopenia Treatment Industry Revenue Million Forecast, by Country 2019 & 2032
- Table 68: Global Sarcopenia Treatment Industry Volume K Unit Forecast, by Country 2019 & 2032
- Table 69: United States Sarcopenia Treatment Industry Revenue (Million) Forecast, by Application 2019 & 2032
- Table 70: United States Sarcopenia Treatment Industry Volume (K Unit) Forecast, by Application 2019 & 2032
- Table 71: Canada Sarcopenia Treatment Industry Revenue (Million) Forecast, by Application 2019 & 2032
- Table 72: Canada Sarcopenia Treatment Industry Volume (K Unit) Forecast, by Application 2019 & 2032
- Table 73: Mexico Sarcopenia Treatment Industry Revenue (Million) Forecast, by Application 2019 & 2032
- Table 74: Mexico Sarcopenia Treatment Industry Volume (K Unit) Forecast, by Application 2019 & 2032
- Table 75: Global Sarcopenia Treatment Industry Revenue Million Forecast, by Treatment Type 2019 & 2032
- Table 76: Global Sarcopenia Treatment Industry Volume K Unit Forecast, by Treatment Type 2019 & 2032
- Table 77: Global Sarcopenia Treatment Industry Revenue Million Forecast, by Distribution Channel 2019 & 2032
- Table 78: Global Sarcopenia Treatment Industry Volume K Unit Forecast, by Distribution Channel 2019 & 2032
- Table 79: Global Sarcopenia Treatment Industry Revenue Million Forecast, by Country 2019 & 2032
- Table 80: Global Sarcopenia Treatment Industry Volume K Unit Forecast, by Country 2019 & 2032
- Table 81: Germany Sarcopenia Treatment Industry Revenue (Million) Forecast, by Application 2019 & 2032
- Table 82: Germany Sarcopenia Treatment Industry Volume (K Unit) Forecast, by Application 2019 & 2032
- Table 83: United Kingdom Sarcopenia Treatment Industry Revenue (Million) Forecast, by Application 2019 & 2032
- Table 84: United Kingdom Sarcopenia Treatment Industry Volume (K Unit) Forecast, by Application 2019 & 2032
- Table 85: France Sarcopenia Treatment Industry Revenue (Million) Forecast, by Application 2019 & 2032
- Table 86: France Sarcopenia Treatment Industry Volume (K Unit) Forecast, by Application 2019 & 2032
- Table 87: Italy Sarcopenia Treatment Industry Revenue (Million) Forecast, by Application 2019 & 2032
- Table 88: Italy Sarcopenia Treatment Industry Volume (K Unit) Forecast, by Application 2019 & 2032
- Table 89: Spain Sarcopenia Treatment Industry Revenue (Million) Forecast, by Application 2019 & 2032
- Table 90: Spain Sarcopenia Treatment Industry Volume (K Unit) Forecast, by Application 2019 & 2032
- Table 91: Rest of Europe Sarcopenia Treatment Industry Revenue (Million) Forecast, by Application 2019 & 2032
- Table 92: Rest of Europe Sarcopenia Treatment Industry Volume (K Unit) Forecast, by Application 2019 & 2032
- Table 93: Global Sarcopenia Treatment Industry Revenue Million Forecast, by Treatment Type 2019 & 2032
- Table 94: Global Sarcopenia Treatment Industry Volume K Unit Forecast, by Treatment Type 2019 & 2032
- Table 95: Global Sarcopenia Treatment Industry Revenue Million Forecast, by Distribution Channel 2019 & 2032
- Table 96: Global Sarcopenia Treatment Industry Volume K Unit Forecast, by Distribution Channel 2019 & 2032
- Table 97: Global Sarcopenia Treatment Industry Revenue Million Forecast, by Country 2019 & 2032
- Table 98: Global Sarcopenia Treatment Industry Volume K Unit Forecast, by Country 2019 & 2032
- Table 99: China Sarcopenia Treatment Industry Revenue (Million) Forecast, by Application 2019 & 2032
- Table 100: China Sarcopenia Treatment Industry Volume (K Unit) Forecast, by Application 2019 & 2032
- Table 101: Japan Sarcopenia Treatment Industry Revenue (Million) Forecast, by Application 2019 & 2032
- Table 102: Japan Sarcopenia Treatment Industry Volume (K Unit) Forecast, by Application 2019 & 2032
- Table 103: India Sarcopenia Treatment Industry Revenue (Million) Forecast, by Application 2019 & 2032
- Table 104: India Sarcopenia Treatment Industry Volume (K Unit) Forecast, by Application 2019 & 2032
- Table 105: Australia Sarcopenia Treatment Industry Revenue (Million) Forecast, by Application 2019 & 2032
- Table 106: Australia Sarcopenia Treatment Industry Volume (K Unit) Forecast, by Application 2019 & 2032
- Table 107: South Korea Sarcopenia Treatment Industry Revenue (Million) Forecast, by Application 2019 & 2032
- Table 108: South Korea Sarcopenia Treatment Industry Volume (K Unit) Forecast, by Application 2019 & 2032
- Table 109: Rest of Asia Pacific Sarcopenia Treatment Industry Revenue (Million) Forecast, by Application 2019 & 2032
- Table 110: Rest of Asia Pacific Sarcopenia Treatment Industry Volume (K Unit) Forecast, by Application 2019 & 2032
- Table 111: Global Sarcopenia Treatment Industry Revenue Million Forecast, by Treatment Type 2019 & 2032
- Table 112: Global Sarcopenia Treatment Industry Volume K Unit Forecast, by Treatment Type 2019 & 2032
- Table 113: Global Sarcopenia Treatment Industry Revenue Million Forecast, by Distribution Channel 2019 & 2032
- Table 114: Global Sarcopenia Treatment Industry Volume K Unit Forecast, by Distribution Channel 2019 & 2032
- Table 115: Global Sarcopenia Treatment Industry Revenue Million Forecast, by Country 2019 & 2032
- Table 116: Global Sarcopenia Treatment Industry Volume K Unit Forecast, by Country 2019 & 2032
- Table 117: Global Sarcopenia Treatment Industry Revenue Million Forecast, by Treatment Type 2019 & 2032
- Table 118: Global Sarcopenia Treatment Industry Volume K Unit Forecast, by Treatment Type 2019 & 2032
- Table 119: Global Sarcopenia Treatment Industry Revenue Million Forecast, by Distribution Channel 2019 & 2032
- Table 120: Global Sarcopenia Treatment Industry Volume K Unit Forecast, by Distribution Channel 2019 & 2032
- Table 121: Global Sarcopenia Treatment Industry Revenue Million Forecast, by Country 2019 & 2032
- Table 122: Global Sarcopenia Treatment Industry Volume K Unit Forecast, by Country 2019 & 2032
- Table 123: South Africa Sarcopenia Treatment Industry Revenue (Million) Forecast, by Application 2019 & 2032
- Table 124: South Africa Sarcopenia Treatment Industry Volume (K Unit) Forecast, by Application 2019 & 2032
- Table 125: Rest of Middle East Sarcopenia Treatment Industry Revenue (Million) Forecast, by Application 2019 & 2032
- Table 126: Rest of Middle East Sarcopenia Treatment Industry Volume (K Unit) Forecast, by Application 2019 & 2032
- Table 127: Global Sarcopenia Treatment Industry Revenue Million Forecast, by Treatment Type 2019 & 2032
- Table 128: Global Sarcopenia Treatment Industry Volume K Unit Forecast, by Treatment Type 2019 & 2032
- Table 129: Global Sarcopenia Treatment Industry Revenue Million Forecast, by Distribution Channel 2019 & 2032
- Table 130: Global Sarcopenia Treatment Industry Volume K Unit Forecast, by Distribution Channel 2019 & 2032
- Table 131: Global Sarcopenia Treatment Industry Revenue Million Forecast, by Country 2019 & 2032
- Table 132: Global Sarcopenia Treatment Industry Volume K Unit Forecast, by Country 2019 & 2032
- Table 133: Brazil Sarcopenia Treatment Industry Revenue (Million) Forecast, by Application 2019 & 2032
- Table 134: Brazil Sarcopenia Treatment Industry Volume (K Unit) Forecast, by Application 2019 & 2032
- Table 135: Argentina Sarcopenia Treatment Industry Revenue (Million) Forecast, by Application 2019 & 2032
- Table 136: Argentina Sarcopenia Treatment Industry Volume (K Unit) Forecast, by Application 2019 & 2032
- Table 137: Rest of South America Sarcopenia Treatment Industry Revenue (Million) Forecast, by Application 2019 & 2032
- Table 138: Rest of South America Sarcopenia Treatment Industry Volume (K Unit) Forecast, by Application 2019 & 2032
Frequently Asked Questions
1. What is the projected Compound Annual Growth Rate (CAGR) of the Sarcopenia Treatment Industry?
The projected CAGR is approximately 4.48%.
2. Which companies are prominent players in the Sarcopenia Treatment Industry?
Key companies in the market include Sanofi SA, Bayer AG, Novartis AG, Nestle Health Science, Eli Lilly and Company, Haleon Group of Companies, Zydus Life Sciences Limited.
3. What are the main segments of the Sarcopenia Treatment Industry?
The market segments include Treatment Type, Distribution Channel.
4. Can you provide details about the market size?
The market size is estimated to be USD 3.07 Million as of 2022.
5. What are some drivers contributing to market growth?
Increasing Geriatric Population; Rise in Malnutrition and Vitamin Deficiency in Developing Countries.
6. What are the notable trends driving market growth?
Protein Supplement Anticipated to Show Considerable Growth During the Forecast Period.
7. Are there any restraints impacting market growth?
Non-availability of New Drugs.
8. Can you provide examples of recent developments in the market?
July 2023: Biophytis filed for approval from the US Food and Drug Administration (FDA) to launch SARA-31, which is likely to be the first Phase III study in sarcopenia. SARA-31 is expected to evaluate the efficacy and safety of Sarconeos (BIO101) in treating sarcopenic patients at risk of mobility disability.
9. What pricing options are available for accessing the report?
Pricing options include single-user, multi-user, and enterprise licenses priced at USD 4750, USD 5250, and USD 8750 respectively.
10. Is the market size provided in terms of value or volume?
The market size is provided in terms of value, measured in Million and volume, measured in K Unit.
11. Are there any specific market keywords associated with the report?
Yes, the market keyword associated with the report is "Sarcopenia Treatment Industry," which aids in identifying and referencing the specific market segment covered.
12. How do I determine which pricing option suits my needs best?
The pricing options vary based on user requirements and access needs. Individual users may opt for single-user licenses, while businesses requiring broader access may choose multi-user or enterprise licenses for cost-effective access to the report.
13. Are there any additional resources or data provided in the Sarcopenia Treatment Industry report?
While the report offers comprehensive insights, it's advisable to review the specific contents or supplementary materials provided to ascertain if additional resources or data are available.
14. How can I stay updated on further developments or reports in the Sarcopenia Treatment Industry?
To stay informed about further developments, trends, and reports in the Sarcopenia Treatment Industry, consider subscribing to industry newsletters, following relevant companies and organizations, or regularly checking reputable industry news sources and publications.
Methodology
Step 1 - Identification of Relevant Samples Size from Population Database


Step 2 - Approaches for Defining Global Market Size (Value, Volume* & Price*)

Note*: In applicable scenarios
Step 3 - Data Sources
Primary Research
- Web Analytics
- Survey Reports
- Research Institute
- Latest Research Reports
- Opinion Leaders
Secondary Research
- Annual Reports
- White Paper
- Latest Press Release
- Industry Association
- Paid Database
- Investor Presentations

Step 4 - Data Triangulation
Involves using different sources of information in order to increase the validity of a study
These sources are likely to be stakeholders in a program - participants, other researchers, program staff, other community members, and so on.
Then we put all data in single framework & apply various statistical tools to find out the dynamic on the market.
During the analysis stage, feedback from the stakeholder groups would be compared to determine areas of agreement as well as areas of divergence


