
Key Insights
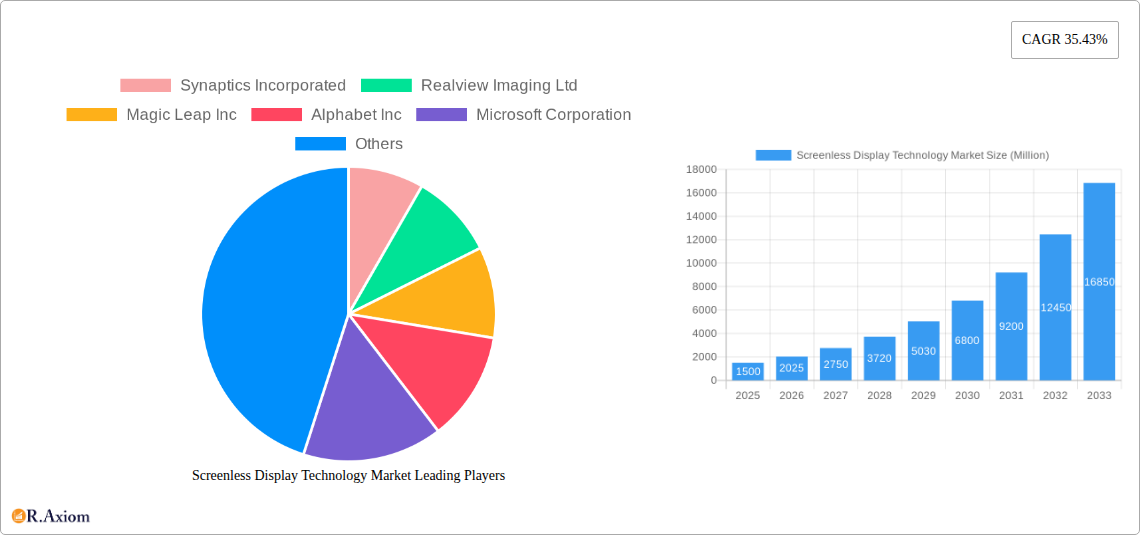
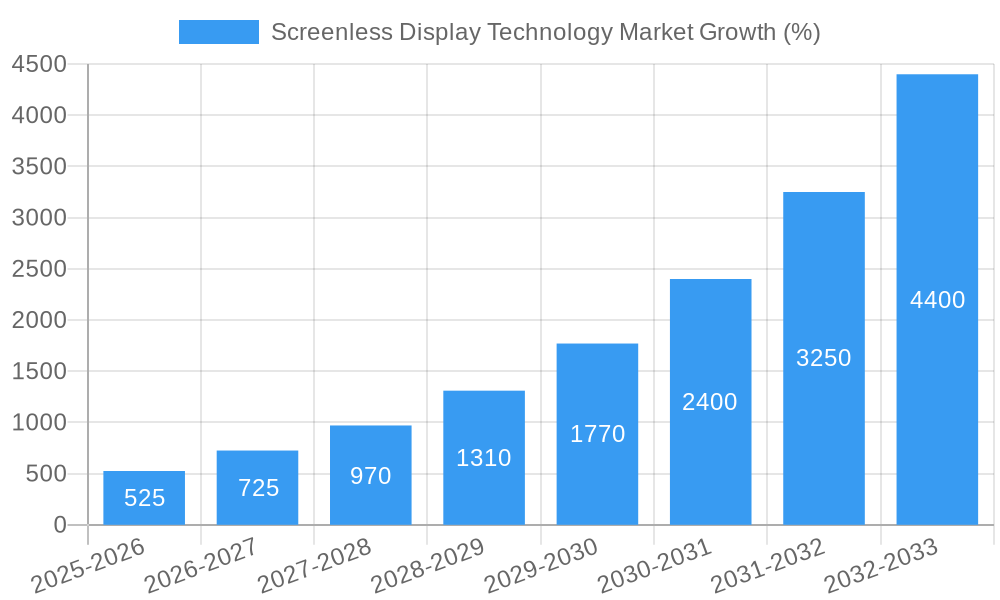
The screenless display technology market is experiencing explosive growth, projected to reach a substantial size driven by several key factors. The market's 35.43% Compound Annual Growth Rate (CAGR) from 2019 to 2024 indicates significant investor and consumer interest. This rapid expansion is fueled by advancements in technologies like visual image processing, retina displays, and synaptic interfaces, leading to more immersive and intuitive user experiences. The increasing adoption of screenless displays across various end-user industries – notably consumer electronics (virtual reality headsets, augmented reality glasses), aerospace & defense (advanced pilot displays), healthcare (surgical simulations), and automotive (heads-up displays) – further contributes to market growth. Technological improvements are lowering costs and increasing the accessibility of this technology, opening up new avenues for adoption. While challenges exist, such as overcoming technological hurdles in creating truly seamless and comfortable user experiences and addressing potential health concerns related to prolonged use of certain technologies, the overall market outlook remains overwhelmingly positive.
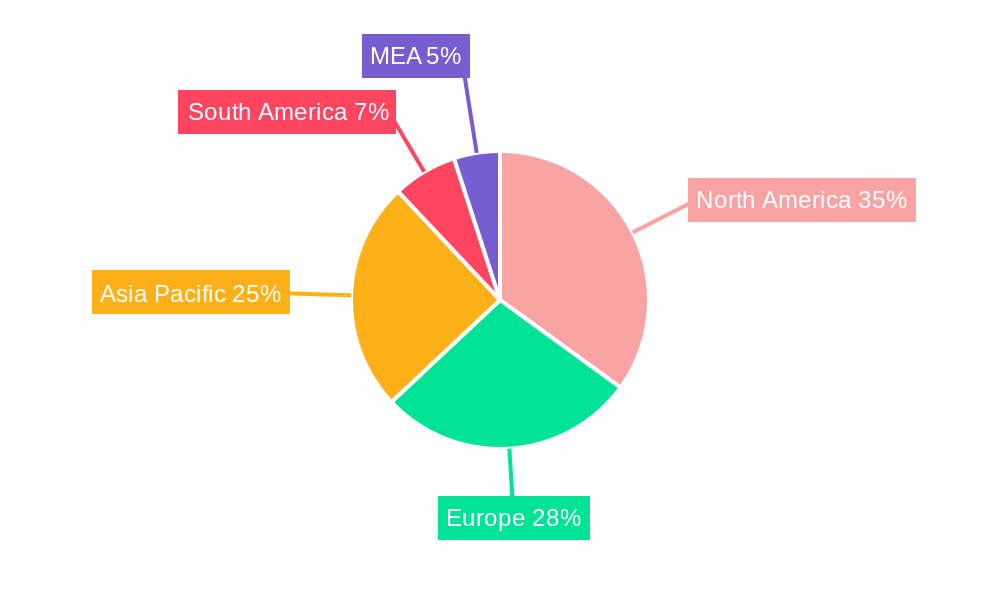
The geographical distribution of this market reveals strong growth across North America, Europe, and the Asia-Pacific region. North America, with its established technological infrastructure and high consumer spending, currently holds a significant market share. However, the Asia-Pacific region, driven by rapidly expanding economies and a burgeoning tech-savvy population, is expected to witness the fastest growth in the coming years. Competition within the market is intense, with established tech giants like Alphabet, Microsoft, and Sony competing alongside innovative startups like Magic Leap and Leia. Strategic partnerships, mergers, and acquisitions are anticipated to shape the market landscape in the near future, leading to further consolidation and innovation. The market's success hinges on continued technological advancements, addressing user concerns regarding comfort and health, and exploring new applications for this transformative technology.
This in-depth report provides a comprehensive analysis of the Screenless Display Technology market, offering valuable insights for industry stakeholders, investors, and strategic decision-makers. The study covers the period from 2019 to 2033, with a focus on the forecast period from 2025 to 2033, and uses 2025 as the base year. The report segments the market by technology (Visual Image, Retina, Synaptic Interface) and end-user industry (Consumer Electronics, Aerospace & Defense, Healthcare, Automotive, Other End-user Industries), providing detailed analysis and projections for each segment. The total market value in 2025 is estimated at xx Million, with a projected Compound Annual Growth Rate (CAGR) of xx% during the forecast period.
Screenless Display Technology Market Concentration & Innovation
The screenless display technology market is characterized by a moderately concentrated landscape, with several key players holding significant market share. Synaptics Incorporated, Microsoft Corporation, and Sony Corporation are among the prominent companies shaping the market's direction, collectively holding an estimated xx% market share in 2025. However, the market also exhibits a high degree of innovation, driven by advancements in areas like augmented reality (AR), virtual reality (VR), and holographic projection. The entrance of new players and the emergence of disruptive technologies continue to reshape the competitive dynamics.
Several factors influence market concentration. These include:
- High R&D investment: Leading companies invest heavily in research and development to maintain their competitive edge.
- Intellectual property: Strong patent portfolios and proprietary technologies act as barriers to entry for new competitors.
- Strategic partnerships and mergers and acquisitions (M&A): M&A activity, with deal values reaching xx Million in recent years, further consolidates market power among leading players. For instance, the acquisition of [Company A] by [Company B] in [Year] significantly impacted market share distribution.
- Regulatory frameworks: Government regulations and standards regarding display technology and data privacy impact market access and development.
- Product substitutes: Existing display technologies, such as traditional LCD and OLED screens, represent a significant challenge to screenless display technology adoption.
- End-user trends: The growing demand for immersive experiences in various sectors, especially consumer electronics, is a key driver of market concentration.
Screenless Display Technology Market Industry Trends & Insights
The screenless display technology market is experiencing significant growth, propelled by several key factors. The increasing adoption of AR and VR technologies across multiple sectors, including gaming, entertainment, and healthcare, is a primary driver. The rising demand for compact and portable devices is also boosting the market’s expansion. Moreover, advancements in areas like micro-LED and holographic projection are enhancing the quality and functionality of screenless displays, further fueling market growth.
Consumer preferences for immersive and intuitive user experiences are impacting the market significantly. The trend towards personalized and interactive content delivery is also shaping product development and market strategies. The competition among leading players is intense, with companies constantly striving to improve resolution, reduce latency, and enhance the overall user experience. This competition is further intensifying through strategic collaborations, technological advancements, and product diversification. The market penetration rate of screenless display technology is projected to increase from xx% in 2025 to xx% by 2033, reflecting the growing consumer adoption. The market is expected to maintain a CAGR of xx% during this period.
Dominant Markets & Segments in Screenless Display Technology Market
The consumer electronics segment is currently the most dominant market for screenless display technology, primarily driven by the increasing popularity of AR/VR headsets and other wearable devices. The Asia-Pacific region stands out as the leading geographical market, owing to its large consumer base, rapidly expanding technological infrastructure, and favorable government policies.
Key Drivers for Dominance:
- Consumer Electronics: High consumer adoption of smartphones, AR/VR devices, and smart glasses fuels demand.
- Asia-Pacific Region: Large population, rising disposable incomes, strong technological advancements, and supportive government initiatives promote market growth.
Dominance Analysis:
The consumer electronics segment's dominance is primarily attributed to the high demand for immersive gaming experiences, interactive entertainment, and augmented reality applications within this sector. The Asia-Pacific region, specifically China and Japan, demonstrates robust growth due to high consumer spending power, sophisticated technological infrastructure, and a thriving startup ecosystem focusing on AR/VR applications. The region's supportive government policies and investments in technology also contribute significantly to market expansion.
Screenless Display Technology Market Product Developments
Recent advancements in screenless display technology have focused on enhancing resolution, reducing latency, and improving the overall user experience. New products incorporate improved image processing algorithms, higher-power light sources, and advanced eye-tracking systems. These advancements are expanding the applications of screenless displays in various sectors, including healthcare (surgical visualization), automotive (heads-up displays), and aerospace & defense (pilot training simulators). The competitive advantage lies in the ability to provide a more immersive, natural, and intuitive user interaction compared to traditional display technologies.
Report Scope & Segmentation Analysis
This report segments the screenless display technology market by technology and end-user industry.
Technology:
- Visual Image: This segment focuses on technologies projecting images directly onto the retina. Growth is driven by advancements in miniaturization and improved image quality, with projected market size of xx Million by 2033. Competition is high, with several companies vying for market share.
- Retina: The retina segment leverages direct retinal projection for a highly immersive experience. It’s characterized by high growth potential and a relatively small, though rapidly expanding, market size of xx Million projected by 2033. This segment is experiencing rapid innovation.
- Synaptic Interface: This segment explores neural interfaces for direct brain-computer interaction, creating a unique market with a smaller size of xx Million by 2033 but high growth potential due to advancements in neuroscience. Competition is limited by the technology's complexity.
End-user Industry:
- Consumer Electronics: This segment represents the largest market segment, driven by the growth of AR/VR devices and smart wearables. The market size is estimated at xx Million in 2025 and is expected to reach xx Million by 2033. The competition is intense with established players and emerging startups.
- Aerospace & Defense: This segment is focused on applications such as pilot training and heads-up displays. The market size is smaller but showcases steady growth, and is projected to reach xx Million by 2033. The focus is on reliability, robustness, and regulatory compliance.
- Healthcare: This segment includes applications for surgical visualization and medical training. The market size is relatively small but presents significant growth opportunities, and is expected to reach xx Million by 2033. Innovation is driven by the need for improved precision and safety.
- Automotive: This segment is growing due to applications such as heads-up displays and augmented reality navigation systems. The market size is expected to grow steadily to xx Million by 2033. Safety and regulatory compliance are primary concerns.
- Other End-user Industries: This segment encompasses various applications such as industrial training and design visualization, with a projected market size of xx Million by 2033. The growth depends on the successful integration into various industries.
Key Drivers of Screenless Display Technology Market Growth
The screenless display technology market is fueled by technological advancements, economic factors, and supportive regulatory environments. The development of more efficient and miniaturized display components, along with improvements in battery technology, is crucial. Increasing consumer demand for immersive experiences, particularly in gaming and entertainment, strongly influences market growth. Furthermore, government support for technological innovation and the adoption of supportive regulations further promote market expansion.
Challenges in the Screenless Display Technology Market Sector
Several factors hinder the growth of the screenless display technology market. High manufacturing costs and the limited availability of specialized components create challenges. Potential health concerns related to prolonged use of certain technologies, as well as the regulatory hurdles and stringent safety standards in certain industries (e.g., aerospace and healthcare), impede adoption. Intense competition from established display technologies also presents a significant challenge.
Emerging Opportunities in Screenless Display Technology Market
The market presents promising opportunities. The expansion into new applications across various industries, coupled with advancements in areas like holographic projection and brain-computer interfaces, unlocks new growth avenues. The increasing integration of screenless displays into existing devices and platforms and the rising interest in personalized and interactive content delivery will further boost the market.
Leading Players in the Screenless Display Technology Market Market
- Synaptics Incorporated
- Realview Imaging Ltd
- Magic Leap Inc
- Alphabet Inc
- Microsoft Corporation
- Sony Corporation
- Eon Reality Inc
- Holoxica Ltd
- Avegant Corporation
- Leia Inc
Key Developments in Screenless Display Technology Industry
- January 2023: Synaptics Incorporated announced a new generation of its retinal projection technology, boasting improved resolution and reduced power consumption.
- March 2024: Magic Leap Inc. secured a significant investment to accelerate the development of its next-generation holographic display system.
- June 2024: Sony Corporation launched a new line of AR glasses designed for industrial applications.
Strategic Outlook for Screenless Display Technology Market Market
The screenless display technology market holds significant future potential, with ongoing technological advancements promising enhanced user experiences and expanded applications across diverse sectors. The increasing demand for immersive technologies, coupled with the development of cost-effective and more accessible solutions, will drive substantial market growth. Companies that successfully innovate and adapt to changing consumer preferences and emerging technologies will secure a dominant position in this rapidly evolving landscape.
Screenless Display Technology Market Segmentation
-
1. Technology
- 1.1. Visual Image
- 1.2. Retina
- 1.3. Synaptic Interface
-
2. End-user Industry
- 2.1. Consumer Electronics
- 2.2. Aerospace & Defense
- 2.3. Healthcare
- 2.4. Automotive
- 2.5. Other End-user Industries
Screenless Display Technology Market Segmentation By Geography
- 1. North America
- 2. Europe
- 3. Asia Pacific
- 4. Latin America
- 5. Middle East
Screenless Display Technology Market REPORT HIGHLIGHTS
| Aspects | Details |
|---|---|
| Study Period | 2019-2033 |
| Base Year | 2024 |
| Estimated Year | 2025 |
| Forecast Period | 2025-2033 |
| Historical Period | 2019-2024 |
| Growth Rate | CAGR of 35.43% from 2019-2033 |
| Segmentation |
|
Table of Contents
- 1. Introduction
- 1.1. Research Scope
- 1.2. Market Segmentation
- 1.3. Research Methodology
- 1.4. Definitions and Assumptions
- 2. Executive Summary
- 2.1. Introduction
- 3. Market Dynamics
- 3.1. Introduction
- 3.2. Market Drivers
- 3.2.1. ; Growth in the Number of Connected Cars; Increase in the Use of 3D Platforms
- 3.3. Market Restrains
- 3.3.1. ; Stringent Regulations and Legal Challenges for Safeguarding Privacy and Security; Lack of In-house Expertise
- 3.4. Market Trends
- 3.4.1. Visual Image Expected to Hold a Significant Share
- 4. Market Factor Analysis
- 4.1. Porters Five Forces
- 4.2. Supply/Value Chain
- 4.3. PESTEL analysis
- 4.4. Market Entropy
- 4.5. Patent/Trademark Analysis
- 5. Global Screenless Display Technology Market Analysis, Insights and Forecast, 2019-2031
- 5.1. Market Analysis, Insights and Forecast - by Technology
- 5.1.1. Visual Image
- 5.1.2. Retina
- 5.1.3. Synaptic Interface
- 5.2. Market Analysis, Insights and Forecast - by End-user Industry
- 5.2.1. Consumer Electronics
- 5.2.2. Aerospace & Defense
- 5.2.3. Healthcare
- 5.2.4. Automotive
- 5.2.5. Other End-user Industries
- 5.3. Market Analysis, Insights and Forecast - by Region
- 5.3.1. North America
- 5.3.2. Europe
- 5.3.3. Asia Pacific
- 5.3.4. Latin America
- 5.3.5. Middle East
- 5.1. Market Analysis, Insights and Forecast - by Technology
- 6. North America Screenless Display Technology Market Analysis, Insights and Forecast, 2019-2031
- 6.1. Market Analysis, Insights and Forecast - by Technology
- 6.1.1. Visual Image
- 6.1.2. Retina
- 6.1.3. Synaptic Interface
- 6.2. Market Analysis, Insights and Forecast - by End-user Industry
- 6.2.1. Consumer Electronics
- 6.2.2. Aerospace & Defense
- 6.2.3. Healthcare
- 6.2.4. Automotive
- 6.2.5. Other End-user Industries
- 6.1. Market Analysis, Insights and Forecast - by Technology
- 7. Europe Screenless Display Technology Market Analysis, Insights and Forecast, 2019-2031
- 7.1. Market Analysis, Insights and Forecast - by Technology
- 7.1.1. Visual Image
- 7.1.2. Retina
- 7.1.3. Synaptic Interface
- 7.2. Market Analysis, Insights and Forecast - by End-user Industry
- 7.2.1. Consumer Electronics
- 7.2.2. Aerospace & Defense
- 7.2.3. Healthcare
- 7.2.4. Automotive
- 7.2.5. Other End-user Industries
- 7.1. Market Analysis, Insights and Forecast - by Technology
- 8. Asia Pacific Screenless Display Technology Market Analysis, Insights and Forecast, 2019-2031
- 8.1. Market Analysis, Insights and Forecast - by Technology
- 8.1.1. Visual Image
- 8.1.2. Retina
- 8.1.3. Synaptic Interface
- 8.2. Market Analysis, Insights and Forecast - by End-user Industry
- 8.2.1. Consumer Electronics
- 8.2.2. Aerospace & Defense
- 8.2.3. Healthcare
- 8.2.4. Automotive
- 8.2.5. Other End-user Industries
- 8.1. Market Analysis, Insights and Forecast - by Technology
- 9. Latin America Screenless Display Technology Market Analysis, Insights and Forecast, 2019-2031
- 9.1. Market Analysis, Insights and Forecast - by Technology
- 9.1.1. Visual Image
- 9.1.2. Retina
- 9.1.3. Synaptic Interface
- 9.2. Market Analysis, Insights and Forecast - by End-user Industry
- 9.2.1. Consumer Electronics
- 9.2.2. Aerospace & Defense
- 9.2.3. Healthcare
- 9.2.4. Automotive
- 9.2.5. Other End-user Industries
- 9.1. Market Analysis, Insights and Forecast - by Technology
- 10. Middle East Screenless Display Technology Market Analysis, Insights and Forecast, 2019-2031
- 10.1. Market Analysis, Insights and Forecast - by Technology
- 10.1.1. Visual Image
- 10.1.2. Retina
- 10.1.3. Synaptic Interface
- 10.2. Market Analysis, Insights and Forecast - by End-user Industry
- 10.2.1. Consumer Electronics
- 10.2.2. Aerospace & Defense
- 10.2.3. Healthcare
- 10.2.4. Automotive
- 10.2.5. Other End-user Industries
- 10.1. Market Analysis, Insights and Forecast - by Technology
- 11. North America Screenless Display Technology Market Analysis, Insights and Forecast, 2019-2031
- 11.1. Market Analysis, Insights and Forecast - By Country/Sub-region
- 11.1.1 United States
- 11.1.2 Canada
- 11.1.3 Mexico
- 12. Europe Screenless Display Technology Market Analysis, Insights and Forecast, 2019-2031
- 12.1. Market Analysis, Insights and Forecast - By Country/Sub-region
- 12.1.1 Germany
- 12.1.2 United Kingdom
- 12.1.3 France
- 12.1.4 Spain
- 12.1.5 Italy
- 12.1.6 Spain
- 12.1.7 Belgium
- 12.1.8 Netherland
- 12.1.9 Nordics
- 12.1.10 Rest of Europe
- 13. Asia Pacific Screenless Display Technology Market Analysis, Insights and Forecast, 2019-2031
- 13.1. Market Analysis, Insights and Forecast - By Country/Sub-region
- 13.1.1 China
- 13.1.2 Japan
- 13.1.3 India
- 13.1.4 South Korea
- 13.1.5 Southeast Asia
- 13.1.6 Australia
- 13.1.7 Indonesia
- 13.1.8 Phillipes
- 13.1.9 Singapore
- 13.1.10 Thailandc
- 13.1.11 Rest of Asia Pacific
- 14. South America Screenless Display Technology Market Analysis, Insights and Forecast, 2019-2031
- 14.1. Market Analysis, Insights and Forecast - By Country/Sub-region
- 14.1.1 Brazil
- 14.1.2 Argentina
- 14.1.3 Peru
- 14.1.4 Chile
- 14.1.5 Colombia
- 14.1.6 Ecuador
- 14.1.7 Venezuela
- 14.1.8 Rest of South America
- 15. North America Screenless Display Technology Market Analysis, Insights and Forecast, 2019-2031
- 15.1. Market Analysis, Insights and Forecast - By Country/Sub-region
- 15.1.1 United States
- 15.1.2 Canada
- 15.1.3 Mexico
- 16. MEA Screenless Display Technology Market Analysis, Insights and Forecast, 2019-2031
- 16.1. Market Analysis, Insights and Forecast - By Country/Sub-region
- 16.1.1 United Arab Emirates
- 16.1.2 Saudi Arabia
- 16.1.3 South Africa
- 16.1.4 Rest of Middle East and Africa
- 17. Competitive Analysis
- 17.1. Global Market Share Analysis 2024
- 17.2. Company Profiles
- 17.2.1 Synaptics Incorporated
- 17.2.1.1. Overview
- 17.2.1.2. Products
- 17.2.1.3. SWOT Analysis
- 17.2.1.4. Recent Developments
- 17.2.1.5. Financials (Based on Availability)
- 17.2.2 Realview Imaging Ltd
- 17.2.2.1. Overview
- 17.2.2.2. Products
- 17.2.2.3. SWOT Analysis
- 17.2.2.4. Recent Developments
- 17.2.2.5. Financials (Based on Availability)
- 17.2.3 Magic Leap Inc
- 17.2.3.1. Overview
- 17.2.3.2. Products
- 17.2.3.3. SWOT Analysis
- 17.2.3.4. Recent Developments
- 17.2.3.5. Financials (Based on Availability)
- 17.2.4 Alphabet Inc
- 17.2.4.1. Overview
- 17.2.4.2. Products
- 17.2.4.3. SWOT Analysis
- 17.2.4.4. Recent Developments
- 17.2.4.5. Financials (Based on Availability)
- 17.2.5 Microsoft Corporation
- 17.2.5.1. Overview
- 17.2.5.2. Products
- 17.2.5.3. SWOT Analysis
- 17.2.5.4. Recent Developments
- 17.2.5.5. Financials (Based on Availability)
- 17.2.6 Sony Corporation
- 17.2.6.1. Overview
- 17.2.6.2. Products
- 17.2.6.3. SWOT Analysis
- 17.2.6.4. Recent Developments
- 17.2.6.5. Financials (Based on Availability)
- 17.2.7 Eon Reality Inc
- 17.2.7.1. Overview
- 17.2.7.2. Products
- 17.2.7.3. SWOT Analysis
- 17.2.7.4. Recent Developments
- 17.2.7.5. Financials (Based on Availability)
- 17.2.8 Holoxica Ltd
- 17.2.8.1. Overview
- 17.2.8.2. Products
- 17.2.8.3. SWOT Analysis
- 17.2.8.4. Recent Developments
- 17.2.8.5. Financials (Based on Availability)
- 17.2.9 Avegant Corporation
- 17.2.9.1. Overview
- 17.2.9.2. Products
- 17.2.9.3. SWOT Analysis
- 17.2.9.4. Recent Developments
- 17.2.9.5. Financials (Based on Availability)
- 17.2.10 Leia Inc
- 17.2.10.1. Overview
- 17.2.10.2. Products
- 17.2.10.3. SWOT Analysis
- 17.2.10.4. Recent Developments
- 17.2.10.5. Financials (Based on Availability)
- 17.2.1 Synaptics Incorporated
List of Figures
- Figure 1: Global Screenless Display Technology Market Revenue Breakdown (Million, %) by Region 2024 & 2032
- Figure 2: Global Screenless Display Technology Market Volume Breakdown (K Unit, %) by Region 2024 & 2032
- Figure 3: North America Screenless Display Technology Market Revenue (Million), by Country 2024 & 2032
- Figure 4: North America Screenless Display Technology Market Volume (K Unit), by Country 2024 & 2032
- Figure 5: North America Screenless Display Technology Market Revenue Share (%), by Country 2024 & 2032
- Figure 6: North America Screenless Display Technology Market Volume Share (%), by Country 2024 & 2032
- Figure 7: Europe Screenless Display Technology Market Revenue (Million), by Country 2024 & 2032
- Figure 8: Europe Screenless Display Technology Market Volume (K Unit), by Country 2024 & 2032
- Figure 9: Europe Screenless Display Technology Market Revenue Share (%), by Country 2024 & 2032
- Figure 10: Europe Screenless Display Technology Market Volume Share (%), by Country 2024 & 2032
- Figure 11: Asia Pacific Screenless Display Technology Market Revenue (Million), by Country 2024 & 2032
- Figure 12: Asia Pacific Screenless Display Technology Market Volume (K Unit), by Country 2024 & 2032
- Figure 13: Asia Pacific Screenless Display Technology Market Revenue Share (%), by Country 2024 & 2032
- Figure 14: Asia Pacific Screenless Display Technology Market Volume Share (%), by Country 2024 & 2032
- Figure 15: South America Screenless Display Technology Market Revenue (Million), by Country 2024 & 2032
- Figure 16: South America Screenless Display Technology Market Volume (K Unit), by Country 2024 & 2032
- Figure 17: South America Screenless Display Technology Market Revenue Share (%), by Country 2024 & 2032
- Figure 18: South America Screenless Display Technology Market Volume Share (%), by Country 2024 & 2032
- Figure 19: North America Screenless Display Technology Market Revenue (Million), by Country 2024 & 2032
- Figure 20: North America Screenless Display Technology Market Volume (K Unit), by Country 2024 & 2032
- Figure 21: North America Screenless Display Technology Market Revenue Share (%), by Country 2024 & 2032
- Figure 22: North America Screenless Display Technology Market Volume Share (%), by Country 2024 & 2032
- Figure 23: MEA Screenless Display Technology Market Revenue (Million), by Country 2024 & 2032
- Figure 24: MEA Screenless Display Technology Market Volume (K Unit), by Country 2024 & 2032
- Figure 25: MEA Screenless Display Technology Market Revenue Share (%), by Country 2024 & 2032
- Figure 26: MEA Screenless Display Technology Market Volume Share (%), by Country 2024 & 2032
- Figure 27: North America Screenless Display Technology Market Revenue (Million), by Technology 2024 & 2032
- Figure 28: North America Screenless Display Technology Market Volume (K Unit), by Technology 2024 & 2032
- Figure 29: North America Screenless Display Technology Market Revenue Share (%), by Technology 2024 & 2032
- Figure 30: North America Screenless Display Technology Market Volume Share (%), by Technology 2024 & 2032
- Figure 31: North America Screenless Display Technology Market Revenue (Million), by End-user Industry 2024 & 2032
- Figure 32: North America Screenless Display Technology Market Volume (K Unit), by End-user Industry 2024 & 2032
- Figure 33: North America Screenless Display Technology Market Revenue Share (%), by End-user Industry 2024 & 2032
- Figure 34: North America Screenless Display Technology Market Volume Share (%), by End-user Industry 2024 & 2032
- Figure 35: North America Screenless Display Technology Market Revenue (Million), by Country 2024 & 2032
- Figure 36: North America Screenless Display Technology Market Volume (K Unit), by Country 2024 & 2032
- Figure 37: North America Screenless Display Technology Market Revenue Share (%), by Country 2024 & 2032
- Figure 38: North America Screenless Display Technology Market Volume Share (%), by Country 2024 & 2032
- Figure 39: Europe Screenless Display Technology Market Revenue (Million), by Technology 2024 & 2032
- Figure 40: Europe Screenless Display Technology Market Volume (K Unit), by Technology 2024 & 2032
- Figure 41: Europe Screenless Display Technology Market Revenue Share (%), by Technology 2024 & 2032
- Figure 42: Europe Screenless Display Technology Market Volume Share (%), by Technology 2024 & 2032
- Figure 43: Europe Screenless Display Technology Market Revenue (Million), by End-user Industry 2024 & 2032
- Figure 44: Europe Screenless Display Technology Market Volume (K Unit), by End-user Industry 2024 & 2032
- Figure 45: Europe Screenless Display Technology Market Revenue Share (%), by End-user Industry 2024 & 2032
- Figure 46: Europe Screenless Display Technology Market Volume Share (%), by End-user Industry 2024 & 2032
- Figure 47: Europe Screenless Display Technology Market Revenue (Million), by Country 2024 & 2032
- Figure 48: Europe Screenless Display Technology Market Volume (K Unit), by Country 2024 & 2032
- Figure 49: Europe Screenless Display Technology Market Revenue Share (%), by Country 2024 & 2032
- Figure 50: Europe Screenless Display Technology Market Volume Share (%), by Country 2024 & 2032
- Figure 51: Asia Pacific Screenless Display Technology Market Revenue (Million), by Technology 2024 & 2032
- Figure 52: Asia Pacific Screenless Display Technology Market Volume (K Unit), by Technology 2024 & 2032
- Figure 53: Asia Pacific Screenless Display Technology Market Revenue Share (%), by Technology 2024 & 2032
- Figure 54: Asia Pacific Screenless Display Technology Market Volume Share (%), by Technology 2024 & 2032
- Figure 55: Asia Pacific Screenless Display Technology Market Revenue (Million), by End-user Industry 2024 & 2032
- Figure 56: Asia Pacific Screenless Display Technology Market Volume (K Unit), by End-user Industry 2024 & 2032
- Figure 57: Asia Pacific Screenless Display Technology Market Revenue Share (%), by End-user Industry 2024 & 2032
- Figure 58: Asia Pacific Screenless Display Technology Market Volume Share (%), by End-user Industry 2024 & 2032
- Figure 59: Asia Pacific Screenless Display Technology Market Revenue (Million), by Country 2024 & 2032
- Figure 60: Asia Pacific Screenless Display Technology Market Volume (K Unit), by Country 2024 & 2032
- Figure 61: Asia Pacific Screenless Display Technology Market Revenue Share (%), by Country 2024 & 2032
- Figure 62: Asia Pacific Screenless Display Technology Market Volume Share (%), by Country 2024 & 2032
- Figure 63: Latin America Screenless Display Technology Market Revenue (Million), by Technology 2024 & 2032
- Figure 64: Latin America Screenless Display Technology Market Volume (K Unit), by Technology 2024 & 2032
- Figure 65: Latin America Screenless Display Technology Market Revenue Share (%), by Technology 2024 & 2032
- Figure 66: Latin America Screenless Display Technology Market Volume Share (%), by Technology 2024 & 2032
- Figure 67: Latin America Screenless Display Technology Market Revenue (Million), by End-user Industry 2024 & 2032
- Figure 68: Latin America Screenless Display Technology Market Volume (K Unit), by End-user Industry 2024 & 2032
- Figure 69: Latin America Screenless Display Technology Market Revenue Share (%), by End-user Industry 2024 & 2032
- Figure 70: Latin America Screenless Display Technology Market Volume Share (%), by End-user Industry 2024 & 2032
- Figure 71: Latin America Screenless Display Technology Market Revenue (Million), by Country 2024 & 2032
- Figure 72: Latin America Screenless Display Technology Market Volume (K Unit), by Country 2024 & 2032
- Figure 73: Latin America Screenless Display Technology Market Revenue Share (%), by Country 2024 & 2032
- Figure 74: Latin America Screenless Display Technology Market Volume Share (%), by Country 2024 & 2032
- Figure 75: Middle East Screenless Display Technology Market Revenue (Million), by Technology 2024 & 2032
- Figure 76: Middle East Screenless Display Technology Market Volume (K Unit), by Technology 2024 & 2032
- Figure 77: Middle East Screenless Display Technology Market Revenue Share (%), by Technology 2024 & 2032
- Figure 78: Middle East Screenless Display Technology Market Volume Share (%), by Technology 2024 & 2032
- Figure 79: Middle East Screenless Display Technology Market Revenue (Million), by End-user Industry 2024 & 2032
- Figure 80: Middle East Screenless Display Technology Market Volume (K Unit), by End-user Industry 2024 & 2032
- Figure 81: Middle East Screenless Display Technology Market Revenue Share (%), by End-user Industry 2024 & 2032
- Figure 82: Middle East Screenless Display Technology Market Volume Share (%), by End-user Industry 2024 & 2032
- Figure 83: Middle East Screenless Display Technology Market Revenue (Million), by Country 2024 & 2032
- Figure 84: Middle East Screenless Display Technology Market Volume (K Unit), by Country 2024 & 2032
- Figure 85: Middle East Screenless Display Technology Market Revenue Share (%), by Country 2024 & 2032
- Figure 86: Middle East Screenless Display Technology Market Volume Share (%), by Country 2024 & 2032
List of Tables
- Table 1: Global Screenless Display Technology Market Revenue Million Forecast, by Region 2019 & 2032
- Table 2: Global Screenless Display Technology Market Volume K Unit Forecast, by Region 2019 & 2032
- Table 3: Global Screenless Display Technology Market Revenue Million Forecast, by Technology 2019 & 2032
- Table 4: Global Screenless Display Technology Market Volume K Unit Forecast, by Technology 2019 & 2032
- Table 5: Global Screenless Display Technology Market Revenue Million Forecast, by End-user Industry 2019 & 2032
- Table 6: Global Screenless Display Technology Market Volume K Unit Forecast, by End-user Industry 2019 & 2032
- Table 7: Global Screenless Display Technology Market Revenue Million Forecast, by Region 2019 & 2032
- Table 8: Global Screenless Display Technology Market Volume K Unit Forecast, by Region 2019 & 2032
- Table 9: Global Screenless Display Technology Market Revenue Million Forecast, by Country 2019 & 2032
- Table 10: Global Screenless Display Technology Market Volume K Unit Forecast, by Country 2019 & 2032
- Table 11: United States Screenless Display Technology Market Revenue (Million) Forecast, by Application 2019 & 2032
- Table 12: United States Screenless Display Technology Market Volume (K Unit) Forecast, by Application 2019 & 2032
- Table 13: Canada Screenless Display Technology Market Revenue (Million) Forecast, by Application 2019 & 2032
- Table 14: Canada Screenless Display Technology Market Volume (K Unit) Forecast, by Application 2019 & 2032
- Table 15: Mexico Screenless Display Technology Market Revenue (Million) Forecast, by Application 2019 & 2032
- Table 16: Mexico Screenless Display Technology Market Volume (K Unit) Forecast, by Application 2019 & 2032
- Table 17: Global Screenless Display Technology Market Revenue Million Forecast, by Country 2019 & 2032
- Table 18: Global Screenless Display Technology Market Volume K Unit Forecast, by Country 2019 & 2032
- Table 19: Germany Screenless Display Technology Market Revenue (Million) Forecast, by Application 2019 & 2032
- Table 20: Germany Screenless Display Technology Market Volume (K Unit) Forecast, by Application 2019 & 2032
- Table 21: United Kingdom Screenless Display Technology Market Revenue (Million) Forecast, by Application 2019 & 2032
- Table 22: United Kingdom Screenless Display Technology Market Volume (K Unit) Forecast, by Application 2019 & 2032
- Table 23: France Screenless Display Technology Market Revenue (Million) Forecast, by Application 2019 & 2032
- Table 24: France Screenless Display Technology Market Volume (K Unit) Forecast, by Application 2019 & 2032
- Table 25: Spain Screenless Display Technology Market Revenue (Million) Forecast, by Application 2019 & 2032
- Table 26: Spain Screenless Display Technology Market Volume (K Unit) Forecast, by Application 2019 & 2032
- Table 27: Italy Screenless Display Technology Market Revenue (Million) Forecast, by Application 2019 & 2032
- Table 28: Italy Screenless Display Technology Market Volume (K Unit) Forecast, by Application 2019 & 2032
- Table 29: Spain Screenless Display Technology Market Revenue (Million) Forecast, by Application 2019 & 2032
- Table 30: Spain Screenless Display Technology Market Volume (K Unit) Forecast, by Application 2019 & 2032
- Table 31: Belgium Screenless Display Technology Market Revenue (Million) Forecast, by Application 2019 & 2032
- Table 32: Belgium Screenless Display Technology Market Volume (K Unit) Forecast, by Application 2019 & 2032
- Table 33: Netherland Screenless Display Technology Market Revenue (Million) Forecast, by Application 2019 & 2032
- Table 34: Netherland Screenless Display Technology Market Volume (K Unit) Forecast, by Application 2019 & 2032
- Table 35: Nordics Screenless Display Technology Market Revenue (Million) Forecast, by Application 2019 & 2032
- Table 36: Nordics Screenless Display Technology Market Volume (K Unit) Forecast, by Application 2019 & 2032
- Table 37: Rest of Europe Screenless Display Technology Market Revenue (Million) Forecast, by Application 2019 & 2032
- Table 38: Rest of Europe Screenless Display Technology Market Volume (K Unit) Forecast, by Application 2019 & 2032
- Table 39: Global Screenless Display Technology Market Revenue Million Forecast, by Country 2019 & 2032
- Table 40: Global Screenless Display Technology Market Volume K Unit Forecast, by Country 2019 & 2032
- Table 41: China Screenless Display Technology Market Revenue (Million) Forecast, by Application 2019 & 2032
- Table 42: China Screenless Display Technology Market Volume (K Unit) Forecast, by Application 2019 & 2032
- Table 43: Japan Screenless Display Technology Market Revenue (Million) Forecast, by Application 2019 & 2032
- Table 44: Japan Screenless Display Technology Market Volume (K Unit) Forecast, by Application 2019 & 2032
- Table 45: India Screenless Display Technology Market Revenue (Million) Forecast, by Application 2019 & 2032
- Table 46: India Screenless Display Technology Market Volume (K Unit) Forecast, by Application 2019 & 2032
- Table 47: South Korea Screenless Display Technology Market Revenue (Million) Forecast, by Application 2019 & 2032
- Table 48: South Korea Screenless Display Technology Market Volume (K Unit) Forecast, by Application 2019 & 2032
- Table 49: Southeast Asia Screenless Display Technology Market Revenue (Million) Forecast, by Application 2019 & 2032
- Table 50: Southeast Asia Screenless Display Technology Market Volume (K Unit) Forecast, by Application 2019 & 2032
- Table 51: Australia Screenless Display Technology Market Revenue (Million) Forecast, by Application 2019 & 2032
- Table 52: Australia Screenless Display Technology Market Volume (K Unit) Forecast, by Application 2019 & 2032
- Table 53: Indonesia Screenless Display Technology Market Revenue (Million) Forecast, by Application 2019 & 2032
- Table 54: Indonesia Screenless Display Technology Market Volume (K Unit) Forecast, by Application 2019 & 2032
- Table 55: Phillipes Screenless Display Technology Market Revenue (Million) Forecast, by Application 2019 & 2032
- Table 56: Phillipes Screenless Display Technology Market Volume (K Unit) Forecast, by Application 2019 & 2032
- Table 57: Singapore Screenless Display Technology Market Revenue (Million) Forecast, by Application 2019 & 2032
- Table 58: Singapore Screenless Display Technology Market Volume (K Unit) Forecast, by Application 2019 & 2032
- Table 59: Thailandc Screenless Display Technology Market Revenue (Million) Forecast, by Application 2019 & 2032
- Table 60: Thailandc Screenless Display Technology Market Volume (K Unit) Forecast, by Application 2019 & 2032
- Table 61: Rest of Asia Pacific Screenless Display Technology Market Revenue (Million) Forecast, by Application 2019 & 2032
- Table 62: Rest of Asia Pacific Screenless Display Technology Market Volume (K Unit) Forecast, by Application 2019 & 2032
- Table 63: Global Screenless Display Technology Market Revenue Million Forecast, by Country 2019 & 2032
- Table 64: Global Screenless Display Technology Market Volume K Unit Forecast, by Country 2019 & 2032
- Table 65: Brazil Screenless Display Technology Market Revenue (Million) Forecast, by Application 2019 & 2032
- Table 66: Brazil Screenless Display Technology Market Volume (K Unit) Forecast, by Application 2019 & 2032
- Table 67: Argentina Screenless Display Technology Market Revenue (Million) Forecast, by Application 2019 & 2032
- Table 68: Argentina Screenless Display Technology Market Volume (K Unit) Forecast, by Application 2019 & 2032
- Table 69: Peru Screenless Display Technology Market Revenue (Million) Forecast, by Application 2019 & 2032
- Table 70: Peru Screenless Display Technology Market Volume (K Unit) Forecast, by Application 2019 & 2032
- Table 71: Chile Screenless Display Technology Market Revenue (Million) Forecast, by Application 2019 & 2032
- Table 72: Chile Screenless Display Technology Market Volume (K Unit) Forecast, by Application 2019 & 2032
- Table 73: Colombia Screenless Display Technology Market Revenue (Million) Forecast, by Application 2019 & 2032
- Table 74: Colombia Screenless Display Technology Market Volume (K Unit) Forecast, by Application 2019 & 2032
- Table 75: Ecuador Screenless Display Technology Market Revenue (Million) Forecast, by Application 2019 & 2032
- Table 76: Ecuador Screenless Display Technology Market Volume (K Unit) Forecast, by Application 2019 & 2032
- Table 77: Venezuela Screenless Display Technology Market Revenue (Million) Forecast, by Application 2019 & 2032
- Table 78: Venezuela Screenless Display Technology Market Volume (K Unit) Forecast, by Application 2019 & 2032
- Table 79: Rest of South America Screenless Display Technology Market Revenue (Million) Forecast, by Application 2019 & 2032
- Table 80: Rest of South America Screenless Display Technology Market Volume (K Unit) Forecast, by Application 2019 & 2032
- Table 81: Global Screenless Display Technology Market Revenue Million Forecast, by Country 2019 & 2032
- Table 82: Global Screenless Display Technology Market Volume K Unit Forecast, by Country 2019 & 2032
- Table 83: United States Screenless Display Technology Market Revenue (Million) Forecast, by Application 2019 & 2032
- Table 84: United States Screenless Display Technology Market Volume (K Unit) Forecast, by Application 2019 & 2032
- Table 85: Canada Screenless Display Technology Market Revenue (Million) Forecast, by Application 2019 & 2032
- Table 86: Canada Screenless Display Technology Market Volume (K Unit) Forecast, by Application 2019 & 2032
- Table 87: Mexico Screenless Display Technology Market Revenue (Million) Forecast, by Application 2019 & 2032
- Table 88: Mexico Screenless Display Technology Market Volume (K Unit) Forecast, by Application 2019 & 2032
- Table 89: Global Screenless Display Technology Market Revenue Million Forecast, by Country 2019 & 2032
- Table 90: Global Screenless Display Technology Market Volume K Unit Forecast, by Country 2019 & 2032
- Table 91: United Arab Emirates Screenless Display Technology Market Revenue (Million) Forecast, by Application 2019 & 2032
- Table 92: United Arab Emirates Screenless Display Technology Market Volume (K Unit) Forecast, by Application 2019 & 2032
- Table 93: Saudi Arabia Screenless Display Technology Market Revenue (Million) Forecast, by Application 2019 & 2032
- Table 94: Saudi Arabia Screenless Display Technology Market Volume (K Unit) Forecast, by Application 2019 & 2032
- Table 95: South Africa Screenless Display Technology Market Revenue (Million) Forecast, by Application 2019 & 2032
- Table 96: South Africa Screenless Display Technology Market Volume (K Unit) Forecast, by Application 2019 & 2032
- Table 97: Rest of Middle East and Africa Screenless Display Technology Market Revenue (Million) Forecast, by Application 2019 & 2032
- Table 98: Rest of Middle East and Africa Screenless Display Technology Market Volume (K Unit) Forecast, by Application 2019 & 2032
- Table 99: Global Screenless Display Technology Market Revenue Million Forecast, by Technology 2019 & 2032
- Table 100: Global Screenless Display Technology Market Volume K Unit Forecast, by Technology 2019 & 2032
- Table 101: Global Screenless Display Technology Market Revenue Million Forecast, by End-user Industry 2019 & 2032
- Table 102: Global Screenless Display Technology Market Volume K Unit Forecast, by End-user Industry 2019 & 2032
- Table 103: Global Screenless Display Technology Market Revenue Million Forecast, by Country 2019 & 2032
- Table 104: Global Screenless Display Technology Market Volume K Unit Forecast, by Country 2019 & 2032
- Table 105: Global Screenless Display Technology Market Revenue Million Forecast, by Technology 2019 & 2032
- Table 106: Global Screenless Display Technology Market Volume K Unit Forecast, by Technology 2019 & 2032
- Table 107: Global Screenless Display Technology Market Revenue Million Forecast, by End-user Industry 2019 & 2032
- Table 108: Global Screenless Display Technology Market Volume K Unit Forecast, by End-user Industry 2019 & 2032
- Table 109: Global Screenless Display Technology Market Revenue Million Forecast, by Country 2019 & 2032
- Table 110: Global Screenless Display Technology Market Volume K Unit Forecast, by Country 2019 & 2032
- Table 111: Global Screenless Display Technology Market Revenue Million Forecast, by Technology 2019 & 2032
- Table 112: Global Screenless Display Technology Market Volume K Unit Forecast, by Technology 2019 & 2032
- Table 113: Global Screenless Display Technology Market Revenue Million Forecast, by End-user Industry 2019 & 2032
- Table 114: Global Screenless Display Technology Market Volume K Unit Forecast, by End-user Industry 2019 & 2032
- Table 115: Global Screenless Display Technology Market Revenue Million Forecast, by Country 2019 & 2032
- Table 116: Global Screenless Display Technology Market Volume K Unit Forecast, by Country 2019 & 2032
- Table 117: Global Screenless Display Technology Market Revenue Million Forecast, by Technology 2019 & 2032
- Table 118: Global Screenless Display Technology Market Volume K Unit Forecast, by Technology 2019 & 2032
- Table 119: Global Screenless Display Technology Market Revenue Million Forecast, by End-user Industry 2019 & 2032
- Table 120: Global Screenless Display Technology Market Volume K Unit Forecast, by End-user Industry 2019 & 2032
- Table 121: Global Screenless Display Technology Market Revenue Million Forecast, by Country 2019 & 2032
- Table 122: Global Screenless Display Technology Market Volume K Unit Forecast, by Country 2019 & 2032
- Table 123: Global Screenless Display Technology Market Revenue Million Forecast, by Technology 2019 & 2032
- Table 124: Global Screenless Display Technology Market Volume K Unit Forecast, by Technology 2019 & 2032
- Table 125: Global Screenless Display Technology Market Revenue Million Forecast, by End-user Industry 2019 & 2032
- Table 126: Global Screenless Display Technology Market Volume K Unit Forecast, by End-user Industry 2019 & 2032
- Table 127: Global Screenless Display Technology Market Revenue Million Forecast, by Country 2019 & 2032
- Table 128: Global Screenless Display Technology Market Volume K Unit Forecast, by Country 2019 & 2032
Frequently Asked Questions
1. What is the projected Compound Annual Growth Rate (CAGR) of the Screenless Display Technology Market?
The projected CAGR is approximately 35.43%.
2. Which companies are prominent players in the Screenless Display Technology Market?
Key companies in the market include Synaptics Incorporated, Realview Imaging Ltd, Magic Leap Inc, Alphabet Inc, Microsoft Corporation, Sony Corporation, Eon Reality Inc, Holoxica Ltd, Avegant Corporation, Leia Inc.
3. What are the main segments of the Screenless Display Technology Market?
The market segments include Technology, End-user Industry.
4. Can you provide details about the market size?
The market size is estimated to be USD XX Million as of 2022.
5. What are some drivers contributing to market growth?
; Growth in the Number of Connected Cars; Increase in the Use of 3D Platforms.
6. What are the notable trends driving market growth?
Visual Image Expected to Hold a Significant Share.
7. Are there any restraints impacting market growth?
; Stringent Regulations and Legal Challenges for Safeguarding Privacy and Security; Lack of In-house Expertise.
8. Can you provide examples of recent developments in the market?
N/A
9. What pricing options are available for accessing the report?
Pricing options include single-user, multi-user, and enterprise licenses priced at USD 4750, USD 5250, and USD 8750 respectively.
10. Is the market size provided in terms of value or volume?
The market size is provided in terms of value, measured in Million and volume, measured in K Unit.
11. Are there any specific market keywords associated with the report?
Yes, the market keyword associated with the report is "Screenless Display Technology Market," which aids in identifying and referencing the specific market segment covered.
12. How do I determine which pricing option suits my needs best?
The pricing options vary based on user requirements and access needs. Individual users may opt for single-user licenses, while businesses requiring broader access may choose multi-user or enterprise licenses for cost-effective access to the report.
13. Are there any additional resources or data provided in the Screenless Display Technology Market report?
While the report offers comprehensive insights, it's advisable to review the specific contents or supplementary materials provided to ascertain if additional resources or data are available.
14. How can I stay updated on further developments or reports in the Screenless Display Technology Market?
To stay informed about further developments, trends, and reports in the Screenless Display Technology Market, consider subscribing to industry newsletters, following relevant companies and organizations, or regularly checking reputable industry news sources and publications.
Methodology
Step 1 - Identification of Relevant Samples Size from Population Database


Step 2 - Approaches for Defining Global Market Size (Value, Volume* & Price*)

Note*: In applicable scenarios
Step 3 - Data Sources
Primary Research
- Web Analytics
- Survey Reports
- Research Institute
- Latest Research Reports
- Opinion Leaders
Secondary Research
- Annual Reports
- White Paper
- Latest Press Release
- Industry Association
- Paid Database
- Investor Presentations

Step 4 - Data Triangulation
Involves using different sources of information in order to increase the validity of a study
These sources are likely to be stakeholders in a program - participants, other researchers, program staff, other community members, and so on.
Then we put all data in single framework & apply various statistical tools to find out the dynamic on the market.
During the analysis stage, feedback from the stakeholder groups would be compared to determine areas of agreement as well as areas of divergence


