
Key Insights
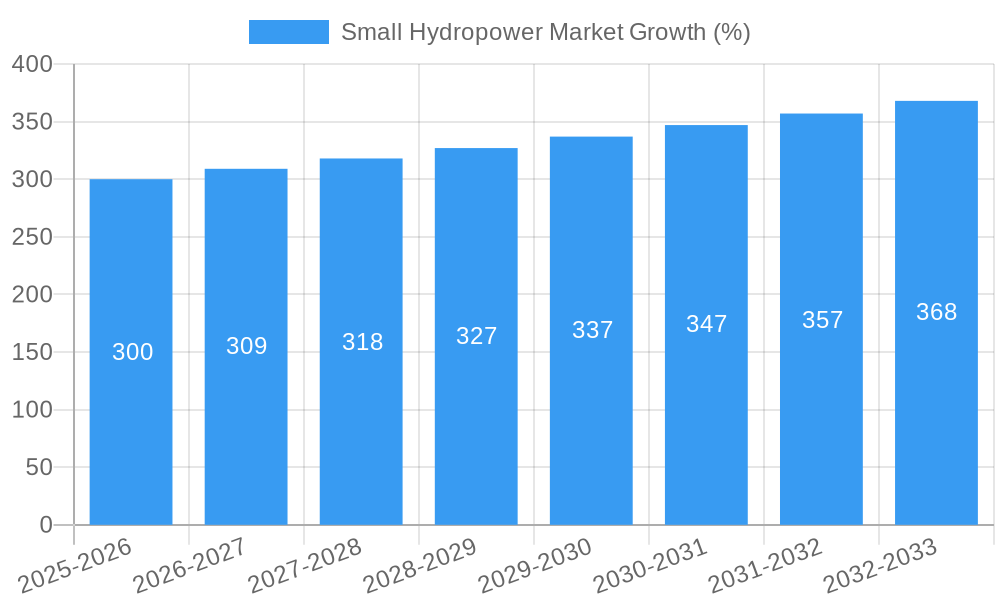
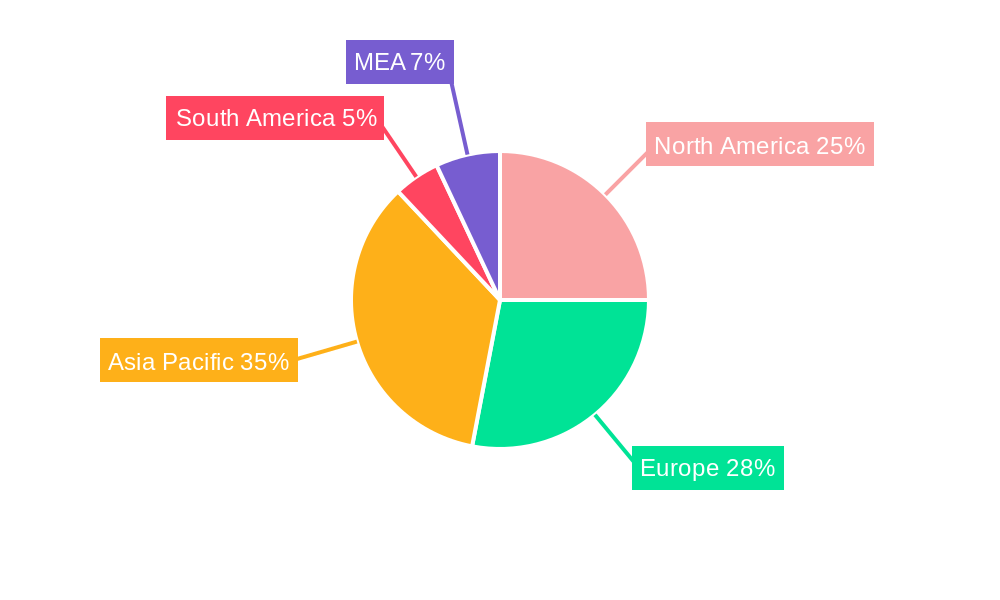
The global small hydropower market, encompassing projects with capacities up to 10 MW, is experiencing robust growth, projected to maintain a CAGR exceeding 2.00% from 2025 to 2033. This expansion is driven by several key factors. Firstly, the increasing global demand for renewable energy sources and the commitment to reducing carbon emissions are significant catalysts. Governments worldwide are implementing supportive policies, including subsidies and tax incentives, to encourage the adoption of small hydropower projects. Furthermore, technological advancements in turbine design and energy storage solutions are enhancing the efficiency and cost-effectiveness of these projects, making them more attractive to both private investors and public utilities. The market is segmented by capacity (up to 1 MW, 1-10 MW) and application (power infrastructure, civil works, other applications), with power infrastructure currently dominating. Geographical growth varies; regions like Asia Pacific, particularly China, India, and Southeast Asia, show considerable potential due to large untapped hydropower resources and rising energy demands. Europe and North America, while already having significant small hydropower installations, continue to witness steady growth fueled by modernization and upgrades of existing facilities.
The market faces certain restraints. Initial capital investment for small hydropower projects can be substantial, presenting a barrier for smaller developers. Environmental concerns related to ecological impacts on rivers and fish populations require careful site selection and mitigation strategies. Regulatory hurdles and permitting processes can also cause delays and increase project costs. However, innovative financing models, improved environmental assessment methodologies, and streamlined regulatory processes are actively addressing these challenges. The presence of established players like Gilbert Gilkes & Gordon Ltd, Toshiba Energy Systems & Solutions Corporation, and Siemens Energy AG, alongside emerging companies like Natel Energy Inc. and FLOVEL Energy Private Limited, indicates a competitive yet dynamic market landscape characterized by ongoing innovation and expansion. Future growth is likely to be shaped by technological advancements, supportive government policies, and effective strategies to mitigate environmental and regulatory challenges.
Small Hydropower Market: A Comprehensive Report (2019-2033)
This in-depth report provides a comprehensive analysis of the Small Hydropower Market from 2019 to 2033, offering invaluable insights for industry stakeholders, investors, and policymakers. The study covers market size, segmentation, growth drivers, challenges, and emerging opportunities, providing actionable intelligence for strategic decision-making. The report utilizes data from 2019-2024 (Historical Period), with 2025 as the Base and Estimated Year. The Forecast Period extends from 2025-2033.
Small Hydropower Market Concentration & Innovation
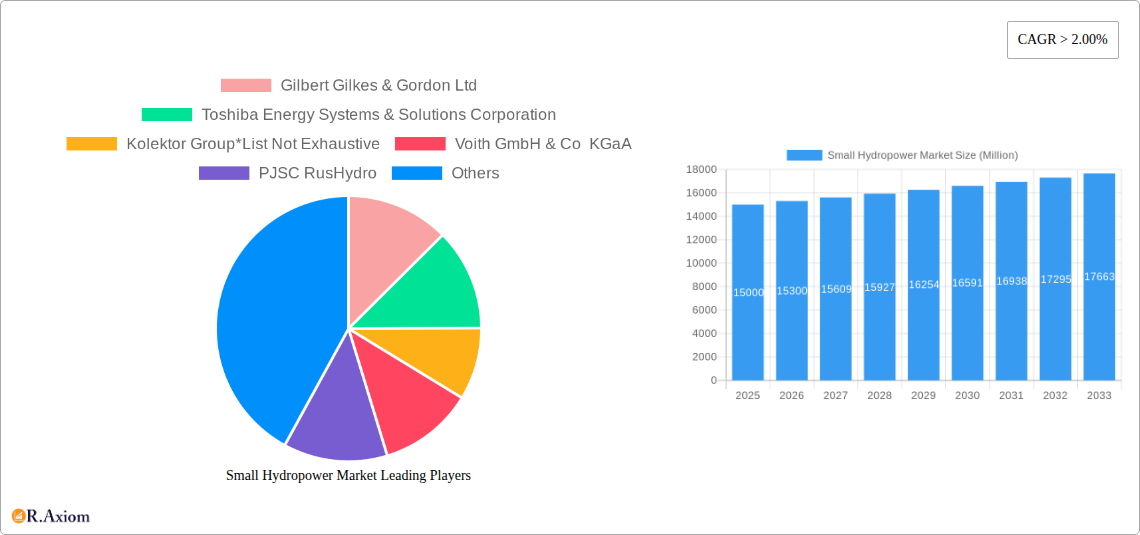
The small hydropower market exhibits a moderately concentrated landscape, with several key players holding significant market share. While precise market share figures for each company are proprietary, Gilbert Gilkes & Gordon Ltd, Toshiba Energy Systems & Solutions Corporation, Voith GmbH & Co KGaA, Siemens Energy AG, GE Renewable Energy, and Andritz AG are recognized as major global players. Smaller, regional players also contribute significantly to the market.
- Market Concentration: The Herfindahl-Hirschman Index (HHI) is estimated to be xx, indicating a moderately concentrated market. Further analysis reveals that the top five players collectively account for approximately xx% of the global market share in 2025.
- Innovation Drivers: Technological advancements in turbine design, improved energy storage solutions, and the integration of smart grids are driving market innovation. The focus on miniaturization and modular designs is reducing installation costs and enhancing accessibility in remote areas.
- Regulatory Frameworks: Supportive government policies, including renewable energy mandates and feed-in tariffs, are crucial in driving market growth. However, inconsistent regulatory frameworks across different regions pose a challenge.
- Product Substitutes: Solar and wind power are primary substitutes. However, small hydropower's reliable and consistent energy output provides a competitive advantage in many scenarios.
- End-User Trends: Increasing demand for renewable energy sources and decentralized power generation is boosting market growth. Rural electrification projects are a significant end-user segment.
- M&A Activities: The market has witnessed a moderate level of mergers and acquisitions, primarily focused on expanding geographical reach and technological capabilities. Total M&A deal value in the past five years is estimated at xx Million.
Small Hydropower Market Industry Trends & Insights
The small hydropower market is experiencing robust growth, driven by increasing global energy demand, the need for renewable energy diversification, and supportive government policies. The Compound Annual Growth Rate (CAGR) is projected to be xx% during the forecast period (2025-2033). Market penetration of small hydropower within the broader renewable energy sector is estimated at xx% in 2025 and expected to reach xx% by 2033. Technological disruptions, such as advancements in turbine technology and improved grid integration capabilities, are further fueling market expansion. Consumer preferences are shifting towards sustainable and environmentally friendly energy sources, creating a favorable environment for small hydropower. Competitive dynamics are largely shaped by technological innovation, cost competitiveness, and the ability to secure project financing.
Dominant Markets & Segments in Small Hydropower Market
The Asia-Pacific region dominates the small hydropower market, driven by large-scale infrastructure development, increasing energy demand, and supportive government policies. China and India are particularly significant markets within this region.
Capacity: The 1-10 MW segment holds the largest market share, fueled by larger-scale projects capable of supplying significant power to grids. However, the Up to 1 MW segment is witnessing strong growth due to increasing off-grid applications and the ease of deployment in remote locations.
Application: Power infrastructure projects account for the largest market share. Civil works applications are also growing steadily, with small hydropower plants being integrated into irrigation and water management systems. Other applications, such as industrial power generation, are niche but growing segments.
Key Drivers (Asia-Pacific):
- Favorable government policies and incentives for renewable energy adoption.
- Robust economic growth and increasing energy demand.
- Extensive river systems and suitable geographical locations.
- Growing focus on rural electrification.
Small Hydropower Market Product Developments
Recent product innovations include the development of higher-efficiency turbines, improved control systems for optimized energy generation, and advanced grid integration technologies. These advancements enhance reliability, reduce operational costs, and improve overall system efficiency. Modular designs are gaining traction due to ease of transportation and installation, particularly in remote areas. The market is moving towards smart hydropower systems, incorporating IoT capabilities for remote monitoring and predictive maintenance.
Report Scope & Segmentation Analysis
This report segments the small hydropower market by capacity (Up to 1 MW, 1-10 MW) and application (Power Infrastructure, Civil Works, Other Applications). The Up to 1 MW segment is projected to grow at a CAGR of xx% from 2025 to 2033, driven by off-grid applications. The 1-10 MW segment is expected to grow at a CAGR of xx%, driven by grid-connected projects. The power infrastructure application is expected to maintain its dominance, while civil works and other applications will experience significant growth due to increasing demand for integrated water management systems and decentralized power solutions. Competitive dynamics vary across segments, with larger players dominating the 1-10 MW segment and a mix of larger and smaller players in the Up to 1 MW segment.
Key Drivers of Small Hydropower Market Growth
Several factors are driving market growth:
- Increasing Demand for Renewable Energy: Global efforts to reduce carbon emissions and enhance energy security are fueling demand for renewable energy sources, making small hydropower attractive.
- Government Support and Policies: Many governments provide incentives and subsidies to promote renewable energy development, including small hydropower projects.
- Technological Advancements: Innovations in turbine technology and grid integration are improving the efficiency, reliability, and cost-effectiveness of small hydropower systems.
Challenges in the Small Hydropower Market Sector
Several challenges hinder market growth:
- High Initial Investment Costs: The initial capital expenditure for small hydropower projects can be significant, especially in remote areas.
- Environmental Concerns: Potential environmental impacts, such as changes to river ecosystems, require careful assessment and mitigation.
- Regulatory Hurdles: Complex permitting processes and inconsistent regulations can delay project development and increase costs. The average permitting time is estimated at xx months, impacting project timelines.
Emerging Opportunities in Small Hydropower Market
Emerging opportunities include:
- Hybrid Systems: Integrating small hydropower with other renewable energy sources, such as solar and wind, creating more resilient and efficient systems.
- Mini-grids: Expanding small hydropower's reach through the development of mini-grids in rural and remote areas, promoting electrification and energy access.
- Energy Storage Solutions: Integrating energy storage systems with small hydropower plants to address intermittency challenges and improve grid stability.
Leading Players in the Small Hydropower Market Market
- Gilbert Gilkes & Gordon Ltd
- Toshiba Energy Systems & Solutions Corporation
- Kolektor Group
- Voith GmbH & Co KGaA
- PJSC RusHydro
- Siemens Energy AG
- Natel Energy Inc
- GE Renewable Energy
- Andritz AG
- FLOVEL Energy Private Limited
Key Developments in Small Hydropower Market Industry
- July 2022: SMEC, along with Tellhow International Engineering & Contracting Co Ltd, secured a contract to review and modify the design of three small hydropower plants in East Malaysia (29.1 MW total capacity). This highlights the ongoing development and modification activities within the industry.
- July 2022: The Development Bank of the Philippines approved USD 12.0 Million in funding for the 4.6 MW Dupinga Mini Hydropower project, showcasing the importance of financing in driving project development and contributing to the government's renewable energy targets.
Strategic Outlook for Small Hydropower Market Market
The small hydropower market holds significant growth potential driven by the increasing global demand for renewable energy, supportive government policies, and continuous technological advancements. The focus on miniaturization, modular designs, and hybrid systems will create further opportunities. The market is expected to witness substantial growth over the next decade, with significant contributions from both developed and developing countries. Addressing challenges related to financing, environmental impact, and regulatory frameworks will be crucial to unlocking the full potential of the market.
Small Hydropower Market Segmentation
-
1. Capacity
- 1.1. Up to 1 MW
- 1.2. 1-10 MW
-
2. Application
- 2.1. Power Infrastructure
- 2.2. Civil Works
- 2.3. Other Applications
Small Hydropower Market Segmentation By Geography
-
1. North America
- 1.1. United States
- 1.2. Canada
- 1.3. Rest of North America
-
2. Europe
- 2.1. Germany
- 2.2. United Kingdom
- 2.3. France
- 2.4. Italy
- 2.5. Spain
- 2.6. Nordic
- 2.7. Turkey
- 2.8. Russia
- 2.9. Rest of Europe
-
3. Asia Pacific
- 3.1. China
- 3.2. India
- 3.3. Japan
- 3.4. South Korea
- 3.5. Malaysia
- 3.6. Thailand
- 3.7. Vietnam
- 3.8. Rest of Asia Pacific
-
4. Middle East and Africa
- 4.1. Saudi Arabia
- 4.2. United Arab Emirates
- 4.3. Nigeria
- 4.4. Egypt
- 4.5. South Africa
- 4.6. Rest of Middle East and Africa
-
5. South America
- 5.1. Brazil
- 5.2. Argentina
- 5.3. Colombia
- 5.4. Rest of South America
Small Hydropower Market REPORT HIGHLIGHTS
| Aspects | Details |
|---|---|
| Study Period | 2019-2033 |
| Base Year | 2024 |
| Estimated Year | 2025 |
| Forecast Period | 2025-2033 |
| Historical Period | 2019-2024 |
| Growth Rate | CAGR of > 2.00% from 2019-2033 |
| Segmentation |
|
Table of Contents
- 1. Introduction
- 1.1. Research Scope
- 1.2. Market Segmentation
- 1.3. Research Methodology
- 1.4. Definitions and Assumptions
- 2. Executive Summary
- 2.1. Introduction
- 3. Market Dynamics
- 3.1. Introduction
- 3.2. Market Drivers
- 3.2.1. 4.; Growing Emphasis on Renewable Energy Integration4.; Significant Hydropower Potential
- 3.3. Market Restrains
- 3.3.1. 4.; Competition From Other Energy Storage Technologies
- 3.4. Market Trends
- 3.4.1. The 1-10 MW Segment Expected to Dominate the Market
- 4. Market Factor Analysis
- 4.1. Porters Five Forces
- 4.2. Supply/Value Chain
- 4.3. PESTEL analysis
- 4.4. Market Entropy
- 4.5. Patent/Trademark Analysis
- 5. Global Small Hydropower Market Analysis, Insights and Forecast, 2019-2031
- 5.1. Market Analysis, Insights and Forecast - by Capacity
- 5.1.1. Up to 1 MW
- 5.1.2. 1-10 MW
- 5.2. Market Analysis, Insights and Forecast - by Application
- 5.2.1. Power Infrastructure
- 5.2.2. Civil Works
- 5.2.3. Other Applications
- 5.3. Market Analysis, Insights and Forecast - by Region
- 5.3.1. North America
- 5.3.2. Europe
- 5.3.3. Asia Pacific
- 5.3.4. Middle East and Africa
- 5.3.5. South America
- 5.1. Market Analysis, Insights and Forecast - by Capacity
- 6. North America Small Hydropower Market Analysis, Insights and Forecast, 2019-2031
- 6.1. Market Analysis, Insights and Forecast - by Capacity
- 6.1.1. Up to 1 MW
- 6.1.2. 1-10 MW
- 6.2. Market Analysis, Insights and Forecast - by Application
- 6.2.1. Power Infrastructure
- 6.2.2. Civil Works
- 6.2.3. Other Applications
- 6.1. Market Analysis, Insights and Forecast - by Capacity
- 7. Europe Small Hydropower Market Analysis, Insights and Forecast, 2019-2031
- 7.1. Market Analysis, Insights and Forecast - by Capacity
- 7.1.1. Up to 1 MW
- 7.1.2. 1-10 MW
- 7.2. Market Analysis, Insights and Forecast - by Application
- 7.2.1. Power Infrastructure
- 7.2.2. Civil Works
- 7.2.3. Other Applications
- 7.1. Market Analysis, Insights and Forecast - by Capacity
- 8. Asia Pacific Small Hydropower Market Analysis, Insights and Forecast, 2019-2031
- 8.1. Market Analysis, Insights and Forecast - by Capacity
- 8.1.1. Up to 1 MW
- 8.1.2. 1-10 MW
- 8.2. Market Analysis, Insights and Forecast - by Application
- 8.2.1. Power Infrastructure
- 8.2.2. Civil Works
- 8.2.3. Other Applications
- 8.1. Market Analysis, Insights and Forecast - by Capacity
- 9. Middle East and Africa Small Hydropower Market Analysis, Insights and Forecast, 2019-2031
- 9.1. Market Analysis, Insights and Forecast - by Capacity
- 9.1.1. Up to 1 MW
- 9.1.2. 1-10 MW
- 9.2. Market Analysis, Insights and Forecast - by Application
- 9.2.1. Power Infrastructure
- 9.2.2. Civil Works
- 9.2.3. Other Applications
- 9.1. Market Analysis, Insights and Forecast - by Capacity
- 10. South America Small Hydropower Market Analysis, Insights and Forecast, 2019-2031
- 10.1. Market Analysis, Insights and Forecast - by Capacity
- 10.1.1. Up to 1 MW
- 10.1.2. 1-10 MW
- 10.2. Market Analysis, Insights and Forecast - by Application
- 10.2.1. Power Infrastructure
- 10.2.2. Civil Works
- 10.2.3. Other Applications
- 10.1. Market Analysis, Insights and Forecast - by Capacity
- 11. North America Small Hydropower Market Analysis, Insights and Forecast, 2019-2031
- 11.1. Market Analysis, Insights and Forecast - By Country/Sub-region
- 11.1.1 United States
- 11.1.2 Canada
- 11.1.3 Mexico
- 12. Europe Small Hydropower Market Analysis, Insights and Forecast, 2019-2031
- 12.1. Market Analysis, Insights and Forecast - By Country/Sub-region
- 12.1.1 Germany
- 12.1.2 United Kingdom
- 12.1.3 France
- 12.1.4 Spain
- 12.1.5 Italy
- 12.1.6 Spain
- 12.1.7 Belgium
- 12.1.8 Netherland
- 12.1.9 Nordics
- 12.1.10 Rest of Europe
- 13. Asia Pacific Small Hydropower Market Analysis, Insights and Forecast, 2019-2031
- 13.1. Market Analysis, Insights and Forecast - By Country/Sub-region
- 13.1.1 China
- 13.1.2 Japan
- 13.1.3 India
- 13.1.4 South Korea
- 13.1.5 Southeast Asia
- 13.1.6 Australia
- 13.1.7 Indonesia
- 13.1.8 Phillipes
- 13.1.9 Singapore
- 13.1.10 Thailandc
- 13.1.11 Rest of Asia Pacific
- 14. South America Small Hydropower Market Analysis, Insights and Forecast, 2019-2031
- 14.1. Market Analysis, Insights and Forecast - By Country/Sub-region
- 14.1.1 Brazil
- 14.1.2 Argentina
- 14.1.3 Peru
- 14.1.4 Chile
- 14.1.5 Colombia
- 14.1.6 Ecuador
- 14.1.7 Venezuela
- 14.1.8 Rest of South America
- 15. North America Small Hydropower Market Analysis, Insights and Forecast, 2019-2031
- 15.1. Market Analysis, Insights and Forecast - By Country/Sub-region
- 15.1.1 United States
- 15.1.2 Canada
- 15.1.3 Mexico
- 16. MEA Small Hydropower Market Analysis, Insights and Forecast, 2019-2031
- 16.1. Market Analysis, Insights and Forecast - By Country/Sub-region
- 16.1.1 United Arab Emirates
- 16.1.2 Saudi Arabia
- 16.1.3 South Africa
- 16.1.4 Rest of Middle East and Africa
- 17. Competitive Analysis
- 17.1. Global Market Share Analysis 2024
- 17.2. Company Profiles
- 17.2.1 Gilbert Gilkes & Gordon Ltd
- 17.2.1.1. Overview
- 17.2.1.2. Products
- 17.2.1.3. SWOT Analysis
- 17.2.1.4. Recent Developments
- 17.2.1.5. Financials (Based on Availability)
- 17.2.2 Toshiba Energy Systems & Solutions Corporation
- 17.2.2.1. Overview
- 17.2.2.2. Products
- 17.2.2.3. SWOT Analysis
- 17.2.2.4. Recent Developments
- 17.2.2.5. Financials (Based on Availability)
- 17.2.3 Kolektor Group*List Not Exhaustive
- 17.2.3.1. Overview
- 17.2.3.2. Products
- 17.2.3.3. SWOT Analysis
- 17.2.3.4. Recent Developments
- 17.2.3.5. Financials (Based on Availability)
- 17.2.4 Voith GmbH & Co KGaA
- 17.2.4.1. Overview
- 17.2.4.2. Products
- 17.2.4.3. SWOT Analysis
- 17.2.4.4. Recent Developments
- 17.2.4.5. Financials (Based on Availability)
- 17.2.5 PJSC RusHydro
- 17.2.5.1. Overview
- 17.2.5.2. Products
- 17.2.5.3. SWOT Analysis
- 17.2.5.4. Recent Developments
- 17.2.5.5. Financials (Based on Availability)
- 17.2.6 Siemens Energy AG
- 17.2.6.1. Overview
- 17.2.6.2. Products
- 17.2.6.3. SWOT Analysis
- 17.2.6.4. Recent Developments
- 17.2.6.5. Financials (Based on Availability)
- 17.2.7 Natel Energy Inc
- 17.2.7.1. Overview
- 17.2.7.2. Products
- 17.2.7.3. SWOT Analysis
- 17.2.7.4. Recent Developments
- 17.2.7.5. Financials (Based on Availability)
- 17.2.8 GE Renewable Energy
- 17.2.8.1. Overview
- 17.2.8.2. Products
- 17.2.8.3. SWOT Analysis
- 17.2.8.4. Recent Developments
- 17.2.8.5. Financials (Based on Availability)
- 17.2.9 Andritz AG
- 17.2.9.1. Overview
- 17.2.9.2. Products
- 17.2.9.3. SWOT Analysis
- 17.2.9.4. Recent Developments
- 17.2.9.5. Financials (Based on Availability)
- 17.2.10 FLOVEL Energy Private Limited
- 17.2.10.1. Overview
- 17.2.10.2. Products
- 17.2.10.3. SWOT Analysis
- 17.2.10.4. Recent Developments
- 17.2.10.5. Financials (Based on Availability)
- 17.2.1 Gilbert Gilkes & Gordon Ltd
List of Figures
- Figure 1: Global Small Hydropower Market Revenue Breakdown (Million, %) by Region 2024 & 2032
- Figure 2: Global Small Hydropower Market Volume Breakdown (gigawatt, %) by Region 2024 & 2032
- Figure 3: North America Small Hydropower Market Revenue (Million), by Country 2024 & 2032
- Figure 4: North America Small Hydropower Market Volume (gigawatt), by Country 2024 & 2032
- Figure 5: North America Small Hydropower Market Revenue Share (%), by Country 2024 & 2032
- Figure 6: North America Small Hydropower Market Volume Share (%), by Country 2024 & 2032
- Figure 7: Europe Small Hydropower Market Revenue (Million), by Country 2024 & 2032
- Figure 8: Europe Small Hydropower Market Volume (gigawatt), by Country 2024 & 2032
- Figure 9: Europe Small Hydropower Market Revenue Share (%), by Country 2024 & 2032
- Figure 10: Europe Small Hydropower Market Volume Share (%), by Country 2024 & 2032
- Figure 11: Asia Pacific Small Hydropower Market Revenue (Million), by Country 2024 & 2032
- Figure 12: Asia Pacific Small Hydropower Market Volume (gigawatt), by Country 2024 & 2032
- Figure 13: Asia Pacific Small Hydropower Market Revenue Share (%), by Country 2024 & 2032
- Figure 14: Asia Pacific Small Hydropower Market Volume Share (%), by Country 2024 & 2032
- Figure 15: South America Small Hydropower Market Revenue (Million), by Country 2024 & 2032
- Figure 16: South America Small Hydropower Market Volume (gigawatt), by Country 2024 & 2032
- Figure 17: South America Small Hydropower Market Revenue Share (%), by Country 2024 & 2032
- Figure 18: South America Small Hydropower Market Volume Share (%), by Country 2024 & 2032
- Figure 19: North America Small Hydropower Market Revenue (Million), by Country 2024 & 2032
- Figure 20: North America Small Hydropower Market Volume (gigawatt), by Country 2024 & 2032
- Figure 21: North America Small Hydropower Market Revenue Share (%), by Country 2024 & 2032
- Figure 22: North America Small Hydropower Market Volume Share (%), by Country 2024 & 2032
- Figure 23: MEA Small Hydropower Market Revenue (Million), by Country 2024 & 2032
- Figure 24: MEA Small Hydropower Market Volume (gigawatt), by Country 2024 & 2032
- Figure 25: MEA Small Hydropower Market Revenue Share (%), by Country 2024 & 2032
- Figure 26: MEA Small Hydropower Market Volume Share (%), by Country 2024 & 2032
- Figure 27: North America Small Hydropower Market Revenue (Million), by Capacity 2024 & 2032
- Figure 28: North America Small Hydropower Market Volume (gigawatt), by Capacity 2024 & 2032
- Figure 29: North America Small Hydropower Market Revenue Share (%), by Capacity 2024 & 2032
- Figure 30: North America Small Hydropower Market Volume Share (%), by Capacity 2024 & 2032
- Figure 31: North America Small Hydropower Market Revenue (Million), by Application 2024 & 2032
- Figure 32: North America Small Hydropower Market Volume (gigawatt), by Application 2024 & 2032
- Figure 33: North America Small Hydropower Market Revenue Share (%), by Application 2024 & 2032
- Figure 34: North America Small Hydropower Market Volume Share (%), by Application 2024 & 2032
- Figure 35: North America Small Hydropower Market Revenue (Million), by Country 2024 & 2032
- Figure 36: North America Small Hydropower Market Volume (gigawatt), by Country 2024 & 2032
- Figure 37: North America Small Hydropower Market Revenue Share (%), by Country 2024 & 2032
- Figure 38: North America Small Hydropower Market Volume Share (%), by Country 2024 & 2032
- Figure 39: Europe Small Hydropower Market Revenue (Million), by Capacity 2024 & 2032
- Figure 40: Europe Small Hydropower Market Volume (gigawatt), by Capacity 2024 & 2032
- Figure 41: Europe Small Hydropower Market Revenue Share (%), by Capacity 2024 & 2032
- Figure 42: Europe Small Hydropower Market Volume Share (%), by Capacity 2024 & 2032
- Figure 43: Europe Small Hydropower Market Revenue (Million), by Application 2024 & 2032
- Figure 44: Europe Small Hydropower Market Volume (gigawatt), by Application 2024 & 2032
- Figure 45: Europe Small Hydropower Market Revenue Share (%), by Application 2024 & 2032
- Figure 46: Europe Small Hydropower Market Volume Share (%), by Application 2024 & 2032
- Figure 47: Europe Small Hydropower Market Revenue (Million), by Country 2024 & 2032
- Figure 48: Europe Small Hydropower Market Volume (gigawatt), by Country 2024 & 2032
- Figure 49: Europe Small Hydropower Market Revenue Share (%), by Country 2024 & 2032
- Figure 50: Europe Small Hydropower Market Volume Share (%), by Country 2024 & 2032
- Figure 51: Asia Pacific Small Hydropower Market Revenue (Million), by Capacity 2024 & 2032
- Figure 52: Asia Pacific Small Hydropower Market Volume (gigawatt), by Capacity 2024 & 2032
- Figure 53: Asia Pacific Small Hydropower Market Revenue Share (%), by Capacity 2024 & 2032
- Figure 54: Asia Pacific Small Hydropower Market Volume Share (%), by Capacity 2024 & 2032
- Figure 55: Asia Pacific Small Hydropower Market Revenue (Million), by Application 2024 & 2032
- Figure 56: Asia Pacific Small Hydropower Market Volume (gigawatt), by Application 2024 & 2032
- Figure 57: Asia Pacific Small Hydropower Market Revenue Share (%), by Application 2024 & 2032
- Figure 58: Asia Pacific Small Hydropower Market Volume Share (%), by Application 2024 & 2032
- Figure 59: Asia Pacific Small Hydropower Market Revenue (Million), by Country 2024 & 2032
- Figure 60: Asia Pacific Small Hydropower Market Volume (gigawatt), by Country 2024 & 2032
- Figure 61: Asia Pacific Small Hydropower Market Revenue Share (%), by Country 2024 & 2032
- Figure 62: Asia Pacific Small Hydropower Market Volume Share (%), by Country 2024 & 2032
- Figure 63: Middle East and Africa Small Hydropower Market Revenue (Million), by Capacity 2024 & 2032
- Figure 64: Middle East and Africa Small Hydropower Market Volume (gigawatt), by Capacity 2024 & 2032
- Figure 65: Middle East and Africa Small Hydropower Market Revenue Share (%), by Capacity 2024 & 2032
- Figure 66: Middle East and Africa Small Hydropower Market Volume Share (%), by Capacity 2024 & 2032
- Figure 67: Middle East and Africa Small Hydropower Market Revenue (Million), by Application 2024 & 2032
- Figure 68: Middle East and Africa Small Hydropower Market Volume (gigawatt), by Application 2024 & 2032
- Figure 69: Middle East and Africa Small Hydropower Market Revenue Share (%), by Application 2024 & 2032
- Figure 70: Middle East and Africa Small Hydropower Market Volume Share (%), by Application 2024 & 2032
- Figure 71: Middle East and Africa Small Hydropower Market Revenue (Million), by Country 2024 & 2032
- Figure 72: Middle East and Africa Small Hydropower Market Volume (gigawatt), by Country 2024 & 2032
- Figure 73: Middle East and Africa Small Hydropower Market Revenue Share (%), by Country 2024 & 2032
- Figure 74: Middle East and Africa Small Hydropower Market Volume Share (%), by Country 2024 & 2032
- Figure 75: South America Small Hydropower Market Revenue (Million), by Capacity 2024 & 2032
- Figure 76: South America Small Hydropower Market Volume (gigawatt), by Capacity 2024 & 2032
- Figure 77: South America Small Hydropower Market Revenue Share (%), by Capacity 2024 & 2032
- Figure 78: South America Small Hydropower Market Volume Share (%), by Capacity 2024 & 2032
- Figure 79: South America Small Hydropower Market Revenue (Million), by Application 2024 & 2032
- Figure 80: South America Small Hydropower Market Volume (gigawatt), by Application 2024 & 2032
- Figure 81: South America Small Hydropower Market Revenue Share (%), by Application 2024 & 2032
- Figure 82: South America Small Hydropower Market Volume Share (%), by Application 2024 & 2032
- Figure 83: South America Small Hydropower Market Revenue (Million), by Country 2024 & 2032
- Figure 84: South America Small Hydropower Market Volume (gigawatt), by Country 2024 & 2032
- Figure 85: South America Small Hydropower Market Revenue Share (%), by Country 2024 & 2032
- Figure 86: South America Small Hydropower Market Volume Share (%), by Country 2024 & 2032
List of Tables
- Table 1: Global Small Hydropower Market Revenue Million Forecast, by Region 2019 & 2032
- Table 2: Global Small Hydropower Market Volume gigawatt Forecast, by Region 2019 & 2032
- Table 3: Global Small Hydropower Market Revenue Million Forecast, by Capacity 2019 & 2032
- Table 4: Global Small Hydropower Market Volume gigawatt Forecast, by Capacity 2019 & 2032
- Table 5: Global Small Hydropower Market Revenue Million Forecast, by Application 2019 & 2032
- Table 6: Global Small Hydropower Market Volume gigawatt Forecast, by Application 2019 & 2032
- Table 7: Global Small Hydropower Market Revenue Million Forecast, by Region 2019 & 2032
- Table 8: Global Small Hydropower Market Volume gigawatt Forecast, by Region 2019 & 2032
- Table 9: Global Small Hydropower Market Revenue Million Forecast, by Country 2019 & 2032
- Table 10: Global Small Hydropower Market Volume gigawatt Forecast, by Country 2019 & 2032
- Table 11: United States Small Hydropower Market Revenue (Million) Forecast, by Application 2019 & 2032
- Table 12: United States Small Hydropower Market Volume (gigawatt) Forecast, by Application 2019 & 2032
- Table 13: Canada Small Hydropower Market Revenue (Million) Forecast, by Application 2019 & 2032
- Table 14: Canada Small Hydropower Market Volume (gigawatt) Forecast, by Application 2019 & 2032
- Table 15: Mexico Small Hydropower Market Revenue (Million) Forecast, by Application 2019 & 2032
- Table 16: Mexico Small Hydropower Market Volume (gigawatt) Forecast, by Application 2019 & 2032
- Table 17: Global Small Hydropower Market Revenue Million Forecast, by Country 2019 & 2032
- Table 18: Global Small Hydropower Market Volume gigawatt Forecast, by Country 2019 & 2032
- Table 19: Germany Small Hydropower Market Revenue (Million) Forecast, by Application 2019 & 2032
- Table 20: Germany Small Hydropower Market Volume (gigawatt) Forecast, by Application 2019 & 2032
- Table 21: United Kingdom Small Hydropower Market Revenue (Million) Forecast, by Application 2019 & 2032
- Table 22: United Kingdom Small Hydropower Market Volume (gigawatt) Forecast, by Application 2019 & 2032
- Table 23: France Small Hydropower Market Revenue (Million) Forecast, by Application 2019 & 2032
- Table 24: France Small Hydropower Market Volume (gigawatt) Forecast, by Application 2019 & 2032
- Table 25: Spain Small Hydropower Market Revenue (Million) Forecast, by Application 2019 & 2032
- Table 26: Spain Small Hydropower Market Volume (gigawatt) Forecast, by Application 2019 & 2032
- Table 27: Italy Small Hydropower Market Revenue (Million) Forecast, by Application 2019 & 2032
- Table 28: Italy Small Hydropower Market Volume (gigawatt) Forecast, by Application 2019 & 2032
- Table 29: Spain Small Hydropower Market Revenue (Million) Forecast, by Application 2019 & 2032
- Table 30: Spain Small Hydropower Market Volume (gigawatt) Forecast, by Application 2019 & 2032
- Table 31: Belgium Small Hydropower Market Revenue (Million) Forecast, by Application 2019 & 2032
- Table 32: Belgium Small Hydropower Market Volume (gigawatt) Forecast, by Application 2019 & 2032
- Table 33: Netherland Small Hydropower Market Revenue (Million) Forecast, by Application 2019 & 2032
- Table 34: Netherland Small Hydropower Market Volume (gigawatt) Forecast, by Application 2019 & 2032
- Table 35: Nordics Small Hydropower Market Revenue (Million) Forecast, by Application 2019 & 2032
- Table 36: Nordics Small Hydropower Market Volume (gigawatt) Forecast, by Application 2019 & 2032
- Table 37: Rest of Europe Small Hydropower Market Revenue (Million) Forecast, by Application 2019 & 2032
- Table 38: Rest of Europe Small Hydropower Market Volume (gigawatt) Forecast, by Application 2019 & 2032
- Table 39: Global Small Hydropower Market Revenue Million Forecast, by Country 2019 & 2032
- Table 40: Global Small Hydropower Market Volume gigawatt Forecast, by Country 2019 & 2032
- Table 41: China Small Hydropower Market Revenue (Million) Forecast, by Application 2019 & 2032
- Table 42: China Small Hydropower Market Volume (gigawatt) Forecast, by Application 2019 & 2032
- Table 43: Japan Small Hydropower Market Revenue (Million) Forecast, by Application 2019 & 2032
- Table 44: Japan Small Hydropower Market Volume (gigawatt) Forecast, by Application 2019 & 2032
- Table 45: India Small Hydropower Market Revenue (Million) Forecast, by Application 2019 & 2032
- Table 46: India Small Hydropower Market Volume (gigawatt) Forecast, by Application 2019 & 2032
- Table 47: South Korea Small Hydropower Market Revenue (Million) Forecast, by Application 2019 & 2032
- Table 48: South Korea Small Hydropower Market Volume (gigawatt) Forecast, by Application 2019 & 2032
- Table 49: Southeast Asia Small Hydropower Market Revenue (Million) Forecast, by Application 2019 & 2032
- Table 50: Southeast Asia Small Hydropower Market Volume (gigawatt) Forecast, by Application 2019 & 2032
- Table 51: Australia Small Hydropower Market Revenue (Million) Forecast, by Application 2019 & 2032
- Table 52: Australia Small Hydropower Market Volume (gigawatt) Forecast, by Application 2019 & 2032
- Table 53: Indonesia Small Hydropower Market Revenue (Million) Forecast, by Application 2019 & 2032
- Table 54: Indonesia Small Hydropower Market Volume (gigawatt) Forecast, by Application 2019 & 2032
- Table 55: Phillipes Small Hydropower Market Revenue (Million) Forecast, by Application 2019 & 2032
- Table 56: Phillipes Small Hydropower Market Volume (gigawatt) Forecast, by Application 2019 & 2032
- Table 57: Singapore Small Hydropower Market Revenue (Million) Forecast, by Application 2019 & 2032
- Table 58: Singapore Small Hydropower Market Volume (gigawatt) Forecast, by Application 2019 & 2032
- Table 59: Thailandc Small Hydropower Market Revenue (Million) Forecast, by Application 2019 & 2032
- Table 60: Thailandc Small Hydropower Market Volume (gigawatt) Forecast, by Application 2019 & 2032
- Table 61: Rest of Asia Pacific Small Hydropower Market Revenue (Million) Forecast, by Application 2019 & 2032
- Table 62: Rest of Asia Pacific Small Hydropower Market Volume (gigawatt) Forecast, by Application 2019 & 2032
- Table 63: Global Small Hydropower Market Revenue Million Forecast, by Country 2019 & 2032
- Table 64: Global Small Hydropower Market Volume gigawatt Forecast, by Country 2019 & 2032
- Table 65: Brazil Small Hydropower Market Revenue (Million) Forecast, by Application 2019 & 2032
- Table 66: Brazil Small Hydropower Market Volume (gigawatt) Forecast, by Application 2019 & 2032
- Table 67: Argentina Small Hydropower Market Revenue (Million) Forecast, by Application 2019 & 2032
- Table 68: Argentina Small Hydropower Market Volume (gigawatt) Forecast, by Application 2019 & 2032
- Table 69: Peru Small Hydropower Market Revenue (Million) Forecast, by Application 2019 & 2032
- Table 70: Peru Small Hydropower Market Volume (gigawatt) Forecast, by Application 2019 & 2032
- Table 71: Chile Small Hydropower Market Revenue (Million) Forecast, by Application 2019 & 2032
- Table 72: Chile Small Hydropower Market Volume (gigawatt) Forecast, by Application 2019 & 2032
- Table 73: Colombia Small Hydropower Market Revenue (Million) Forecast, by Application 2019 & 2032
- Table 74: Colombia Small Hydropower Market Volume (gigawatt) Forecast, by Application 2019 & 2032
- Table 75: Ecuador Small Hydropower Market Revenue (Million) Forecast, by Application 2019 & 2032
- Table 76: Ecuador Small Hydropower Market Volume (gigawatt) Forecast, by Application 2019 & 2032
- Table 77: Venezuela Small Hydropower Market Revenue (Million) Forecast, by Application 2019 & 2032
- Table 78: Venezuela Small Hydropower Market Volume (gigawatt) Forecast, by Application 2019 & 2032
- Table 79: Rest of South America Small Hydropower Market Revenue (Million) Forecast, by Application 2019 & 2032
- Table 80: Rest of South America Small Hydropower Market Volume (gigawatt) Forecast, by Application 2019 & 2032
- Table 81: Global Small Hydropower Market Revenue Million Forecast, by Country 2019 & 2032
- Table 82: Global Small Hydropower Market Volume gigawatt Forecast, by Country 2019 & 2032
- Table 83: United States Small Hydropower Market Revenue (Million) Forecast, by Application 2019 & 2032
- Table 84: United States Small Hydropower Market Volume (gigawatt) Forecast, by Application 2019 & 2032
- Table 85: Canada Small Hydropower Market Revenue (Million) Forecast, by Application 2019 & 2032
- Table 86: Canada Small Hydropower Market Volume (gigawatt) Forecast, by Application 2019 & 2032
- Table 87: Mexico Small Hydropower Market Revenue (Million) Forecast, by Application 2019 & 2032
- Table 88: Mexico Small Hydropower Market Volume (gigawatt) Forecast, by Application 2019 & 2032
- Table 89: Global Small Hydropower Market Revenue Million Forecast, by Country 2019 & 2032
- Table 90: Global Small Hydropower Market Volume gigawatt Forecast, by Country 2019 & 2032
- Table 91: United Arab Emirates Small Hydropower Market Revenue (Million) Forecast, by Application 2019 & 2032
- Table 92: United Arab Emirates Small Hydropower Market Volume (gigawatt) Forecast, by Application 2019 & 2032
- Table 93: Saudi Arabia Small Hydropower Market Revenue (Million) Forecast, by Application 2019 & 2032
- Table 94: Saudi Arabia Small Hydropower Market Volume (gigawatt) Forecast, by Application 2019 & 2032
- Table 95: South Africa Small Hydropower Market Revenue (Million) Forecast, by Application 2019 & 2032
- Table 96: South Africa Small Hydropower Market Volume (gigawatt) Forecast, by Application 2019 & 2032
- Table 97: Rest of Middle East and Africa Small Hydropower Market Revenue (Million) Forecast, by Application 2019 & 2032
- Table 98: Rest of Middle East and Africa Small Hydropower Market Volume (gigawatt) Forecast, by Application 2019 & 2032
- Table 99: Global Small Hydropower Market Revenue Million Forecast, by Capacity 2019 & 2032
- Table 100: Global Small Hydropower Market Volume gigawatt Forecast, by Capacity 2019 & 2032
- Table 101: Global Small Hydropower Market Revenue Million Forecast, by Application 2019 & 2032
- Table 102: Global Small Hydropower Market Volume gigawatt Forecast, by Application 2019 & 2032
- Table 103: Global Small Hydropower Market Revenue Million Forecast, by Country 2019 & 2032
- Table 104: Global Small Hydropower Market Volume gigawatt Forecast, by Country 2019 & 2032
- Table 105: United States Small Hydropower Market Revenue (Million) Forecast, by Application 2019 & 2032
- Table 106: United States Small Hydropower Market Volume (gigawatt) Forecast, by Application 2019 & 2032
- Table 107: Canada Small Hydropower Market Revenue (Million) Forecast, by Application 2019 & 2032
- Table 108: Canada Small Hydropower Market Volume (gigawatt) Forecast, by Application 2019 & 2032
- Table 109: Rest of North America Small Hydropower Market Revenue (Million) Forecast, by Application 2019 & 2032
- Table 110: Rest of North America Small Hydropower Market Volume (gigawatt) Forecast, by Application 2019 & 2032
- Table 111: Global Small Hydropower Market Revenue Million Forecast, by Capacity 2019 & 2032
- Table 112: Global Small Hydropower Market Volume gigawatt Forecast, by Capacity 2019 & 2032
- Table 113: Global Small Hydropower Market Revenue Million Forecast, by Application 2019 & 2032
- Table 114: Global Small Hydropower Market Volume gigawatt Forecast, by Application 2019 & 2032
- Table 115: Global Small Hydropower Market Revenue Million Forecast, by Country 2019 & 2032
- Table 116: Global Small Hydropower Market Volume gigawatt Forecast, by Country 2019 & 2032
- Table 117: Germany Small Hydropower Market Revenue (Million) Forecast, by Application 2019 & 2032
- Table 118: Germany Small Hydropower Market Volume (gigawatt) Forecast, by Application 2019 & 2032
- Table 119: United Kingdom Small Hydropower Market Revenue (Million) Forecast, by Application 2019 & 2032
- Table 120: United Kingdom Small Hydropower Market Volume (gigawatt) Forecast, by Application 2019 & 2032
- Table 121: France Small Hydropower Market Revenue (Million) Forecast, by Application 2019 & 2032
- Table 122: France Small Hydropower Market Volume (gigawatt) Forecast, by Application 2019 & 2032
- Table 123: Italy Small Hydropower Market Revenue (Million) Forecast, by Application 2019 & 2032
- Table 124: Italy Small Hydropower Market Volume (gigawatt) Forecast, by Application 2019 & 2032
- Table 125: Spain Small Hydropower Market Revenue (Million) Forecast, by Application 2019 & 2032
- Table 126: Spain Small Hydropower Market Volume (gigawatt) Forecast, by Application 2019 & 2032
- Table 127: Nordic Small Hydropower Market Revenue (Million) Forecast, by Application 2019 & 2032
- Table 128: Nordic Small Hydropower Market Volume (gigawatt) Forecast, by Application 2019 & 2032
- Table 129: Turkey Small Hydropower Market Revenue (Million) Forecast, by Application 2019 & 2032
- Table 130: Turkey Small Hydropower Market Volume (gigawatt) Forecast, by Application 2019 & 2032
- Table 131: Russia Small Hydropower Market Revenue (Million) Forecast, by Application 2019 & 2032
- Table 132: Russia Small Hydropower Market Volume (gigawatt) Forecast, by Application 2019 & 2032
- Table 133: Rest of Europe Small Hydropower Market Revenue (Million) Forecast, by Application 2019 & 2032
- Table 134: Rest of Europe Small Hydropower Market Volume (gigawatt) Forecast, by Application 2019 & 2032
- Table 135: Global Small Hydropower Market Revenue Million Forecast, by Capacity 2019 & 2032
- Table 136: Global Small Hydropower Market Volume gigawatt Forecast, by Capacity 2019 & 2032
- Table 137: Global Small Hydropower Market Revenue Million Forecast, by Application 2019 & 2032
- Table 138: Global Small Hydropower Market Volume gigawatt Forecast, by Application 2019 & 2032
- Table 139: Global Small Hydropower Market Revenue Million Forecast, by Country 2019 & 2032
- Table 140: Global Small Hydropower Market Volume gigawatt Forecast, by Country 2019 & 2032
- Table 141: China Small Hydropower Market Revenue (Million) Forecast, by Application 2019 & 2032
- Table 142: China Small Hydropower Market Volume (gigawatt) Forecast, by Application 2019 & 2032
- Table 143: India Small Hydropower Market Revenue (Million) Forecast, by Application 2019 & 2032
- Table 144: India Small Hydropower Market Volume (gigawatt) Forecast, by Application 2019 & 2032
- Table 145: Japan Small Hydropower Market Revenue (Million) Forecast, by Application 2019 & 2032
- Table 146: Japan Small Hydropower Market Volume (gigawatt) Forecast, by Application 2019 & 2032
- Table 147: South Korea Small Hydropower Market Revenue (Million) Forecast, by Application 2019 & 2032
- Table 148: South Korea Small Hydropower Market Volume (gigawatt) Forecast, by Application 2019 & 2032
- Table 149: Malaysia Small Hydropower Market Revenue (Million) Forecast, by Application 2019 & 2032
- Table 150: Malaysia Small Hydropower Market Volume (gigawatt) Forecast, by Application 2019 & 2032
- Table 151: Thailand Small Hydropower Market Revenue (Million) Forecast, by Application 2019 & 2032
- Table 152: Thailand Small Hydropower Market Volume (gigawatt) Forecast, by Application 2019 & 2032
- Table 153: Vietnam Small Hydropower Market Revenue (Million) Forecast, by Application 2019 & 2032
- Table 154: Vietnam Small Hydropower Market Volume (gigawatt) Forecast, by Application 2019 & 2032
- Table 155: Rest of Asia Pacific Small Hydropower Market Revenue (Million) Forecast, by Application 2019 & 2032
- Table 156: Rest of Asia Pacific Small Hydropower Market Volume (gigawatt) Forecast, by Application 2019 & 2032
- Table 157: Global Small Hydropower Market Revenue Million Forecast, by Capacity 2019 & 2032
- Table 158: Global Small Hydropower Market Volume gigawatt Forecast, by Capacity 2019 & 2032
- Table 159: Global Small Hydropower Market Revenue Million Forecast, by Application 2019 & 2032
- Table 160: Global Small Hydropower Market Volume gigawatt Forecast, by Application 2019 & 2032
- Table 161: Global Small Hydropower Market Revenue Million Forecast, by Country 2019 & 2032
- Table 162: Global Small Hydropower Market Volume gigawatt Forecast, by Country 2019 & 2032
- Table 163: Saudi Arabia Small Hydropower Market Revenue (Million) Forecast, by Application 2019 & 2032
- Table 164: Saudi Arabia Small Hydropower Market Volume (gigawatt) Forecast, by Application 2019 & 2032
- Table 165: United Arab Emirates Small Hydropower Market Revenue (Million) Forecast, by Application 2019 & 2032
- Table 166: United Arab Emirates Small Hydropower Market Volume (gigawatt) Forecast, by Application 2019 & 2032
- Table 167: Nigeria Small Hydropower Market Revenue (Million) Forecast, by Application 2019 & 2032
- Table 168: Nigeria Small Hydropower Market Volume (gigawatt) Forecast, by Application 2019 & 2032
- Table 169: Egypt Small Hydropower Market Revenue (Million) Forecast, by Application 2019 & 2032
- Table 170: Egypt Small Hydropower Market Volume (gigawatt) Forecast, by Application 2019 & 2032
- Table 171: South Africa Small Hydropower Market Revenue (Million) Forecast, by Application 2019 & 2032
- Table 172: South Africa Small Hydropower Market Volume (gigawatt) Forecast, by Application 2019 & 2032
- Table 173: Rest of Middle East and Africa Small Hydropower Market Revenue (Million) Forecast, by Application 2019 & 2032
- Table 174: Rest of Middle East and Africa Small Hydropower Market Volume (gigawatt) Forecast, by Application 2019 & 2032
- Table 175: Global Small Hydropower Market Revenue Million Forecast, by Capacity 2019 & 2032
- Table 176: Global Small Hydropower Market Volume gigawatt Forecast, by Capacity 2019 & 2032
- Table 177: Global Small Hydropower Market Revenue Million Forecast, by Application 2019 & 2032
- Table 178: Global Small Hydropower Market Volume gigawatt Forecast, by Application 2019 & 2032
- Table 179: Global Small Hydropower Market Revenue Million Forecast, by Country 2019 & 2032
- Table 180: Global Small Hydropower Market Volume gigawatt Forecast, by Country 2019 & 2032
- Table 181: Brazil Small Hydropower Market Revenue (Million) Forecast, by Application 2019 & 2032
- Table 182: Brazil Small Hydropower Market Volume (gigawatt) Forecast, by Application 2019 & 2032
- Table 183: Argentina Small Hydropower Market Revenue (Million) Forecast, by Application 2019 & 2032
- Table 184: Argentina Small Hydropower Market Volume (gigawatt) Forecast, by Application 2019 & 2032
- Table 185: Colombia Small Hydropower Market Revenue (Million) Forecast, by Application 2019 & 2032
- Table 186: Colombia Small Hydropower Market Volume (gigawatt) Forecast, by Application 2019 & 2032
- Table 187: Rest of South America Small Hydropower Market Revenue (Million) Forecast, by Application 2019 & 2032
- Table 188: Rest of South America Small Hydropower Market Volume (gigawatt) Forecast, by Application 2019 & 2032
Frequently Asked Questions
1. What is the projected Compound Annual Growth Rate (CAGR) of the Small Hydropower Market?
The projected CAGR is approximately > 2.00%.
2. Which companies are prominent players in the Small Hydropower Market?
Key companies in the market include Gilbert Gilkes & Gordon Ltd, Toshiba Energy Systems & Solutions Corporation, Kolektor Group*List Not Exhaustive, Voith GmbH & Co KGaA, PJSC RusHydro, Siemens Energy AG, Natel Energy Inc, GE Renewable Energy, Andritz AG, FLOVEL Energy Private Limited.
3. What are the main segments of the Small Hydropower Market?
The market segments include Capacity, Application.
4. Can you provide details about the market size?
The market size is estimated to be USD XX Million as of 2022.
5. What are some drivers contributing to market growth?
4.; Growing Emphasis on Renewable Energy Integration4.; Significant Hydropower Potential.
6. What are the notable trends driving market growth?
The 1-10 MW Segment Expected to Dominate the Market.
7. Are there any restraints impacting market growth?
4.; Competition From Other Energy Storage Technologies.
8. Can you provide examples of recent developments in the market?
July 2022: SMEC was hired by KPower Engineering Sdn Bhd (KPEng), together with Tellhow International Engineering & Contracting Co Ltd, to review the design and propose modifications required for three small hydropower plants in East Malaysia. The three hydropower projects at Sungai Bengkoka Upper, Sungai Bengkoka Lower, and Sungai Togohu in Kota Marudu, Sabah, had a planned capacity totaling 29.1 MW. The consortium had taken over from the previous contractor to complete the engineering, design, procurement, construction, and commissioning works, and ORP, a subsidiary of OHP Ventures Sdn Bhd, owns the project.
9. What pricing options are available for accessing the report?
Pricing options include single-user, multi-user, and enterprise licenses priced at USD 4750, USD 5250, and USD 8750 respectively.
10. Is the market size provided in terms of value or volume?
The market size is provided in terms of value, measured in Million and volume, measured in gigawatt.
11. Are there any specific market keywords associated with the report?
Yes, the market keyword associated with the report is "Small Hydropower Market," which aids in identifying and referencing the specific market segment covered.
12. How do I determine which pricing option suits my needs best?
The pricing options vary based on user requirements and access needs. Individual users may opt for single-user licenses, while businesses requiring broader access may choose multi-user or enterprise licenses for cost-effective access to the report.
13. Are there any additional resources or data provided in the Small Hydropower Market report?
While the report offers comprehensive insights, it's advisable to review the specific contents or supplementary materials provided to ascertain if additional resources or data are available.
14. How can I stay updated on further developments or reports in the Small Hydropower Market?
To stay informed about further developments, trends, and reports in the Small Hydropower Market, consider subscribing to industry newsletters, following relevant companies and organizations, or regularly checking reputable industry news sources and publications.
Methodology
Step 1 - Identification of Relevant Samples Size from Population Database


Step 2 - Approaches for Defining Global Market Size (Value, Volume* & Price*)

Note*: In applicable scenarios
Step 3 - Data Sources
Primary Research
- Web Analytics
- Survey Reports
- Research Institute
- Latest Research Reports
- Opinion Leaders
Secondary Research
- Annual Reports
- White Paper
- Latest Press Release
- Industry Association
- Paid Database
- Investor Presentations

Step 4 - Data Triangulation
Involves using different sources of information in order to increase the validity of a study
These sources are likely to be stakeholders in a program - participants, other researchers, program staff, other community members, and so on.
Then we put all data in single framework & apply various statistical tools to find out the dynamic on the market.
During the analysis stage, feedback from the stakeholder groups would be compared to determine areas of agreement as well as areas of divergence


