
Key Insights
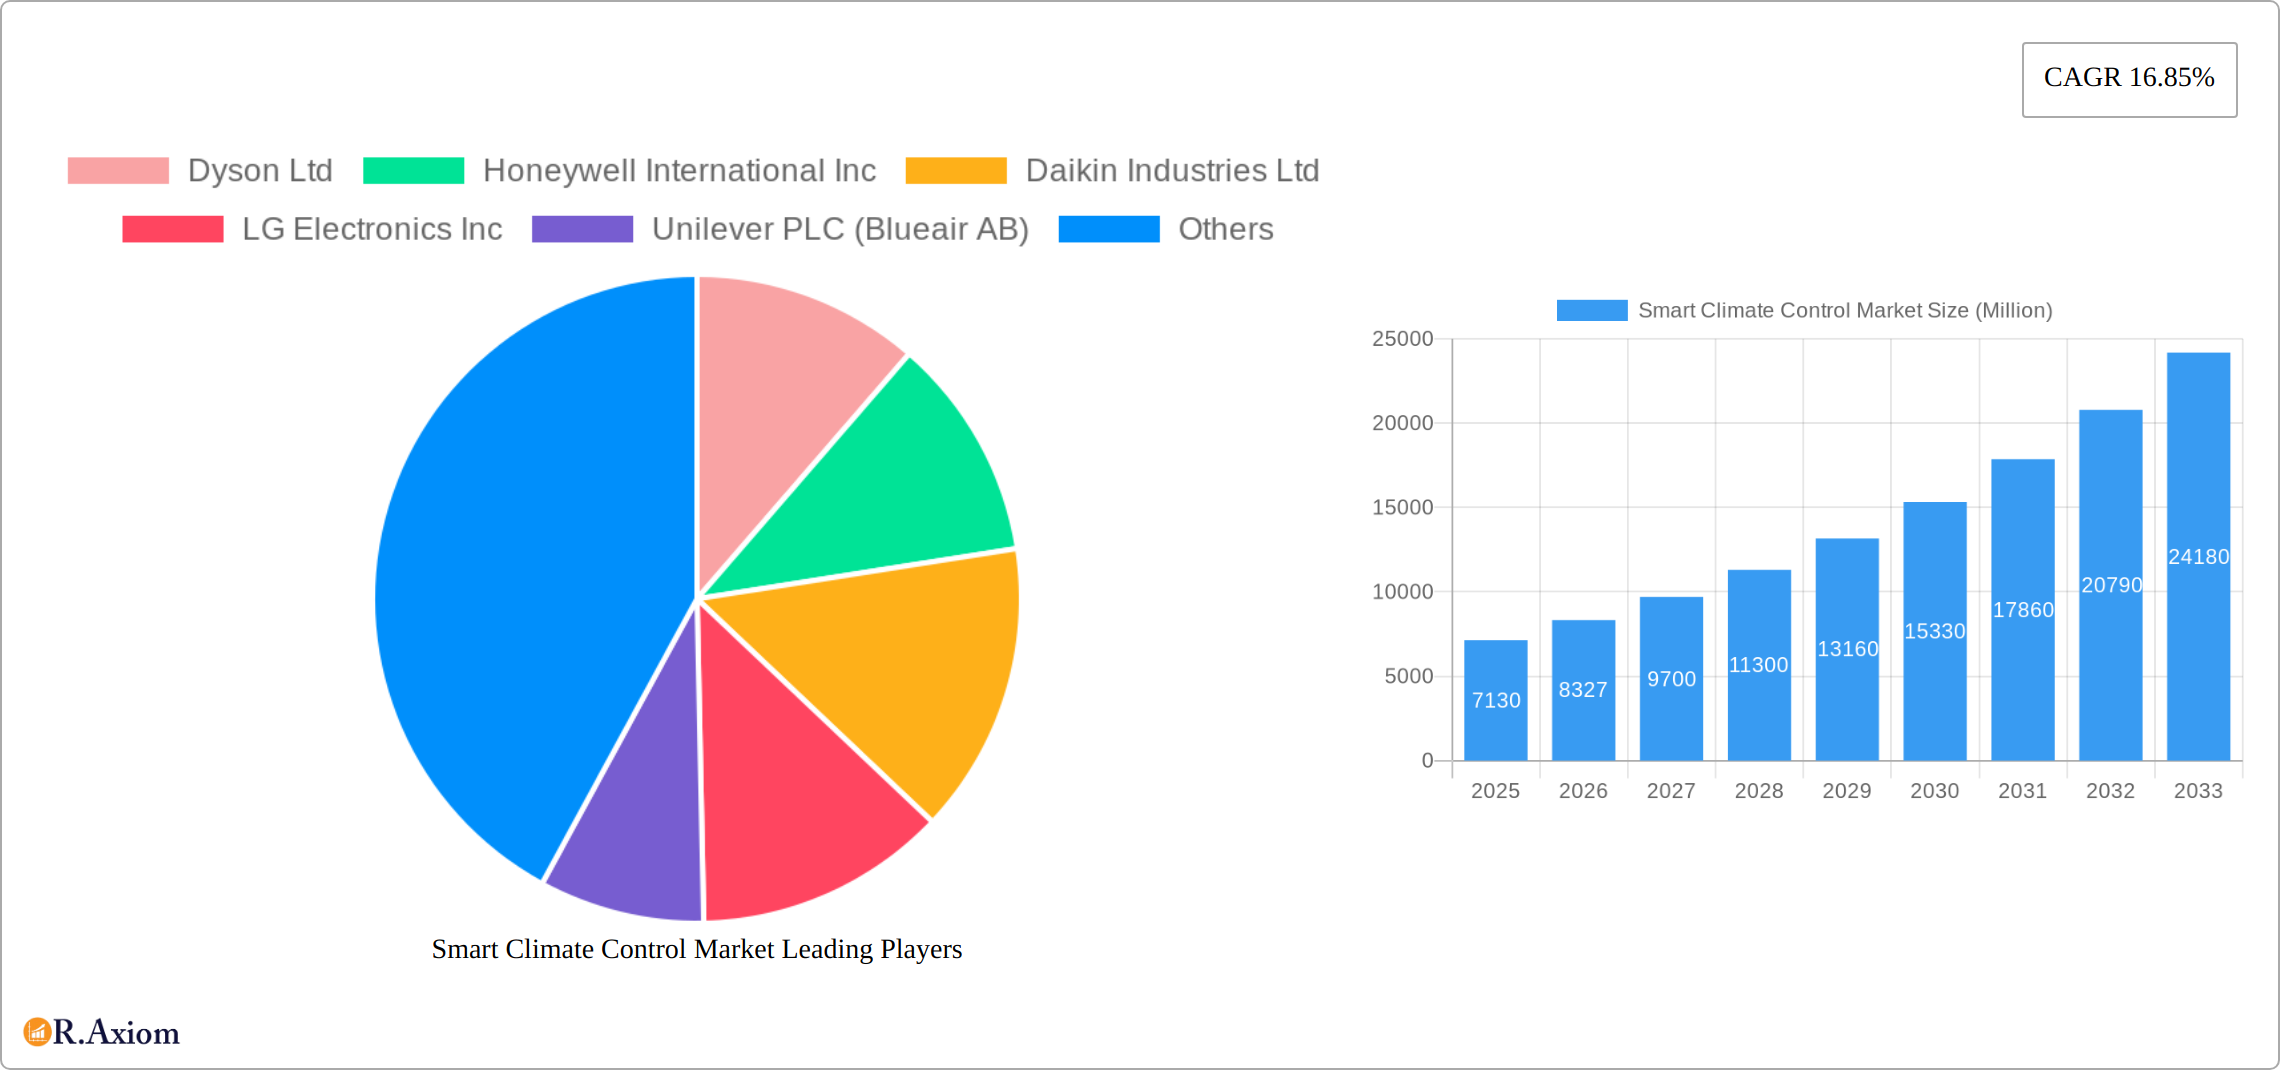
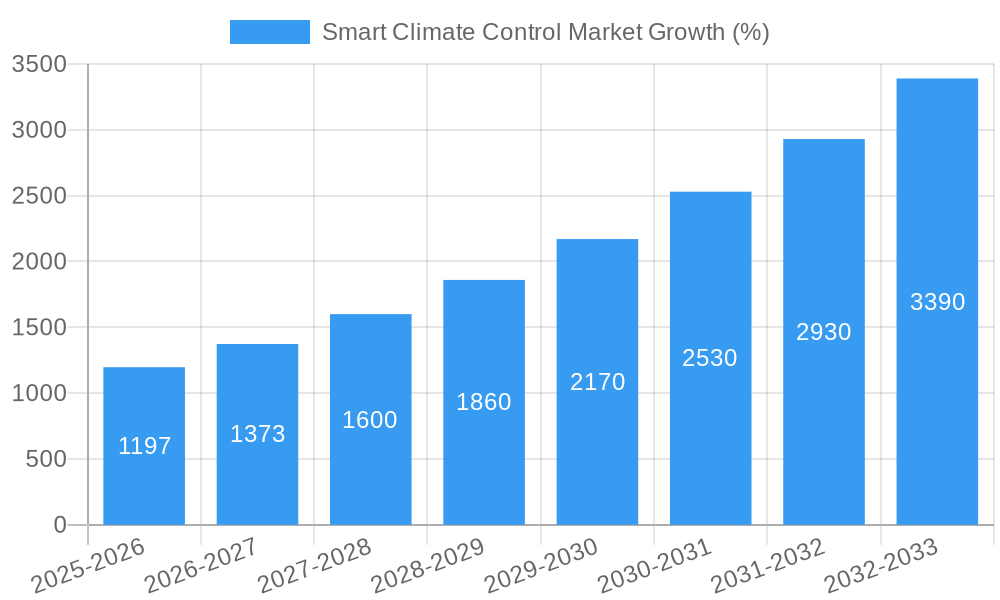
The smart climate control market is experiencing robust growth, projected to reach a market size of $7.13 billion in 2025 and exhibiting a Compound Annual Growth Rate (CAGR) of 16.85% from 2025 to 2033. This expansion is fueled by several key drivers. Increasing consumer demand for energy-efficient and convenient home automation solutions is a significant factor. Smart thermostats, coupled with sophisticated sensors and app-based controls, offer precise temperature regulation, leading to substantial energy savings and reduced utility bills. Furthermore, rising environmental awareness and the adoption of sustainable living practices are boosting the market. Consumers are actively seeking technologies that minimize their environmental footprint, aligning perfectly with the energy-saving capabilities of smart climate control systems. The integration of smart climate control with other smart home devices and ecosystems enhances user experience and fosters greater adoption. While high initial investment costs can pose a restraint, the long-term cost savings and enhanced comfort levels are proving compelling arguments for consumers. Market segmentation reveals a strong preference for standalone units, likely due to their ease of installation and compatibility with various home setups. However, the non-smart segment still holds significant market share, indicating substantial growth potential as consumers progressively adopt smart home technologies.
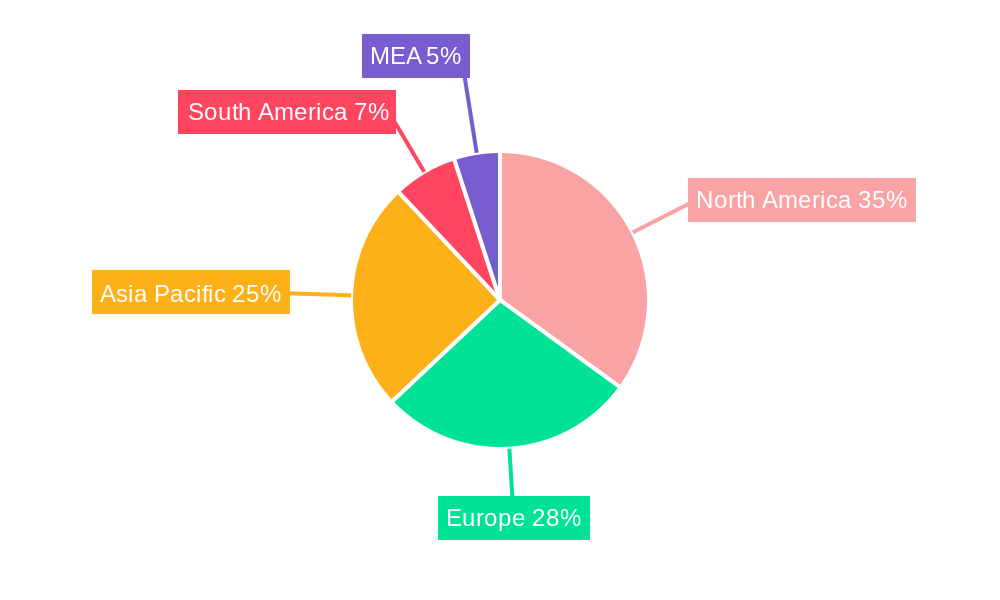
The geographical distribution of the smart climate control market reflects a concentration in developed regions. North America and Europe are currently leading the market, driven by high disposable incomes, advanced technological infrastructure, and strong consumer awareness of smart home technologies. However, the Asia-Pacific region is poised for significant growth, fueled by rapid urbanization, rising middle-class incomes, and increasing adoption of smart home devices in countries like China, India, and Japan. The competitive landscape is characterized by a mix of established players like Dyson, Honeywell, and Daikin, and emerging technology companies. These companies are constantly innovating to improve product features, expand their product lines, and enhance user experiences. This dynamic market landscape is likely to witness further consolidation and diversification in the coming years, driven by technological advancements, strategic alliances, and mergers and acquisitions.
Smart Climate Control Market: A Comprehensive Report (2019-2033)
This in-depth report provides a comprehensive analysis of the Smart Climate Control Market, offering actionable insights for industry stakeholders. Covering the period 2019-2033, with a focus on 2025, this report delves into market dynamics, competitive landscapes, and future growth projections. The report's findings are based on rigorous research and data analysis, offering a valuable resource for strategic decision-making. The total market size in 2025 is estimated at xx Million.
Smart Climate Control Market Market Concentration & Innovation
This section analyzes the competitive intensity, innovation drivers, regulatory landscape, and market dynamics within the smart climate control sector. The market exhibits a moderately concentrated structure with key players like Dyson Ltd, Honeywell International Inc, and Daikin Industries Ltd holding significant market share. However, the emergence of new players and technological advancements is fostering increased competition.
- Market Concentration: The top 5 players account for approximately xx% of the global market share in 2025, indicating a moderately concentrated market. Further analysis reveals that market share is expected to shift slightly by 2033 due to ongoing innovation and new market entrants.
- Innovation Drivers: Continuous advancements in sensor technology, AI-powered algorithms, and IoT connectivity are driving product innovation. The integration of smart features like voice control, app-based management, and predictive maintenance is enhancing user experience and driving market growth.
- Regulatory Frameworks: Stringent environmental regulations concerning air quality and energy efficiency are shaping product development and adoption. Government initiatives promoting energy-saving technologies are fostering market growth, while stricter emission standards impact production and materials choices.
- Product Substitutes: Traditional climate control systems pose a significant competitive threat. However, the increasing demand for energy efficiency, convenience, and smart features is driving consumer preference towards smart climate control solutions.
- End-User Trends: The growing preference for personalized comfort, remote control capabilities, and energy monitoring is driving demand. Increasing awareness of air quality is fueling demand, particularly in regions with high pollution levels. The trend towards smart homes further enhances the market appeal.
- M&A Activities: The smart climate control market has witnessed several mergers and acquisitions in recent years, with deal values exceeding xx Million in the past five years. These activities are driven by efforts to expand product portfolios, strengthen market presence, and acquire innovative technologies.
Smart Climate Control Market Industry Trends & Insights
The smart climate control market is experiencing significant growth, driven by a confluence of factors. Technological advancements, changing consumer preferences, and supportive government policies are key contributors to this expansion.
The market exhibited a CAGR of xx% during the historical period (2019-2024). This growth is projected to continue, with a forecast CAGR of xx% during the forecast period (2025-2033). Market penetration stands at approximately xx% in 2025, with significant growth potential remaining across various regions and consumer segments. Technological disruptions, such as the integration of AI and machine learning, are transforming the industry by enhancing energy efficiency, predictive maintenance, and personalized climate control. Consumer preferences are shifting towards smart, energy-efficient, and convenient solutions. Competitive dynamics are intensifying with both established players and emerging startups vying for market share through innovative product offerings and strategic partnerships. The increasing adoption of smart home ecosystems and the growth of the IoT market are expected to boost market growth substantially in the coming years.
Dominant Markets & Segments in Smart Climate Control Market
The smart climate control market displays diverse regional and segmental dominance.
Leading Regions: North America and Europe currently hold significant market shares due to high consumer awareness, strong technological adoption rates, and supportive government policies. However, the Asia-Pacific region is exhibiting rapid growth, driven by increasing urbanization, rising disposable incomes, and a burgeoning middle class.
Dominant Segments:
- By Filtration Technology: HEPA filtration systems dominate the market due to their high efficiency in removing airborne pollutants. Other technologies, such as electrostatic precipitators and ionizers, are gaining traction, though their market share remains relatively smaller.
- By Type: Standalone smart climate control units represent the larger market segment owing to their convenience and flexibility. However, the integration of smart climate control features into existing systems is gaining traction, and the non-smart segment continues to offer a significant baseline.
Key Drivers by Region:
- North America: Strong consumer preference for smart home technology, robust infrastructure, and well-established distribution channels contribute to the high market penetration.
- Europe: Stringent environmental regulations, high awareness of air quality issues, and supportive government initiatives stimulate market growth.
- Asia-Pacific: Rapid urbanization, increasing disposable incomes, and government investments in smart city projects are driving market expansion.
Smart Climate Control Market Product Developments
Recent product innovations focus on enhancing energy efficiency, improving air quality monitoring capabilities, and integrating advanced connectivity features. Smart air purifiers with AI-powered algorithms for self-learning and optimization are gaining popularity. Integration with smart home ecosystems and voice assistants is improving user experience and convenience. New products are emphasizing user-friendly interfaces and data-driven insights, offering customers greater control and transparency over their indoor environments. These advancements address the market need for convenient, efficient, and personalized climate control solutions.
Report Scope & Segmentation Analysis
This report provides a comprehensive analysis of the global smart climate control market.
By Filtration Technology: The market is segmented into High-efficiency Particulate Air (HEPA) filters and Other Technologies (Electrostatic Precipitators (ESPs), Ionizers, and Ozone Generators). HEPA filters currently dominate the market but other technologies are witnessing growth due to cost-effectiveness and specific application needs. Growth projections vary across segments, with HEPA filters expected to maintain substantial market share. Competitive dynamics are intense within both segments.
By Type: The market is divided into Standalone and Non-smart systems. Standalone systems are currently the major segment, while non-smart systems provide a considerable baseline market. Growth projections for standalone systems are high due to increasing consumer demand for standalone smart devices, while the non-smart segment will likely experience a steady, but less rapid, growth. The competitive landscape differs slightly depending on the product type, with specialized players dominating the standalone segment.
Key Drivers of Smart Climate Control Market Growth
Several factors are driving the growth of the smart climate control market. These include advancements in sensor technology, AI, and IoT enabling smarter, more energy-efficient devices. Rising consumer awareness of air quality and health concerns is also fueling demand. Furthermore, supportive government policies and incentives promoting energy efficiency are encouraging adoption. Finally, the increasing integration of smart climate control systems into smart homes is creating new opportunities.
Challenges in the Smart Climate Control Market Sector
Despite the positive outlook, the smart climate control market faces several challenges. High initial costs can hinder wider adoption, especially in price-sensitive markets. Concerns over data privacy and security associated with smart devices need to be addressed. The market is also affected by fluctuating raw material costs and supply chain disruptions. Finally, the intense competition among numerous players can pressure profitability.
Emerging Opportunities in Smart Climate Control Market
Several emerging opportunities exist within the smart climate control market. The integration of smart climate control solutions into commercial buildings offers substantial potential. The development of energy-harvesting technologies can improve sustainability and reduce reliance on external power sources. Expansion into emerging markets with growing middle classes and increasing awareness of environmental issues provides significant untapped potential. Finally, the development of personalized climate control systems tailored to individual needs and preferences presents exciting new avenues for growth.
Leading Players in the Smart Climate Control Market Market
- Dyson Ltd
- Honeywell International Inc
- Daikin Industries Ltd
- LG Electronics Inc
- Unilever PLC (Blueair AB)
- Xiaomi Corp
- AllerAir Industries Inc
- Koninklijke Philips NV
- Sharp Corporation
- Whirlpool Corporation
Key Developments in Smart Climate Control Market Industry
March 2023: The IQAir World Air Quality Report 2022 highlighted the poor air quality globally, increasing awareness and demand for efficient smart air purifiers. This development is a significant growth catalyst for the market.
April 2022: Wyze's entry into the air purifier market with a smart, affordable product signifies the increasing accessibility of smart climate control technology, driving market expansion in price-sensitive segments.
Strategic Outlook for Smart Climate Control Market Market
The future of the smart climate control market looks promising. Continued technological advancements, increasing consumer demand for energy-efficient and personalized solutions, and supportive government policies will fuel substantial growth. The integration of smart climate control into broader smart home ecosystems and the expansion into new geographic markets will unlock substantial opportunities. The market is poised for significant expansion in the coming years, driven by both technological innovation and evolving consumer preferences.
Smart Climate Control Market Segmentation
-
1. Product Type
- 1.1. Air Purifier
- 1.2. Smart Thermostat
- 1.3. Smart Sensors (Smoke and Air Quality)
-
2. Filtration Technology
- 2.1. High-efficiency Particulate Air
- 2.2. Other Technology
-
3. Type
- 3.1. Standalone
- 3.2. Non-smart
Smart Climate Control Market Segmentation By Geography
-
1. North America
- 1.1. United States
- 1.2. Canada
-
2. Europe
- 2.1. Germany
- 2.2. United Kingdom
- 2.3. France
- 2.4. Spain
- 2.5. Rest of Europe
-
3. Asia Pacific
- 3.1. China
- 3.2. Japan
- 3.3. Rest of Asia Pacific
- 4. Rest of the World
Smart Climate Control Market REPORT HIGHLIGHTS
| Aspects | Details |
|---|---|
| Study Period | 2019-2033 |
| Base Year | 2024 |
| Estimated Year | 2025 |
| Forecast Period | 2025-2033 |
| Historical Period | 2019-2024 |
| Growth Rate | CAGR of 16.85% from 2019-2033 |
| Segmentation |
|
Table of Contents
- 1. Introduction
- 1.1. Research Scope
- 1.2. Market Segmentation
- 1.3. Research Methodology
- 1.4. Definitions and Assumptions
- 2. Executive Summary
- 2.1. Introduction
- 3. Market Dynamics
- 3.1. Introduction
- 3.2. Market Drivers
- 3.2.1. Increasing Health Problems Associated with Air Pollution; Growing Household Spending
- 3.3. Market Restrains
- 3.3.1. High Adoption and Maintenance Costs
- 3.4. Market Trends
- 3.4.1. Growing Household Spending
- 4. Market Factor Analysis
- 4.1. Porters Five Forces
- 4.2. Supply/Value Chain
- 4.3. PESTEL analysis
- 4.4. Market Entropy
- 4.5. Patent/Trademark Analysis
- 5. Global Smart Climate Control Market Analysis, Insights and Forecast, 2019-2031
- 5.1. Market Analysis, Insights and Forecast - by Product Type
- 5.1.1. Air Purifier
- 5.1.2. Smart Thermostat
- 5.1.3. Smart Sensors (Smoke and Air Quality)
- 5.2. Market Analysis, Insights and Forecast - by Filtration Technology
- 5.2.1. High-efficiency Particulate Air
- 5.2.2. Other Technology
- 5.3. Market Analysis, Insights and Forecast - by Type
- 5.3.1. Standalone
- 5.3.2. Non-smart
- 5.4. Market Analysis, Insights and Forecast - by Region
- 5.4.1. North America
- 5.4.2. Europe
- 5.4.3. Asia Pacific
- 5.4.4. Rest of the World
- 5.1. Market Analysis, Insights and Forecast - by Product Type
- 6. North America Smart Climate Control Market Analysis, Insights and Forecast, 2019-2031
- 6.1. Market Analysis, Insights and Forecast - by Product Type
- 6.1.1. Air Purifier
- 6.1.2. Smart Thermostat
- 6.1.3. Smart Sensors (Smoke and Air Quality)
- 6.2. Market Analysis, Insights and Forecast - by Filtration Technology
- 6.2.1. High-efficiency Particulate Air
- 6.2.2. Other Technology
- 6.3. Market Analysis, Insights and Forecast - by Type
- 6.3.1. Standalone
- 6.3.2. Non-smart
- 6.1. Market Analysis, Insights and Forecast - by Product Type
- 7. Europe Smart Climate Control Market Analysis, Insights and Forecast, 2019-2031
- 7.1. Market Analysis, Insights and Forecast - by Product Type
- 7.1.1. Air Purifier
- 7.1.2. Smart Thermostat
- 7.1.3. Smart Sensors (Smoke and Air Quality)
- 7.2. Market Analysis, Insights and Forecast - by Filtration Technology
- 7.2.1. High-efficiency Particulate Air
- 7.2.2. Other Technology
- 7.3. Market Analysis, Insights and Forecast - by Type
- 7.3.1. Standalone
- 7.3.2. Non-smart
- 7.1. Market Analysis, Insights and Forecast - by Product Type
- 8. Asia Pacific Smart Climate Control Market Analysis, Insights and Forecast, 2019-2031
- 8.1. Market Analysis, Insights and Forecast - by Product Type
- 8.1.1. Air Purifier
- 8.1.2. Smart Thermostat
- 8.1.3. Smart Sensors (Smoke and Air Quality)
- 8.2. Market Analysis, Insights and Forecast - by Filtration Technology
- 8.2.1. High-efficiency Particulate Air
- 8.2.2. Other Technology
- 8.3. Market Analysis, Insights and Forecast - by Type
- 8.3.1. Standalone
- 8.3.2. Non-smart
- 8.1. Market Analysis, Insights and Forecast - by Product Type
- 9. Rest of the World Smart Climate Control Market Analysis, Insights and Forecast, 2019-2031
- 9.1. Market Analysis, Insights and Forecast - by Product Type
- 9.1.1. Air Purifier
- 9.1.2. Smart Thermostat
- 9.1.3. Smart Sensors (Smoke and Air Quality)
- 9.2. Market Analysis, Insights and Forecast - by Filtration Technology
- 9.2.1. High-efficiency Particulate Air
- 9.2.2. Other Technology
- 9.3. Market Analysis, Insights and Forecast - by Type
- 9.3.1. Standalone
- 9.3.2. Non-smart
- 9.1. Market Analysis, Insights and Forecast - by Product Type
- 10. North America Smart Climate Control Market Analysis, Insights and Forecast, 2019-2031
- 10.1. Market Analysis, Insights and Forecast - By Country/Sub-region
- 10.1.1 United States
- 10.1.2 Canada
- 10.1.3 Mexico
- 11. Europe Smart Climate Control Market Analysis, Insights and Forecast, 2019-2031
- 11.1. Market Analysis, Insights and Forecast - By Country/Sub-region
- 11.1.1 Germany
- 11.1.2 United Kingdom
- 11.1.3 France
- 11.1.4 Spain
- 11.1.5 Italy
- 11.1.6 Spain
- 11.1.7 Belgium
- 11.1.8 Netherland
- 11.1.9 Nordics
- 11.1.10 Rest of Europe
- 12. Asia Pacific Smart Climate Control Market Analysis, Insights and Forecast, 2019-2031
- 12.1. Market Analysis, Insights and Forecast - By Country/Sub-region
- 12.1.1 China
- 12.1.2 Japan
- 12.1.3 India
- 12.1.4 South Korea
- 12.1.5 Southeast Asia
- 12.1.6 Australia
- 12.1.7 Indonesia
- 12.1.8 Phillipes
- 12.1.9 Singapore
- 12.1.10 Thailandc
- 12.1.11 Rest of Asia Pacific
- 13. South America Smart Climate Control Market Analysis, Insights and Forecast, 2019-2031
- 13.1. Market Analysis, Insights and Forecast - By Country/Sub-region
- 13.1.1 Brazil
- 13.1.2 Argentina
- 13.1.3 Peru
- 13.1.4 Chile
- 13.1.5 Colombia
- 13.1.6 Ecuador
- 13.1.7 Venezuela
- 13.1.8 Rest of South America
- 14. North America Smart Climate Control Market Analysis, Insights and Forecast, 2019-2031
- 14.1. Market Analysis, Insights and Forecast - By Country/Sub-region
- 14.1.1 United States
- 14.1.2 Canada
- 14.1.3 Mexico
- 15. MEA Smart Climate Control Market Analysis, Insights and Forecast, 2019-2031
- 15.1. Market Analysis, Insights and Forecast - By Country/Sub-region
- 15.1.1 United Arab Emirates
- 15.1.2 Saudi Arabia
- 15.1.3 South Africa
- 15.1.4 Rest of Middle East and Africa
- 16. Competitive Analysis
- 16.1. Global Market Share Analysis 2024
- 16.2. Company Profiles
- 16.2.1 Dyson Ltd
- 16.2.1.1. Overview
- 16.2.1.2. Products
- 16.2.1.3. SWOT Analysis
- 16.2.1.4. Recent Developments
- 16.2.1.5. Financials (Based on Availability)
- 16.2.2 Honeywell International Inc
- 16.2.2.1. Overview
- 16.2.2.2. Products
- 16.2.2.3. SWOT Analysis
- 16.2.2.4. Recent Developments
- 16.2.2.5. Financials (Based on Availability)
- 16.2.3 Daikin Industries Ltd
- 16.2.3.1. Overview
- 16.2.3.2. Products
- 16.2.3.3. SWOT Analysis
- 16.2.3.4. Recent Developments
- 16.2.3.5. Financials (Based on Availability)
- 16.2.4 LG Electronics Inc
- 16.2.4.1. Overview
- 16.2.4.2. Products
- 16.2.4.3. SWOT Analysis
- 16.2.4.4. Recent Developments
- 16.2.4.5. Financials (Based on Availability)
- 16.2.5 Unilever PLC (Blueair AB)
- 16.2.5.1. Overview
- 16.2.5.2. Products
- 16.2.5.3. SWOT Analysis
- 16.2.5.4. Recent Developments
- 16.2.5.5. Financials (Based on Availability)
- 16.2.6 Xiaomi Corp
- 16.2.6.1. Overview
- 16.2.6.2. Products
- 16.2.6.3. SWOT Analysis
- 16.2.6.4. Recent Developments
- 16.2.6.5. Financials (Based on Availability)
- 16.2.7 AllerAir Industries Inc
- 16.2.7.1. Overview
- 16.2.7.2. Products
- 16.2.7.3. SWOT Analysis
- 16.2.7.4. Recent Developments
- 16.2.7.5. Financials (Based on Availability)
- 16.2.8 Koninklijke Philips NV
- 16.2.8.1. Overview
- 16.2.8.2. Products
- 16.2.8.3. SWOT Analysis
- 16.2.8.4. Recent Developments
- 16.2.8.5. Financials (Based on Availability)
- 16.2.9 Sharp Corporation
- 16.2.9.1. Overview
- 16.2.9.2. Products
- 16.2.9.3. SWOT Analysis
- 16.2.9.4. Recent Developments
- 16.2.9.5. Financials (Based on Availability)
- 16.2.10 Wirlpool Corporation
- 16.2.10.1. Overview
- 16.2.10.2. Products
- 16.2.10.3. SWOT Analysis
- 16.2.10.4. Recent Developments
- 16.2.10.5. Financials (Based on Availability)
- 16.2.1 Dyson Ltd
List of Figures
- Figure 1: Global Smart Climate Control Market Revenue Breakdown (Million, %) by Region 2024 & 2032
- Figure 2: Global Smart Climate Control Market Volume Breakdown (K Unit, %) by Region 2024 & 2032
- Figure 3: North America Smart Climate Control Market Revenue (Million), by Country 2024 & 2032
- Figure 4: North America Smart Climate Control Market Volume (K Unit), by Country 2024 & 2032
- Figure 5: North America Smart Climate Control Market Revenue Share (%), by Country 2024 & 2032
- Figure 6: North America Smart Climate Control Market Volume Share (%), by Country 2024 & 2032
- Figure 7: Europe Smart Climate Control Market Revenue (Million), by Country 2024 & 2032
- Figure 8: Europe Smart Climate Control Market Volume (K Unit), by Country 2024 & 2032
- Figure 9: Europe Smart Climate Control Market Revenue Share (%), by Country 2024 & 2032
- Figure 10: Europe Smart Climate Control Market Volume Share (%), by Country 2024 & 2032
- Figure 11: Asia Pacific Smart Climate Control Market Revenue (Million), by Country 2024 & 2032
- Figure 12: Asia Pacific Smart Climate Control Market Volume (K Unit), by Country 2024 & 2032
- Figure 13: Asia Pacific Smart Climate Control Market Revenue Share (%), by Country 2024 & 2032
- Figure 14: Asia Pacific Smart Climate Control Market Volume Share (%), by Country 2024 & 2032
- Figure 15: South America Smart Climate Control Market Revenue (Million), by Country 2024 & 2032
- Figure 16: South America Smart Climate Control Market Volume (K Unit), by Country 2024 & 2032
- Figure 17: South America Smart Climate Control Market Revenue Share (%), by Country 2024 & 2032
- Figure 18: South America Smart Climate Control Market Volume Share (%), by Country 2024 & 2032
- Figure 19: North America Smart Climate Control Market Revenue (Million), by Country 2024 & 2032
- Figure 20: North America Smart Climate Control Market Volume (K Unit), by Country 2024 & 2032
- Figure 21: North America Smart Climate Control Market Revenue Share (%), by Country 2024 & 2032
- Figure 22: North America Smart Climate Control Market Volume Share (%), by Country 2024 & 2032
- Figure 23: MEA Smart Climate Control Market Revenue (Million), by Country 2024 & 2032
- Figure 24: MEA Smart Climate Control Market Volume (K Unit), by Country 2024 & 2032
- Figure 25: MEA Smart Climate Control Market Revenue Share (%), by Country 2024 & 2032
- Figure 26: MEA Smart Climate Control Market Volume Share (%), by Country 2024 & 2032
- Figure 27: North America Smart Climate Control Market Revenue (Million), by Product Type 2024 & 2032
- Figure 28: North America Smart Climate Control Market Volume (K Unit), by Product Type 2024 & 2032
- Figure 29: North America Smart Climate Control Market Revenue Share (%), by Product Type 2024 & 2032
- Figure 30: North America Smart Climate Control Market Volume Share (%), by Product Type 2024 & 2032
- Figure 31: North America Smart Climate Control Market Revenue (Million), by Filtration Technology 2024 & 2032
- Figure 32: North America Smart Climate Control Market Volume (K Unit), by Filtration Technology 2024 & 2032
- Figure 33: North America Smart Climate Control Market Revenue Share (%), by Filtration Technology 2024 & 2032
- Figure 34: North America Smart Climate Control Market Volume Share (%), by Filtration Technology 2024 & 2032
- Figure 35: North America Smart Climate Control Market Revenue (Million), by Type 2024 & 2032
- Figure 36: North America Smart Climate Control Market Volume (K Unit), by Type 2024 & 2032
- Figure 37: North America Smart Climate Control Market Revenue Share (%), by Type 2024 & 2032
- Figure 38: North America Smart Climate Control Market Volume Share (%), by Type 2024 & 2032
- Figure 39: North America Smart Climate Control Market Revenue (Million), by Country 2024 & 2032
- Figure 40: North America Smart Climate Control Market Volume (K Unit), by Country 2024 & 2032
- Figure 41: North America Smart Climate Control Market Revenue Share (%), by Country 2024 & 2032
- Figure 42: North America Smart Climate Control Market Volume Share (%), by Country 2024 & 2032
- Figure 43: Europe Smart Climate Control Market Revenue (Million), by Product Type 2024 & 2032
- Figure 44: Europe Smart Climate Control Market Volume (K Unit), by Product Type 2024 & 2032
- Figure 45: Europe Smart Climate Control Market Revenue Share (%), by Product Type 2024 & 2032
- Figure 46: Europe Smart Climate Control Market Volume Share (%), by Product Type 2024 & 2032
- Figure 47: Europe Smart Climate Control Market Revenue (Million), by Filtration Technology 2024 & 2032
- Figure 48: Europe Smart Climate Control Market Volume (K Unit), by Filtration Technology 2024 & 2032
- Figure 49: Europe Smart Climate Control Market Revenue Share (%), by Filtration Technology 2024 & 2032
- Figure 50: Europe Smart Climate Control Market Volume Share (%), by Filtration Technology 2024 & 2032
- Figure 51: Europe Smart Climate Control Market Revenue (Million), by Type 2024 & 2032
- Figure 52: Europe Smart Climate Control Market Volume (K Unit), by Type 2024 & 2032
- Figure 53: Europe Smart Climate Control Market Revenue Share (%), by Type 2024 & 2032
- Figure 54: Europe Smart Climate Control Market Volume Share (%), by Type 2024 & 2032
- Figure 55: Europe Smart Climate Control Market Revenue (Million), by Country 2024 & 2032
- Figure 56: Europe Smart Climate Control Market Volume (K Unit), by Country 2024 & 2032
- Figure 57: Europe Smart Climate Control Market Revenue Share (%), by Country 2024 & 2032
- Figure 58: Europe Smart Climate Control Market Volume Share (%), by Country 2024 & 2032
- Figure 59: Asia Pacific Smart Climate Control Market Revenue (Million), by Product Type 2024 & 2032
- Figure 60: Asia Pacific Smart Climate Control Market Volume (K Unit), by Product Type 2024 & 2032
- Figure 61: Asia Pacific Smart Climate Control Market Revenue Share (%), by Product Type 2024 & 2032
- Figure 62: Asia Pacific Smart Climate Control Market Volume Share (%), by Product Type 2024 & 2032
- Figure 63: Asia Pacific Smart Climate Control Market Revenue (Million), by Filtration Technology 2024 & 2032
- Figure 64: Asia Pacific Smart Climate Control Market Volume (K Unit), by Filtration Technology 2024 & 2032
- Figure 65: Asia Pacific Smart Climate Control Market Revenue Share (%), by Filtration Technology 2024 & 2032
- Figure 66: Asia Pacific Smart Climate Control Market Volume Share (%), by Filtration Technology 2024 & 2032
- Figure 67: Asia Pacific Smart Climate Control Market Revenue (Million), by Type 2024 & 2032
- Figure 68: Asia Pacific Smart Climate Control Market Volume (K Unit), by Type 2024 & 2032
- Figure 69: Asia Pacific Smart Climate Control Market Revenue Share (%), by Type 2024 & 2032
- Figure 70: Asia Pacific Smart Climate Control Market Volume Share (%), by Type 2024 & 2032
- Figure 71: Asia Pacific Smart Climate Control Market Revenue (Million), by Country 2024 & 2032
- Figure 72: Asia Pacific Smart Climate Control Market Volume (K Unit), by Country 2024 & 2032
- Figure 73: Asia Pacific Smart Climate Control Market Revenue Share (%), by Country 2024 & 2032
- Figure 74: Asia Pacific Smart Climate Control Market Volume Share (%), by Country 2024 & 2032
- Figure 75: Rest of the World Smart Climate Control Market Revenue (Million), by Product Type 2024 & 2032
- Figure 76: Rest of the World Smart Climate Control Market Volume (K Unit), by Product Type 2024 & 2032
- Figure 77: Rest of the World Smart Climate Control Market Revenue Share (%), by Product Type 2024 & 2032
- Figure 78: Rest of the World Smart Climate Control Market Volume Share (%), by Product Type 2024 & 2032
- Figure 79: Rest of the World Smart Climate Control Market Revenue (Million), by Filtration Technology 2024 & 2032
- Figure 80: Rest of the World Smart Climate Control Market Volume (K Unit), by Filtration Technology 2024 & 2032
- Figure 81: Rest of the World Smart Climate Control Market Revenue Share (%), by Filtration Technology 2024 & 2032
- Figure 82: Rest of the World Smart Climate Control Market Volume Share (%), by Filtration Technology 2024 & 2032
- Figure 83: Rest of the World Smart Climate Control Market Revenue (Million), by Type 2024 & 2032
- Figure 84: Rest of the World Smart Climate Control Market Volume (K Unit), by Type 2024 & 2032
- Figure 85: Rest of the World Smart Climate Control Market Revenue Share (%), by Type 2024 & 2032
- Figure 86: Rest of the World Smart Climate Control Market Volume Share (%), by Type 2024 & 2032
- Figure 87: Rest of the World Smart Climate Control Market Revenue (Million), by Country 2024 & 2032
- Figure 88: Rest of the World Smart Climate Control Market Volume (K Unit), by Country 2024 & 2032
- Figure 89: Rest of the World Smart Climate Control Market Revenue Share (%), by Country 2024 & 2032
- Figure 90: Rest of the World Smart Climate Control Market Volume Share (%), by Country 2024 & 2032
List of Tables
- Table 1: Global Smart Climate Control Market Revenue Million Forecast, by Region 2019 & 2032
- Table 2: Global Smart Climate Control Market Volume K Unit Forecast, by Region 2019 & 2032
- Table 3: Global Smart Climate Control Market Revenue Million Forecast, by Product Type 2019 & 2032
- Table 4: Global Smart Climate Control Market Volume K Unit Forecast, by Product Type 2019 & 2032
- Table 5: Global Smart Climate Control Market Revenue Million Forecast, by Filtration Technology 2019 & 2032
- Table 6: Global Smart Climate Control Market Volume K Unit Forecast, by Filtration Technology 2019 & 2032
- Table 7: Global Smart Climate Control Market Revenue Million Forecast, by Type 2019 & 2032
- Table 8: Global Smart Climate Control Market Volume K Unit Forecast, by Type 2019 & 2032
- Table 9: Global Smart Climate Control Market Revenue Million Forecast, by Region 2019 & 2032
- Table 10: Global Smart Climate Control Market Volume K Unit Forecast, by Region 2019 & 2032
- Table 11: Global Smart Climate Control Market Revenue Million Forecast, by Country 2019 & 2032
- Table 12: Global Smart Climate Control Market Volume K Unit Forecast, by Country 2019 & 2032
- Table 13: United States Smart Climate Control Market Revenue (Million) Forecast, by Application 2019 & 2032
- Table 14: United States Smart Climate Control Market Volume (K Unit) Forecast, by Application 2019 & 2032
- Table 15: Canada Smart Climate Control Market Revenue (Million) Forecast, by Application 2019 & 2032
- Table 16: Canada Smart Climate Control Market Volume (K Unit) Forecast, by Application 2019 & 2032
- Table 17: Mexico Smart Climate Control Market Revenue (Million) Forecast, by Application 2019 & 2032
- Table 18: Mexico Smart Climate Control Market Volume (K Unit) Forecast, by Application 2019 & 2032
- Table 19: Global Smart Climate Control Market Revenue Million Forecast, by Country 2019 & 2032
- Table 20: Global Smart Climate Control Market Volume K Unit Forecast, by Country 2019 & 2032
- Table 21: Germany Smart Climate Control Market Revenue (Million) Forecast, by Application 2019 & 2032
- Table 22: Germany Smart Climate Control Market Volume (K Unit) Forecast, by Application 2019 & 2032
- Table 23: United Kingdom Smart Climate Control Market Revenue (Million) Forecast, by Application 2019 & 2032
- Table 24: United Kingdom Smart Climate Control Market Volume (K Unit) Forecast, by Application 2019 & 2032
- Table 25: France Smart Climate Control Market Revenue (Million) Forecast, by Application 2019 & 2032
- Table 26: France Smart Climate Control Market Volume (K Unit) Forecast, by Application 2019 & 2032
- Table 27: Spain Smart Climate Control Market Revenue (Million) Forecast, by Application 2019 & 2032
- Table 28: Spain Smart Climate Control Market Volume (K Unit) Forecast, by Application 2019 & 2032
- Table 29: Italy Smart Climate Control Market Revenue (Million) Forecast, by Application 2019 & 2032
- Table 30: Italy Smart Climate Control Market Volume (K Unit) Forecast, by Application 2019 & 2032
- Table 31: Spain Smart Climate Control Market Revenue (Million) Forecast, by Application 2019 & 2032
- Table 32: Spain Smart Climate Control Market Volume (K Unit) Forecast, by Application 2019 & 2032
- Table 33: Belgium Smart Climate Control Market Revenue (Million) Forecast, by Application 2019 & 2032
- Table 34: Belgium Smart Climate Control Market Volume (K Unit) Forecast, by Application 2019 & 2032
- Table 35: Netherland Smart Climate Control Market Revenue (Million) Forecast, by Application 2019 & 2032
- Table 36: Netherland Smart Climate Control Market Volume (K Unit) Forecast, by Application 2019 & 2032
- Table 37: Nordics Smart Climate Control Market Revenue (Million) Forecast, by Application 2019 & 2032
- Table 38: Nordics Smart Climate Control Market Volume (K Unit) Forecast, by Application 2019 & 2032
- Table 39: Rest of Europe Smart Climate Control Market Revenue (Million) Forecast, by Application 2019 & 2032
- Table 40: Rest of Europe Smart Climate Control Market Volume (K Unit) Forecast, by Application 2019 & 2032
- Table 41: Global Smart Climate Control Market Revenue Million Forecast, by Country 2019 & 2032
- Table 42: Global Smart Climate Control Market Volume K Unit Forecast, by Country 2019 & 2032
- Table 43: China Smart Climate Control Market Revenue (Million) Forecast, by Application 2019 & 2032
- Table 44: China Smart Climate Control Market Volume (K Unit) Forecast, by Application 2019 & 2032
- Table 45: Japan Smart Climate Control Market Revenue (Million) Forecast, by Application 2019 & 2032
- Table 46: Japan Smart Climate Control Market Volume (K Unit) Forecast, by Application 2019 & 2032
- Table 47: India Smart Climate Control Market Revenue (Million) Forecast, by Application 2019 & 2032
- Table 48: India Smart Climate Control Market Volume (K Unit) Forecast, by Application 2019 & 2032
- Table 49: South Korea Smart Climate Control Market Revenue (Million) Forecast, by Application 2019 & 2032
- Table 50: South Korea Smart Climate Control Market Volume (K Unit) Forecast, by Application 2019 & 2032
- Table 51: Southeast Asia Smart Climate Control Market Revenue (Million) Forecast, by Application 2019 & 2032
- Table 52: Southeast Asia Smart Climate Control Market Volume (K Unit) Forecast, by Application 2019 & 2032
- Table 53: Australia Smart Climate Control Market Revenue (Million) Forecast, by Application 2019 & 2032
- Table 54: Australia Smart Climate Control Market Volume (K Unit) Forecast, by Application 2019 & 2032
- Table 55: Indonesia Smart Climate Control Market Revenue (Million) Forecast, by Application 2019 & 2032
- Table 56: Indonesia Smart Climate Control Market Volume (K Unit) Forecast, by Application 2019 & 2032
- Table 57: Phillipes Smart Climate Control Market Revenue (Million) Forecast, by Application 2019 & 2032
- Table 58: Phillipes Smart Climate Control Market Volume (K Unit) Forecast, by Application 2019 & 2032
- Table 59: Singapore Smart Climate Control Market Revenue (Million) Forecast, by Application 2019 & 2032
- Table 60: Singapore Smart Climate Control Market Volume (K Unit) Forecast, by Application 2019 & 2032
- Table 61: Thailandc Smart Climate Control Market Revenue (Million) Forecast, by Application 2019 & 2032
- Table 62: Thailandc Smart Climate Control Market Volume (K Unit) Forecast, by Application 2019 & 2032
- Table 63: Rest of Asia Pacific Smart Climate Control Market Revenue (Million) Forecast, by Application 2019 & 2032
- Table 64: Rest of Asia Pacific Smart Climate Control Market Volume (K Unit) Forecast, by Application 2019 & 2032
- Table 65: Global Smart Climate Control Market Revenue Million Forecast, by Country 2019 & 2032
- Table 66: Global Smart Climate Control Market Volume K Unit Forecast, by Country 2019 & 2032
- Table 67: Brazil Smart Climate Control Market Revenue (Million) Forecast, by Application 2019 & 2032
- Table 68: Brazil Smart Climate Control Market Volume (K Unit) Forecast, by Application 2019 & 2032
- Table 69: Argentina Smart Climate Control Market Revenue (Million) Forecast, by Application 2019 & 2032
- Table 70: Argentina Smart Climate Control Market Volume (K Unit) Forecast, by Application 2019 & 2032
- Table 71: Peru Smart Climate Control Market Revenue (Million) Forecast, by Application 2019 & 2032
- Table 72: Peru Smart Climate Control Market Volume (K Unit) Forecast, by Application 2019 & 2032
- Table 73: Chile Smart Climate Control Market Revenue (Million) Forecast, by Application 2019 & 2032
- Table 74: Chile Smart Climate Control Market Volume (K Unit) Forecast, by Application 2019 & 2032
- Table 75: Colombia Smart Climate Control Market Revenue (Million) Forecast, by Application 2019 & 2032
- Table 76: Colombia Smart Climate Control Market Volume (K Unit) Forecast, by Application 2019 & 2032
- Table 77: Ecuador Smart Climate Control Market Revenue (Million) Forecast, by Application 2019 & 2032
- Table 78: Ecuador Smart Climate Control Market Volume (K Unit) Forecast, by Application 2019 & 2032
- Table 79: Venezuela Smart Climate Control Market Revenue (Million) Forecast, by Application 2019 & 2032
- Table 80: Venezuela Smart Climate Control Market Volume (K Unit) Forecast, by Application 2019 & 2032
- Table 81: Rest of South America Smart Climate Control Market Revenue (Million) Forecast, by Application 2019 & 2032
- Table 82: Rest of South America Smart Climate Control Market Volume (K Unit) Forecast, by Application 2019 & 2032
- Table 83: Global Smart Climate Control Market Revenue Million Forecast, by Country 2019 & 2032
- Table 84: Global Smart Climate Control Market Volume K Unit Forecast, by Country 2019 & 2032
- Table 85: United States Smart Climate Control Market Revenue (Million) Forecast, by Application 2019 & 2032
- Table 86: United States Smart Climate Control Market Volume (K Unit) Forecast, by Application 2019 & 2032
- Table 87: Canada Smart Climate Control Market Revenue (Million) Forecast, by Application 2019 & 2032
- Table 88: Canada Smart Climate Control Market Volume (K Unit) Forecast, by Application 2019 & 2032
- Table 89: Mexico Smart Climate Control Market Revenue (Million) Forecast, by Application 2019 & 2032
- Table 90: Mexico Smart Climate Control Market Volume (K Unit) Forecast, by Application 2019 & 2032
- Table 91: Global Smart Climate Control Market Revenue Million Forecast, by Country 2019 & 2032
- Table 92: Global Smart Climate Control Market Volume K Unit Forecast, by Country 2019 & 2032
- Table 93: United Arab Emirates Smart Climate Control Market Revenue (Million) Forecast, by Application 2019 & 2032
- Table 94: United Arab Emirates Smart Climate Control Market Volume (K Unit) Forecast, by Application 2019 & 2032
- Table 95: Saudi Arabia Smart Climate Control Market Revenue (Million) Forecast, by Application 2019 & 2032
- Table 96: Saudi Arabia Smart Climate Control Market Volume (K Unit) Forecast, by Application 2019 & 2032
- Table 97: South Africa Smart Climate Control Market Revenue (Million) Forecast, by Application 2019 & 2032
- Table 98: South Africa Smart Climate Control Market Volume (K Unit) Forecast, by Application 2019 & 2032
- Table 99: Rest of Middle East and Africa Smart Climate Control Market Revenue (Million) Forecast, by Application 2019 & 2032
- Table 100: Rest of Middle East and Africa Smart Climate Control Market Volume (K Unit) Forecast, by Application 2019 & 2032
- Table 101: Global Smart Climate Control Market Revenue Million Forecast, by Product Type 2019 & 2032
- Table 102: Global Smart Climate Control Market Volume K Unit Forecast, by Product Type 2019 & 2032
- Table 103: Global Smart Climate Control Market Revenue Million Forecast, by Filtration Technology 2019 & 2032
- Table 104: Global Smart Climate Control Market Volume K Unit Forecast, by Filtration Technology 2019 & 2032
- Table 105: Global Smart Climate Control Market Revenue Million Forecast, by Type 2019 & 2032
- Table 106: Global Smart Climate Control Market Volume K Unit Forecast, by Type 2019 & 2032
- Table 107: Global Smart Climate Control Market Revenue Million Forecast, by Country 2019 & 2032
- Table 108: Global Smart Climate Control Market Volume K Unit Forecast, by Country 2019 & 2032
- Table 109: United States Smart Climate Control Market Revenue (Million) Forecast, by Application 2019 & 2032
- Table 110: United States Smart Climate Control Market Volume (K Unit) Forecast, by Application 2019 & 2032
- Table 111: Canada Smart Climate Control Market Revenue (Million) Forecast, by Application 2019 & 2032
- Table 112: Canada Smart Climate Control Market Volume (K Unit) Forecast, by Application 2019 & 2032
- Table 113: Global Smart Climate Control Market Revenue Million Forecast, by Product Type 2019 & 2032
- Table 114: Global Smart Climate Control Market Volume K Unit Forecast, by Product Type 2019 & 2032
- Table 115: Global Smart Climate Control Market Revenue Million Forecast, by Filtration Technology 2019 & 2032
- Table 116: Global Smart Climate Control Market Volume K Unit Forecast, by Filtration Technology 2019 & 2032
- Table 117: Global Smart Climate Control Market Revenue Million Forecast, by Type 2019 & 2032
- Table 118: Global Smart Climate Control Market Volume K Unit Forecast, by Type 2019 & 2032
- Table 119: Global Smart Climate Control Market Revenue Million Forecast, by Country 2019 & 2032
- Table 120: Global Smart Climate Control Market Volume K Unit Forecast, by Country 2019 & 2032
- Table 121: Germany Smart Climate Control Market Revenue (Million) Forecast, by Application 2019 & 2032
- Table 122: Germany Smart Climate Control Market Volume (K Unit) Forecast, by Application 2019 & 2032
- Table 123: United Kingdom Smart Climate Control Market Revenue (Million) Forecast, by Application 2019 & 2032
- Table 124: United Kingdom Smart Climate Control Market Volume (K Unit) Forecast, by Application 2019 & 2032
- Table 125: France Smart Climate Control Market Revenue (Million) Forecast, by Application 2019 & 2032
- Table 126: France Smart Climate Control Market Volume (K Unit) Forecast, by Application 2019 & 2032
- Table 127: Spain Smart Climate Control Market Revenue (Million) Forecast, by Application 2019 & 2032
- Table 128: Spain Smart Climate Control Market Volume (K Unit) Forecast, by Application 2019 & 2032
- Table 129: Rest of Europe Smart Climate Control Market Revenue (Million) Forecast, by Application 2019 & 2032
- Table 130: Rest of Europe Smart Climate Control Market Volume (K Unit) Forecast, by Application 2019 & 2032
- Table 131: Global Smart Climate Control Market Revenue Million Forecast, by Product Type 2019 & 2032
- Table 132: Global Smart Climate Control Market Volume K Unit Forecast, by Product Type 2019 & 2032
- Table 133: Global Smart Climate Control Market Revenue Million Forecast, by Filtration Technology 2019 & 2032
- Table 134: Global Smart Climate Control Market Volume K Unit Forecast, by Filtration Technology 2019 & 2032
- Table 135: Global Smart Climate Control Market Revenue Million Forecast, by Type 2019 & 2032
- Table 136: Global Smart Climate Control Market Volume K Unit Forecast, by Type 2019 & 2032
- Table 137: Global Smart Climate Control Market Revenue Million Forecast, by Country 2019 & 2032
- Table 138: Global Smart Climate Control Market Volume K Unit Forecast, by Country 2019 & 2032
- Table 139: China Smart Climate Control Market Revenue (Million) Forecast, by Application 2019 & 2032
- Table 140: China Smart Climate Control Market Volume (K Unit) Forecast, by Application 2019 & 2032
- Table 141: Japan Smart Climate Control Market Revenue (Million) Forecast, by Application 2019 & 2032
- Table 142: Japan Smart Climate Control Market Volume (K Unit) Forecast, by Application 2019 & 2032
- Table 143: Rest of Asia Pacific Smart Climate Control Market Revenue (Million) Forecast, by Application 2019 & 2032
- Table 144: Rest of Asia Pacific Smart Climate Control Market Volume (K Unit) Forecast, by Application 2019 & 2032
- Table 145: Global Smart Climate Control Market Revenue Million Forecast, by Product Type 2019 & 2032
- Table 146: Global Smart Climate Control Market Volume K Unit Forecast, by Product Type 2019 & 2032
- Table 147: Global Smart Climate Control Market Revenue Million Forecast, by Filtration Technology 2019 & 2032
- Table 148: Global Smart Climate Control Market Volume K Unit Forecast, by Filtration Technology 2019 & 2032
- Table 149: Global Smart Climate Control Market Revenue Million Forecast, by Type 2019 & 2032
- Table 150: Global Smart Climate Control Market Volume K Unit Forecast, by Type 2019 & 2032
- Table 151: Global Smart Climate Control Market Revenue Million Forecast, by Country 2019 & 2032
- Table 152: Global Smart Climate Control Market Volume K Unit Forecast, by Country 2019 & 2032
Frequently Asked Questions
1. What is the projected Compound Annual Growth Rate (CAGR) of the Smart Climate Control Market?
The projected CAGR is approximately 16.85%.
2. Which companies are prominent players in the Smart Climate Control Market?
Key companies in the market include Dyson Ltd, Honeywell International Inc, Daikin Industries Ltd , LG Electronics Inc, Unilever PLC (Blueair AB), Xiaomi Corp, AllerAir Industries Inc, Koninklijke Philips NV, Sharp Corporation, Wirlpool Corporation.
3. What are the main segments of the Smart Climate Control Market?
The market segments include Product Type, Filtration Technology, Type.
4. Can you provide details about the market size?
The market size is estimated to be USD 7.13 Million as of 2022.
5. What are some drivers contributing to market growth?
Increasing Health Problems Associated with Air Pollution; Growing Household Spending.
6. What are the notable trends driving market growth?
Growing Household Spending.
7. Are there any restraints impacting market growth?
High Adoption and Maintenance Costs.
8. Can you provide examples of recent developments in the market?
March 2023: According to IQAir World Air Quality Report 2022, only 5% of countries meet WHO PM2.5 air pollution guidelines. As citizens get involved and become aware of air quality monitoring, there is a shift in awareness, leading to demand for smart air purifiers that works efficiently.
9. What pricing options are available for accessing the report?
Pricing options include single-user, multi-user, and enterprise licenses priced at USD 4750, USD 5250, and USD 8750 respectively.
10. Is the market size provided in terms of value or volume?
The market size is provided in terms of value, measured in Million and volume, measured in K Unit.
11. Are there any specific market keywords associated with the report?
Yes, the market keyword associated with the report is "Smart Climate Control Market," which aids in identifying and referencing the specific market segment covered.
12. How do I determine which pricing option suits my needs best?
The pricing options vary based on user requirements and access needs. Individual users may opt for single-user licenses, while businesses requiring broader access may choose multi-user or enterprise licenses for cost-effective access to the report.
13. Are there any additional resources or data provided in the Smart Climate Control Market report?
While the report offers comprehensive insights, it's advisable to review the specific contents or supplementary materials provided to ascertain if additional resources or data are available.
14. How can I stay updated on further developments or reports in the Smart Climate Control Market?
To stay informed about further developments, trends, and reports in the Smart Climate Control Market, consider subscribing to industry newsletters, following relevant companies and organizations, or regularly checking reputable industry news sources and publications.
Methodology
Step 1 - Identification of Relevant Samples Size from Population Database


Step 2 - Approaches for Defining Global Market Size (Value, Volume* & Price*)

Note*: In applicable scenarios
Step 3 - Data Sources
Primary Research
- Web Analytics
- Survey Reports
- Research Institute
- Latest Research Reports
- Opinion Leaders
Secondary Research
- Annual Reports
- White Paper
- Latest Press Release
- Industry Association
- Paid Database
- Investor Presentations

Step 4 - Data Triangulation
Involves using different sources of information in order to increase the validity of a study
These sources are likely to be stakeholders in a program - participants, other researchers, program staff, other community members, and so on.
Then we put all data in single framework & apply various statistical tools to find out the dynamic on the market.
During the analysis stage, feedback from the stakeholder groups would be compared to determine areas of agreement as well as areas of divergence


