
Key Insights
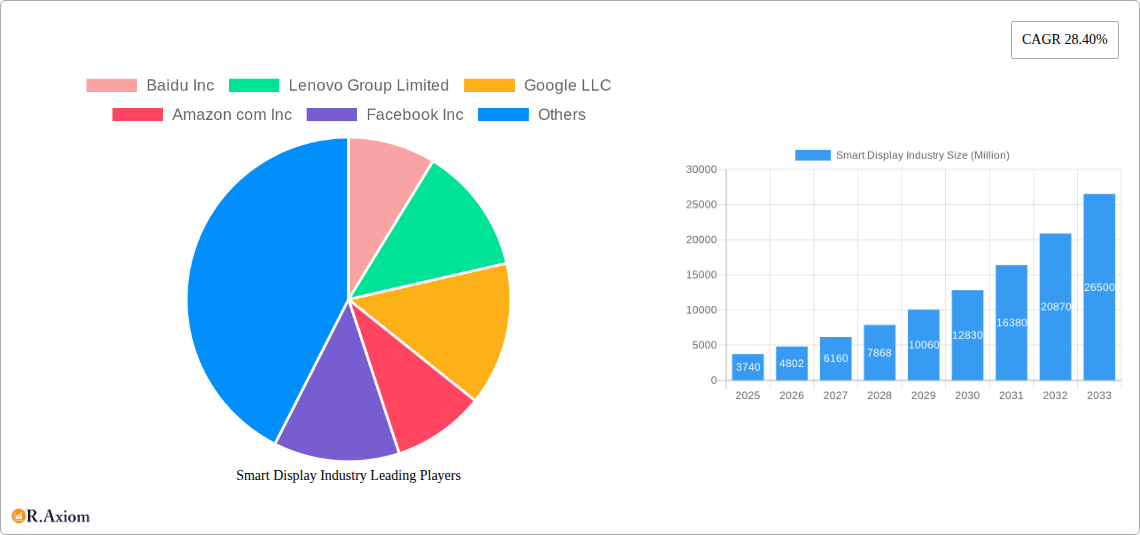
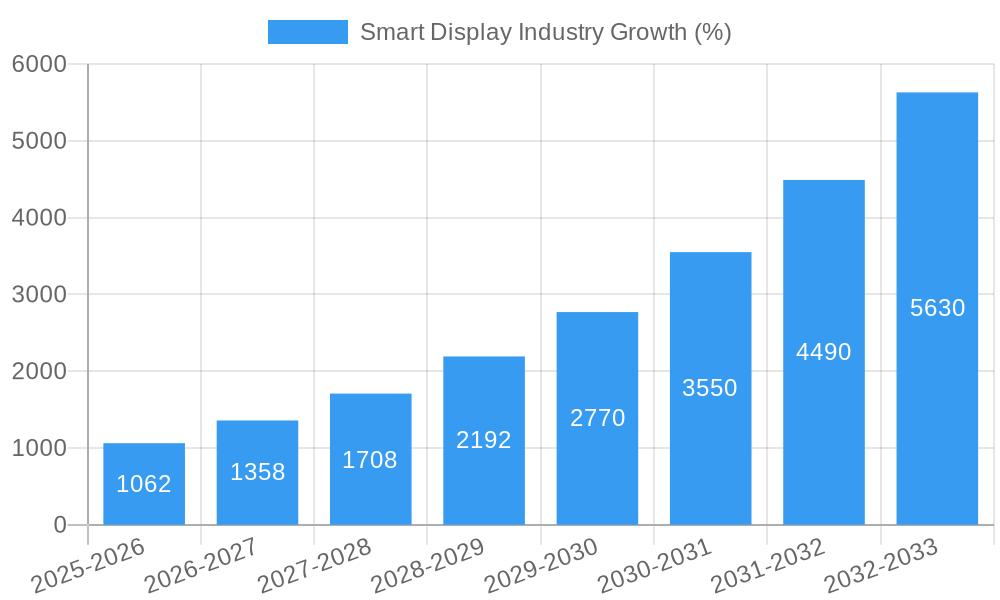
The smart display market, valued at $3.74 billion in 2025, is experiencing robust growth, projected to expand at a compound annual growth rate (CAGR) of 28.40% from 2025 to 2033. This surge is driven by several key factors. Increasing consumer adoption of smart home technologies, fueled by the convenience and integration offered by smart displays, is a primary driver. The rising demand for voice-activated assistants and personalized user experiences further accelerates market growth. Furthermore, advancements in display technology, such as improved screen resolution and larger screen sizes, are enhancing the overall user experience, making smart displays more appealing to a wider consumer base. The integration of smart displays into various applications, including home automation, business communication, and industrial monitoring systems, is broadening the market's potential significantly. Strong competition among key players like Amazon, Google, Baidu, and Lenovo is leading to continuous innovation and the introduction of feature-rich products at competitive prices, which in turn fuels market expansion.
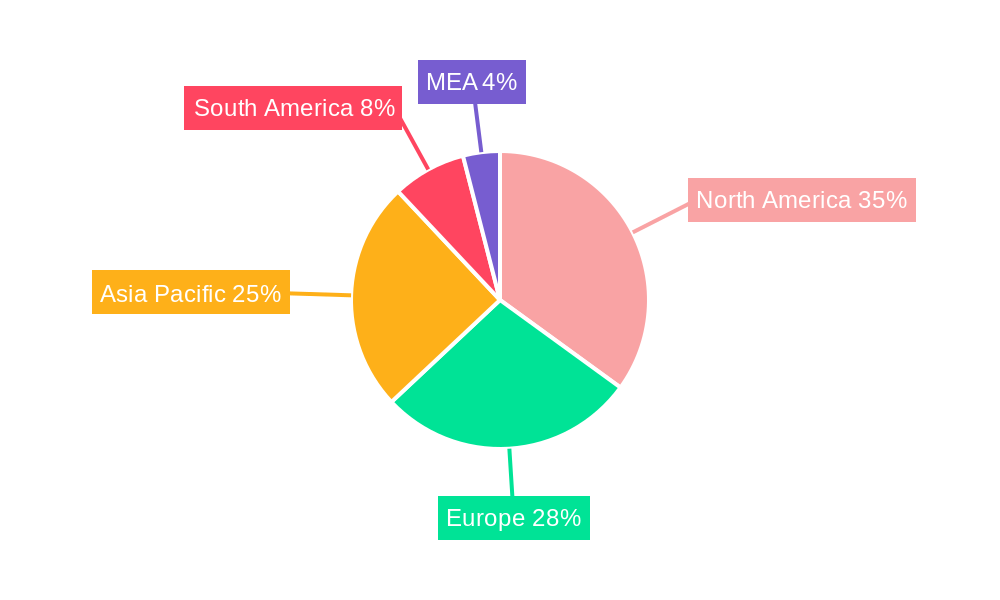
The market segmentation reveals a strong demand across various product types, with smart speakers and smart home displays leading the charge. The home application segment currently holds the largest market share, owing to the increasing penetration of smart home ecosystems. However, the business and industrial segments are experiencing rapid growth, driven by the increasing adoption of smart displays for enhanced productivity and efficiency in workplaces and industrial settings. Geographic analysis indicates that North America and Asia-Pacific currently represent significant markets, although growth is expected to be more pronounced in rapidly developing economies across Asia-Pacific and South America. Sustained investments in research and development coupled with collaborative partnerships between tech giants and smaller niche players will further contribute to shaping the future of the smart display industry. Challenges remain, however, including concerns around data privacy and security which could impede wider adoption.
Smart Display Industry Market Report: 2019-2033
This comprehensive report provides an in-depth analysis of the global smart display industry, covering the period from 2019 to 2033. With a focus on market concentration, innovation, trends, and future growth opportunities, this report is an essential resource for industry stakeholders, investors, and strategic decision-makers. The report leverages extensive data analysis to provide actionable insights into the rapidly evolving landscape of smart displays, including smart home displays, smart speakers, smart clocks, and smart glasses across home, business, and industrial applications. The estimated market size in 2025 is valued at $XX Million, with a projected Compound Annual Growth Rate (CAGR) of XX% from 2025 to 2033.
Smart Display Industry Market Concentration & Innovation
The smart display industry exhibits a moderately concentrated market structure, with key players such as Baidu Inc, Lenovo Group Limited, Google LLC, Amazon com Inc, Facebook Inc, JBL (Harman International), and LG Electronics Inc holding significant market share. Market share distribution varies across product types and applications, with significant potential for consolidation through mergers and acquisitions (M&A). Innovation is driven by advancements in display technology (e.g., micro OLED, flexible displays), improved voice recognition and AI capabilities, and the integration of smart home ecosystems. Regulatory frameworks concerning data privacy and security significantly impact market dynamics. Product substitutes, such as traditional displays and simpler audio devices, pose competitive pressure. End-user trends towards personalized experiences and seamless device integration are key drivers, while M&A activity is expected to increase, with deal values exceeding $XX Million annually in the forecast period.
- Market Share (2024 Estimate): Google LLC: XX%; Amazon com Inc: XX%; Baidu Inc: XX%; Others: XX%
- M&A Deal Value (2019-2024): $XX Million
- Projected M&A Deal Value (2025-2033): $XX Million
Smart Display Industry Industry Trends & Insights
The global smart display market is experiencing robust growth, fueled by increasing consumer adoption of smart home devices, technological advancements in voice assistants and AI, and the rising demand for seamless connectivity across devices. The market witnessed a CAGR of XX% during the historical period (2019-2024) and is projected to maintain a strong CAGR of XX% throughout the forecast period (2025-2033). This growth is driven by factors such as decreasing device prices, enhanced user interfaces, and the increasing integration of smart displays into various aspects of daily life. Technological disruptions, such as the introduction of advanced display technologies (e.g., micro-LED, flexible displays) and improved AI algorithms, continue to shape market dynamics. Consumer preferences are shifting towards more personalized and customizable smart display experiences, with features like facial recognition and personalized content recommendations gaining popularity. Competitive dynamics are intense, with existing players continually launching new products and features to maintain market leadership and attract new users. Market penetration for smart displays is expected to reach XX% by 2033, with significant growth in emerging markets.
Dominant Markets & Segments in Smart Display Industry
The North American region currently holds the largest market share in the smart display industry, driven by high consumer disposable income and early adoption of smart home technologies. However, the Asia-Pacific region is expected to witness the fastest growth during the forecast period.
- Leading Segment: Smart home displays dominate the market due to their versatility and integration into various smart home ecosystems.
- Key Drivers in North America: High consumer spending, advanced infrastructure, established technological ecosystem.
- Key Drivers in Asia-Pacific: Rapid urbanization, growing disposable incomes, increased smartphone penetration.
Within product types, smart home displays and smart speakers hold the largest market shares, while smart clocks and smart glasses are emerging segments with significant growth potential. In terms of applications, the home segment currently leads, though the business and industrial applications are expected to see significant growth due to increasing demand for automation and data visualization in professional settings. The dominance of specific regions and segments is closely tied to economic development levels, technological infrastructure, and government policies supporting smart home initiatives.
Smart Display Industry Product Developments
Recent years have seen a surge in smart display innovations, with companies focusing on improving display quality, integrating advanced AI features, and enhancing user experiences. Key advancements include the incorporation of higher-resolution displays, improved voice recognition accuracy, and the development of more user-friendly interfaces. These advancements are driving product differentiation and expanding the applications of smart displays across various sectors, making them more valuable and efficient in both home and professional settings.
Report Scope & Segmentation Analysis
This report segments the smart display market by product type (smart home displays, smart speakers, smart clocks, smart glasses) and application (home, business, industry). Each segment’s growth projection, market size, and competitive dynamics are analyzed. Growth is expected to be highest in smart glasses and business applications. The competitive landscape differs across segments, with established players dominating some segments while new entrants compete in others.
Key Drivers of Smart Display Industry Growth
Several key factors drive growth in the smart display industry: Technological advancements in display and AI technologies, increasing affordability of smart devices, rising consumer demand for convenience and connected experiences, favorable government policies promoting the adoption of smart home technologies, and the expansion of robust internet infrastructure.
Challenges in the Smart Display Industry Sector
Challenges include concerns about data privacy and security, high initial costs of smart displays, technical complexities and compatibility issues among devices, and dependence on stable internet connectivity. Supply chain disruptions and intense competition among major players also present ongoing obstacles. These factors can impact market growth and profitability.
Emerging Opportunities in Smart Display Industry
Emerging opportunities include the growing adoption of smart displays in the healthcare sector, the increasing demand for personalized and interactive displays in education, and the integration of smart displays into automotive applications. The development of new, innovative display technologies like micro-LED is also expected to create substantial opportunities for growth.
Leading Players in the Smart Display Industry Market
- Baidu Inc
- Lenovo Group Limited
- Google LLC
- Amazon com Inc
- Facebook Inc
- JBL (Harman International)
- LG Electronics Inc
Key Developments in Smart Display Industry Industry
- January 2022: Google launched its second-generation Nest Hub in India, featuring a floating glass display and Nest Audio technology. This expanded Google's presence in a key emerging market.
- September 2022: Lenovo launched its Lenovo Glasses T1 (also known as Lenovo Yoga Glasses in China), featuring micro OLED displays, USB-C connectivity, and built-in speakers. This marked Lenovo's entry into the smart glasses market.
Strategic Outlook for Smart Display Industry Market
The smart display industry is poised for continued expansion, driven by technological advancements, increasing consumer adoption, and the broadening range of applications. Opportunities exist in developing innovative products, expanding into new markets, and fostering strategic partnerships to capitalize on the growing demand for connected and personalized experiences. The focus on enhanced security features and privacy protection will become increasingly crucial for market success.
Smart Display Industry Segmentation
-
1. Product Type
- 1.1. Smart home displays
- 1.2. Smart speakers
- 1.3. Smart clocks
- 1.4. Smart glasses
-
2. Application
- 2.1. Home
- 2.2. Business
- 2.3. Industry
Smart Display Industry Segmentation By Geography
- 1. North America
- 2. Europe
- 3. Asia Pacific
- 4. Rest of the World
Smart Display Industry REPORT HIGHLIGHTS
| Aspects | Details |
|---|---|
| Study Period | 2019-2033 |
| Base Year | 2024 |
| Estimated Year | 2025 |
| Forecast Period | 2025-2033 |
| Historical Period | 2019-2024 |
| Growth Rate | CAGR of 28.40% from 2019-2033 |
| Segmentation |
|
Table of Contents
- 1. Introduction
- 1.1. Research Scope
- 1.2. Market Segmentation
- 1.3. Research Methodology
- 1.4. Definitions and Assumptions
- 2. Executive Summary
- 2.1. Introduction
- 3. Market Dynamics
- 3.1. Introduction
- 3.2. Market Drivers
- 3.2.1. Increasing Demand of Smart Home Devices
- 3.3. Market Restrains
- 3.3.1. High Cost and Limited Set of Vocabulary
- 3.4. Market Trends
- 3.4.1. Connected Device to Drive the Market Growth
- 4. Market Factor Analysis
- 4.1. Porters Five Forces
- 4.2. Supply/Value Chain
- 4.3. PESTEL analysis
- 4.4. Market Entropy
- 4.5. Patent/Trademark Analysis
- 5. Global Smart Display Industry Analysis, Insights and Forecast, 2019-2031
- 5.1. Market Analysis, Insights and Forecast - by Product Type
- 5.1.1. Smart home displays
- 5.1.2. Smart speakers
- 5.1.3. Smart clocks
- 5.1.4. Smart glasses
- 5.2. Market Analysis, Insights and Forecast - by Application
- 5.2.1. Home
- 5.2.2. Business
- 5.2.3. Industry
- 5.3. Market Analysis, Insights and Forecast - by Region
- 5.3.1. North America
- 5.3.2. Europe
- 5.3.3. Asia Pacific
- 5.3.4. Rest of the World
- 5.1. Market Analysis, Insights and Forecast - by Product Type
- 6. North America Smart Display Industry Analysis, Insights and Forecast, 2019-2031
- 6.1. Market Analysis, Insights and Forecast - by Product Type
- 6.1.1. Smart home displays
- 6.1.2. Smart speakers
- 6.1.3. Smart clocks
- 6.1.4. Smart glasses
- 6.2. Market Analysis, Insights and Forecast - by Application
- 6.2.1. Home
- 6.2.2. Business
- 6.2.3. Industry
- 6.1. Market Analysis, Insights and Forecast - by Product Type
- 7. Europe Smart Display Industry Analysis, Insights and Forecast, 2019-2031
- 7.1. Market Analysis, Insights and Forecast - by Product Type
- 7.1.1. Smart home displays
- 7.1.2. Smart speakers
- 7.1.3. Smart clocks
- 7.1.4. Smart glasses
- 7.2. Market Analysis, Insights and Forecast - by Application
- 7.2.1. Home
- 7.2.2. Business
- 7.2.3. Industry
- 7.1. Market Analysis, Insights and Forecast - by Product Type
- 8. Asia Pacific Smart Display Industry Analysis, Insights and Forecast, 2019-2031
- 8.1. Market Analysis, Insights and Forecast - by Product Type
- 8.1.1. Smart home displays
- 8.1.2. Smart speakers
- 8.1.3. Smart clocks
- 8.1.4. Smart glasses
- 8.2. Market Analysis, Insights and Forecast - by Application
- 8.2.1. Home
- 8.2.2. Business
- 8.2.3. Industry
- 8.1. Market Analysis, Insights and Forecast - by Product Type
- 9. Rest of the World Smart Display Industry Analysis, Insights and Forecast, 2019-2031
- 9.1. Market Analysis, Insights and Forecast - by Product Type
- 9.1.1. Smart home displays
- 9.1.2. Smart speakers
- 9.1.3. Smart clocks
- 9.1.4. Smart glasses
- 9.2. Market Analysis, Insights and Forecast - by Application
- 9.2.1. Home
- 9.2.2. Business
- 9.2.3. Industry
- 9.1. Market Analysis, Insights and Forecast - by Product Type
- 10. North America Smart Display Industry Analysis, Insights and Forecast, 2019-2031
- 10.1. Market Analysis, Insights and Forecast - By Country/Sub-region
- 10.1.1 United States
- 10.1.2 Canada
- 10.1.3 Mexico
- 11. Europe Smart Display Industry Analysis, Insights and Forecast, 2019-2031
- 11.1. Market Analysis, Insights and Forecast - By Country/Sub-region
- 11.1.1 Germany
- 11.1.2 United Kingdom
- 11.1.3 France
- 11.1.4 Spain
- 11.1.5 Italy
- 11.1.6 Spain
- 11.1.7 Belgium
- 11.1.8 Netherland
- 11.1.9 Nordics
- 11.1.10 Rest of Europe
- 12. Asia Pacific Smart Display Industry Analysis, Insights and Forecast, 2019-2031
- 12.1. Market Analysis, Insights and Forecast - By Country/Sub-region
- 12.1.1 China
- 12.1.2 Japan
- 12.1.3 India
- 12.1.4 South Korea
- 12.1.5 Southeast Asia
- 12.1.6 Australia
- 12.1.7 Indonesia
- 12.1.8 Phillipes
- 12.1.9 Singapore
- 12.1.10 Thailandc
- 12.1.11 Rest of Asia Pacific
- 13. South America Smart Display Industry Analysis, Insights and Forecast, 2019-2031
- 13.1. Market Analysis, Insights and Forecast - By Country/Sub-region
- 13.1.1 Brazil
- 13.1.2 Argentina
- 13.1.3 Peru
- 13.1.4 Chile
- 13.1.5 Colombia
- 13.1.6 Ecuador
- 13.1.7 Venezuela
- 13.1.8 Rest of South America
- 14. MEA Smart Display Industry Analysis, Insights and Forecast, 2019-2031
- 14.1. Market Analysis, Insights and Forecast - By Country/Sub-region
- 14.1.1 United Arab Emirates
- 14.1.2 Saudi Arabia
- 14.1.3 South Africa
- 14.1.4 Rest of Middle East and Africa
- 15. Competitive Analysis
- 15.1. Global Market Share Analysis 2024
- 15.2. Company Profiles
- 15.2.1 Baidu Inc
- 15.2.1.1. Overview
- 15.2.1.2. Products
- 15.2.1.3. SWOT Analysis
- 15.2.1.4. Recent Developments
- 15.2.1.5. Financials (Based on Availability)
- 15.2.2 Lenovo Group Limited
- 15.2.2.1. Overview
- 15.2.2.2. Products
- 15.2.2.3. SWOT Analysis
- 15.2.2.4. Recent Developments
- 15.2.2.5. Financials (Based on Availability)
- 15.2.3 Google LLC
- 15.2.3.1. Overview
- 15.2.3.2. Products
- 15.2.3.3. SWOT Analysis
- 15.2.3.4. Recent Developments
- 15.2.3.5. Financials (Based on Availability)
- 15.2.4 Amazon com Inc
- 15.2.4.1. Overview
- 15.2.4.2. Products
- 15.2.4.3. SWOT Analysis
- 15.2.4.4. Recent Developments
- 15.2.4.5. Financials (Based on Availability)
- 15.2.5 Facebook Inc
- 15.2.5.1. Overview
- 15.2.5.2. Products
- 15.2.5.3. SWOT Analysis
- 15.2.5.4. Recent Developments
- 15.2.5.5. Financials (Based on Availability)
- 15.2.6 JBL ( Harman International)
- 15.2.6.1. Overview
- 15.2.6.2. Products
- 15.2.6.3. SWOT Analysis
- 15.2.6.4. Recent Developments
- 15.2.6.5. Financials (Based on Availability)
- 15.2.7 LG Electronics Inc
- 15.2.7.1. Overview
- 15.2.7.2. Products
- 15.2.7.3. SWOT Analysis
- 15.2.7.4. Recent Developments
- 15.2.7.5. Financials (Based on Availability)
- 15.2.1 Baidu Inc
List of Figures
- Figure 1: Global Smart Display Industry Revenue Breakdown (Million, %) by Region 2024 & 2032
- Figure 2: Global Smart Display Industry Volume Breakdown (K Unit, %) by Region 2024 & 2032
- Figure 3: North America Smart Display Industry Revenue (Million), by Country 2024 & 2032
- Figure 4: North America Smart Display Industry Volume (K Unit), by Country 2024 & 2032
- Figure 5: North America Smart Display Industry Revenue Share (%), by Country 2024 & 2032
- Figure 6: North America Smart Display Industry Volume Share (%), by Country 2024 & 2032
- Figure 7: Europe Smart Display Industry Revenue (Million), by Country 2024 & 2032
- Figure 8: Europe Smart Display Industry Volume (K Unit), by Country 2024 & 2032
- Figure 9: Europe Smart Display Industry Revenue Share (%), by Country 2024 & 2032
- Figure 10: Europe Smart Display Industry Volume Share (%), by Country 2024 & 2032
- Figure 11: Asia Pacific Smart Display Industry Revenue (Million), by Country 2024 & 2032
- Figure 12: Asia Pacific Smart Display Industry Volume (K Unit), by Country 2024 & 2032
- Figure 13: Asia Pacific Smart Display Industry Revenue Share (%), by Country 2024 & 2032
- Figure 14: Asia Pacific Smart Display Industry Volume Share (%), by Country 2024 & 2032
- Figure 15: South America Smart Display Industry Revenue (Million), by Country 2024 & 2032
- Figure 16: South America Smart Display Industry Volume (K Unit), by Country 2024 & 2032
- Figure 17: South America Smart Display Industry Revenue Share (%), by Country 2024 & 2032
- Figure 18: South America Smart Display Industry Volume Share (%), by Country 2024 & 2032
- Figure 19: MEA Smart Display Industry Revenue (Million), by Country 2024 & 2032
- Figure 20: MEA Smart Display Industry Volume (K Unit), by Country 2024 & 2032
- Figure 21: MEA Smart Display Industry Revenue Share (%), by Country 2024 & 2032
- Figure 22: MEA Smart Display Industry Volume Share (%), by Country 2024 & 2032
- Figure 23: North America Smart Display Industry Revenue (Million), by Product Type 2024 & 2032
- Figure 24: North America Smart Display Industry Volume (K Unit), by Product Type 2024 & 2032
- Figure 25: North America Smart Display Industry Revenue Share (%), by Product Type 2024 & 2032
- Figure 26: North America Smart Display Industry Volume Share (%), by Product Type 2024 & 2032
- Figure 27: North America Smart Display Industry Revenue (Million), by Application 2024 & 2032
- Figure 28: North America Smart Display Industry Volume (K Unit), by Application 2024 & 2032
- Figure 29: North America Smart Display Industry Revenue Share (%), by Application 2024 & 2032
- Figure 30: North America Smart Display Industry Volume Share (%), by Application 2024 & 2032
- Figure 31: North America Smart Display Industry Revenue (Million), by Country 2024 & 2032
- Figure 32: North America Smart Display Industry Volume (K Unit), by Country 2024 & 2032
- Figure 33: North America Smart Display Industry Revenue Share (%), by Country 2024 & 2032
- Figure 34: North America Smart Display Industry Volume Share (%), by Country 2024 & 2032
- Figure 35: Europe Smart Display Industry Revenue (Million), by Product Type 2024 & 2032
- Figure 36: Europe Smart Display Industry Volume (K Unit), by Product Type 2024 & 2032
- Figure 37: Europe Smart Display Industry Revenue Share (%), by Product Type 2024 & 2032
- Figure 38: Europe Smart Display Industry Volume Share (%), by Product Type 2024 & 2032
- Figure 39: Europe Smart Display Industry Revenue (Million), by Application 2024 & 2032
- Figure 40: Europe Smart Display Industry Volume (K Unit), by Application 2024 & 2032
- Figure 41: Europe Smart Display Industry Revenue Share (%), by Application 2024 & 2032
- Figure 42: Europe Smart Display Industry Volume Share (%), by Application 2024 & 2032
- Figure 43: Europe Smart Display Industry Revenue (Million), by Country 2024 & 2032
- Figure 44: Europe Smart Display Industry Volume (K Unit), by Country 2024 & 2032
- Figure 45: Europe Smart Display Industry Revenue Share (%), by Country 2024 & 2032
- Figure 46: Europe Smart Display Industry Volume Share (%), by Country 2024 & 2032
- Figure 47: Asia Pacific Smart Display Industry Revenue (Million), by Product Type 2024 & 2032
- Figure 48: Asia Pacific Smart Display Industry Volume (K Unit), by Product Type 2024 & 2032
- Figure 49: Asia Pacific Smart Display Industry Revenue Share (%), by Product Type 2024 & 2032
- Figure 50: Asia Pacific Smart Display Industry Volume Share (%), by Product Type 2024 & 2032
- Figure 51: Asia Pacific Smart Display Industry Revenue (Million), by Application 2024 & 2032
- Figure 52: Asia Pacific Smart Display Industry Volume (K Unit), by Application 2024 & 2032
- Figure 53: Asia Pacific Smart Display Industry Revenue Share (%), by Application 2024 & 2032
- Figure 54: Asia Pacific Smart Display Industry Volume Share (%), by Application 2024 & 2032
- Figure 55: Asia Pacific Smart Display Industry Revenue (Million), by Country 2024 & 2032
- Figure 56: Asia Pacific Smart Display Industry Volume (K Unit), by Country 2024 & 2032
- Figure 57: Asia Pacific Smart Display Industry Revenue Share (%), by Country 2024 & 2032
- Figure 58: Asia Pacific Smart Display Industry Volume Share (%), by Country 2024 & 2032
- Figure 59: Rest of the World Smart Display Industry Revenue (Million), by Product Type 2024 & 2032
- Figure 60: Rest of the World Smart Display Industry Volume (K Unit), by Product Type 2024 & 2032
- Figure 61: Rest of the World Smart Display Industry Revenue Share (%), by Product Type 2024 & 2032
- Figure 62: Rest of the World Smart Display Industry Volume Share (%), by Product Type 2024 & 2032
- Figure 63: Rest of the World Smart Display Industry Revenue (Million), by Application 2024 & 2032
- Figure 64: Rest of the World Smart Display Industry Volume (K Unit), by Application 2024 & 2032
- Figure 65: Rest of the World Smart Display Industry Revenue Share (%), by Application 2024 & 2032
- Figure 66: Rest of the World Smart Display Industry Volume Share (%), by Application 2024 & 2032
- Figure 67: Rest of the World Smart Display Industry Revenue (Million), by Country 2024 & 2032
- Figure 68: Rest of the World Smart Display Industry Volume (K Unit), by Country 2024 & 2032
- Figure 69: Rest of the World Smart Display Industry Revenue Share (%), by Country 2024 & 2032
- Figure 70: Rest of the World Smart Display Industry Volume Share (%), by Country 2024 & 2032
List of Tables
- Table 1: Global Smart Display Industry Revenue Million Forecast, by Region 2019 & 2032
- Table 2: Global Smart Display Industry Volume K Unit Forecast, by Region 2019 & 2032
- Table 3: Global Smart Display Industry Revenue Million Forecast, by Product Type 2019 & 2032
- Table 4: Global Smart Display Industry Volume K Unit Forecast, by Product Type 2019 & 2032
- Table 5: Global Smart Display Industry Revenue Million Forecast, by Application 2019 & 2032
- Table 6: Global Smart Display Industry Volume K Unit Forecast, by Application 2019 & 2032
- Table 7: Global Smart Display Industry Revenue Million Forecast, by Region 2019 & 2032
- Table 8: Global Smart Display Industry Volume K Unit Forecast, by Region 2019 & 2032
- Table 9: Global Smart Display Industry Revenue Million Forecast, by Country 2019 & 2032
- Table 10: Global Smart Display Industry Volume K Unit Forecast, by Country 2019 & 2032
- Table 11: United States Smart Display Industry Revenue (Million) Forecast, by Application 2019 & 2032
- Table 12: United States Smart Display Industry Volume (K Unit) Forecast, by Application 2019 & 2032
- Table 13: Canada Smart Display Industry Revenue (Million) Forecast, by Application 2019 & 2032
- Table 14: Canada Smart Display Industry Volume (K Unit) Forecast, by Application 2019 & 2032
- Table 15: Mexico Smart Display Industry Revenue (Million) Forecast, by Application 2019 & 2032
- Table 16: Mexico Smart Display Industry Volume (K Unit) Forecast, by Application 2019 & 2032
- Table 17: Global Smart Display Industry Revenue Million Forecast, by Country 2019 & 2032
- Table 18: Global Smart Display Industry Volume K Unit Forecast, by Country 2019 & 2032
- Table 19: Germany Smart Display Industry Revenue (Million) Forecast, by Application 2019 & 2032
- Table 20: Germany Smart Display Industry Volume (K Unit) Forecast, by Application 2019 & 2032
- Table 21: United Kingdom Smart Display Industry Revenue (Million) Forecast, by Application 2019 & 2032
- Table 22: United Kingdom Smart Display Industry Volume (K Unit) Forecast, by Application 2019 & 2032
- Table 23: France Smart Display Industry Revenue (Million) Forecast, by Application 2019 & 2032
- Table 24: France Smart Display Industry Volume (K Unit) Forecast, by Application 2019 & 2032
- Table 25: Spain Smart Display Industry Revenue (Million) Forecast, by Application 2019 & 2032
- Table 26: Spain Smart Display Industry Volume (K Unit) Forecast, by Application 2019 & 2032
- Table 27: Italy Smart Display Industry Revenue (Million) Forecast, by Application 2019 & 2032
- Table 28: Italy Smart Display Industry Volume (K Unit) Forecast, by Application 2019 & 2032
- Table 29: Spain Smart Display Industry Revenue (Million) Forecast, by Application 2019 & 2032
- Table 30: Spain Smart Display Industry Volume (K Unit) Forecast, by Application 2019 & 2032
- Table 31: Belgium Smart Display Industry Revenue (Million) Forecast, by Application 2019 & 2032
- Table 32: Belgium Smart Display Industry Volume (K Unit) Forecast, by Application 2019 & 2032
- Table 33: Netherland Smart Display Industry Revenue (Million) Forecast, by Application 2019 & 2032
- Table 34: Netherland Smart Display Industry Volume (K Unit) Forecast, by Application 2019 & 2032
- Table 35: Nordics Smart Display Industry Revenue (Million) Forecast, by Application 2019 & 2032
- Table 36: Nordics Smart Display Industry Volume (K Unit) Forecast, by Application 2019 & 2032
- Table 37: Rest of Europe Smart Display Industry Revenue (Million) Forecast, by Application 2019 & 2032
- Table 38: Rest of Europe Smart Display Industry Volume (K Unit) Forecast, by Application 2019 & 2032
- Table 39: Global Smart Display Industry Revenue Million Forecast, by Country 2019 & 2032
- Table 40: Global Smart Display Industry Volume K Unit Forecast, by Country 2019 & 2032
- Table 41: China Smart Display Industry Revenue (Million) Forecast, by Application 2019 & 2032
- Table 42: China Smart Display Industry Volume (K Unit) Forecast, by Application 2019 & 2032
- Table 43: Japan Smart Display Industry Revenue (Million) Forecast, by Application 2019 & 2032
- Table 44: Japan Smart Display Industry Volume (K Unit) Forecast, by Application 2019 & 2032
- Table 45: India Smart Display Industry Revenue (Million) Forecast, by Application 2019 & 2032
- Table 46: India Smart Display Industry Volume (K Unit) Forecast, by Application 2019 & 2032
- Table 47: South Korea Smart Display Industry Revenue (Million) Forecast, by Application 2019 & 2032
- Table 48: South Korea Smart Display Industry Volume (K Unit) Forecast, by Application 2019 & 2032
- Table 49: Southeast Asia Smart Display Industry Revenue (Million) Forecast, by Application 2019 & 2032
- Table 50: Southeast Asia Smart Display Industry Volume (K Unit) Forecast, by Application 2019 & 2032
- Table 51: Australia Smart Display Industry Revenue (Million) Forecast, by Application 2019 & 2032
- Table 52: Australia Smart Display Industry Volume (K Unit) Forecast, by Application 2019 & 2032
- Table 53: Indonesia Smart Display Industry Revenue (Million) Forecast, by Application 2019 & 2032
- Table 54: Indonesia Smart Display Industry Volume (K Unit) Forecast, by Application 2019 & 2032
- Table 55: Phillipes Smart Display Industry Revenue (Million) Forecast, by Application 2019 & 2032
- Table 56: Phillipes Smart Display Industry Volume (K Unit) Forecast, by Application 2019 & 2032
- Table 57: Singapore Smart Display Industry Revenue (Million) Forecast, by Application 2019 & 2032
- Table 58: Singapore Smart Display Industry Volume (K Unit) Forecast, by Application 2019 & 2032
- Table 59: Thailandc Smart Display Industry Revenue (Million) Forecast, by Application 2019 & 2032
- Table 60: Thailandc Smart Display Industry Volume (K Unit) Forecast, by Application 2019 & 2032
- Table 61: Rest of Asia Pacific Smart Display Industry Revenue (Million) Forecast, by Application 2019 & 2032
- Table 62: Rest of Asia Pacific Smart Display Industry Volume (K Unit) Forecast, by Application 2019 & 2032
- Table 63: Global Smart Display Industry Revenue Million Forecast, by Country 2019 & 2032
- Table 64: Global Smart Display Industry Volume K Unit Forecast, by Country 2019 & 2032
- Table 65: Brazil Smart Display Industry Revenue (Million) Forecast, by Application 2019 & 2032
- Table 66: Brazil Smart Display Industry Volume (K Unit) Forecast, by Application 2019 & 2032
- Table 67: Argentina Smart Display Industry Revenue (Million) Forecast, by Application 2019 & 2032
- Table 68: Argentina Smart Display Industry Volume (K Unit) Forecast, by Application 2019 & 2032
- Table 69: Peru Smart Display Industry Revenue (Million) Forecast, by Application 2019 & 2032
- Table 70: Peru Smart Display Industry Volume (K Unit) Forecast, by Application 2019 & 2032
- Table 71: Chile Smart Display Industry Revenue (Million) Forecast, by Application 2019 & 2032
- Table 72: Chile Smart Display Industry Volume (K Unit) Forecast, by Application 2019 & 2032
- Table 73: Colombia Smart Display Industry Revenue (Million) Forecast, by Application 2019 & 2032
- Table 74: Colombia Smart Display Industry Volume (K Unit) Forecast, by Application 2019 & 2032
- Table 75: Ecuador Smart Display Industry Revenue (Million) Forecast, by Application 2019 & 2032
- Table 76: Ecuador Smart Display Industry Volume (K Unit) Forecast, by Application 2019 & 2032
- Table 77: Venezuela Smart Display Industry Revenue (Million) Forecast, by Application 2019 & 2032
- Table 78: Venezuela Smart Display Industry Volume (K Unit) Forecast, by Application 2019 & 2032
- Table 79: Rest of South America Smart Display Industry Revenue (Million) Forecast, by Application 2019 & 2032
- Table 80: Rest of South America Smart Display Industry Volume (K Unit) Forecast, by Application 2019 & 2032
- Table 81: Global Smart Display Industry Revenue Million Forecast, by Country 2019 & 2032
- Table 82: Global Smart Display Industry Volume K Unit Forecast, by Country 2019 & 2032
- Table 83: United Arab Emirates Smart Display Industry Revenue (Million) Forecast, by Application 2019 & 2032
- Table 84: United Arab Emirates Smart Display Industry Volume (K Unit) Forecast, by Application 2019 & 2032
- Table 85: Saudi Arabia Smart Display Industry Revenue (Million) Forecast, by Application 2019 & 2032
- Table 86: Saudi Arabia Smart Display Industry Volume (K Unit) Forecast, by Application 2019 & 2032
- Table 87: South Africa Smart Display Industry Revenue (Million) Forecast, by Application 2019 & 2032
- Table 88: South Africa Smart Display Industry Volume (K Unit) Forecast, by Application 2019 & 2032
- Table 89: Rest of Middle East and Africa Smart Display Industry Revenue (Million) Forecast, by Application 2019 & 2032
- Table 90: Rest of Middle East and Africa Smart Display Industry Volume (K Unit) Forecast, by Application 2019 & 2032
- Table 91: Global Smart Display Industry Revenue Million Forecast, by Product Type 2019 & 2032
- Table 92: Global Smart Display Industry Volume K Unit Forecast, by Product Type 2019 & 2032
- Table 93: Global Smart Display Industry Revenue Million Forecast, by Application 2019 & 2032
- Table 94: Global Smart Display Industry Volume K Unit Forecast, by Application 2019 & 2032
- Table 95: Global Smart Display Industry Revenue Million Forecast, by Country 2019 & 2032
- Table 96: Global Smart Display Industry Volume K Unit Forecast, by Country 2019 & 2032
- Table 97: Global Smart Display Industry Revenue Million Forecast, by Product Type 2019 & 2032
- Table 98: Global Smart Display Industry Volume K Unit Forecast, by Product Type 2019 & 2032
- Table 99: Global Smart Display Industry Revenue Million Forecast, by Application 2019 & 2032
- Table 100: Global Smart Display Industry Volume K Unit Forecast, by Application 2019 & 2032
- Table 101: Global Smart Display Industry Revenue Million Forecast, by Country 2019 & 2032
- Table 102: Global Smart Display Industry Volume K Unit Forecast, by Country 2019 & 2032
- Table 103: Global Smart Display Industry Revenue Million Forecast, by Product Type 2019 & 2032
- Table 104: Global Smart Display Industry Volume K Unit Forecast, by Product Type 2019 & 2032
- Table 105: Global Smart Display Industry Revenue Million Forecast, by Application 2019 & 2032
- Table 106: Global Smart Display Industry Volume K Unit Forecast, by Application 2019 & 2032
- Table 107: Global Smart Display Industry Revenue Million Forecast, by Country 2019 & 2032
- Table 108: Global Smart Display Industry Volume K Unit Forecast, by Country 2019 & 2032
- Table 109: Global Smart Display Industry Revenue Million Forecast, by Product Type 2019 & 2032
- Table 110: Global Smart Display Industry Volume K Unit Forecast, by Product Type 2019 & 2032
- Table 111: Global Smart Display Industry Revenue Million Forecast, by Application 2019 & 2032
- Table 112: Global Smart Display Industry Volume K Unit Forecast, by Application 2019 & 2032
- Table 113: Global Smart Display Industry Revenue Million Forecast, by Country 2019 & 2032
- Table 114: Global Smart Display Industry Volume K Unit Forecast, by Country 2019 & 2032
Frequently Asked Questions
1. What is the projected Compound Annual Growth Rate (CAGR) of the Smart Display Industry?
The projected CAGR is approximately 28.40%.
2. Which companies are prominent players in the Smart Display Industry?
Key companies in the market include Baidu Inc, Lenovo Group Limited, Google LLC, Amazon com Inc, Facebook Inc, JBL ( Harman International), LG Electronics Inc .
3. What are the main segments of the Smart Display Industry?
The market segments include Product Type, Application.
4. Can you provide details about the market size?
The market size is estimated to be USD 3.74 Million as of 2022.
5. What are some drivers contributing to market growth?
Increasing Demand of Smart Home Devices.
6. What are the notable trends driving market growth?
Connected Device to Drive the Market Growth.
7. Are there any restraints impacting market growth?
High Cost and Limited Set of Vocabulary.
8. Can you provide examples of recent developments in the market?
September 2022: Lenovo launched its first smart glasses called Lenovo Glasses T1. The highlights of the smart glasses include two micro OLED displays, a USB-C port for connectivity, and built-in speakers. The Lenovo smart glasses are also called Lenovo Yoga Glasses in China.
9. What pricing options are available for accessing the report?
Pricing options include single-user, multi-user, and enterprise licenses priced at USD 4750, USD 5250, and USD 8750 respectively.
10. Is the market size provided in terms of value or volume?
The market size is provided in terms of value, measured in Million and volume, measured in K Unit.
11. Are there any specific market keywords associated with the report?
Yes, the market keyword associated with the report is "Smart Display Industry," which aids in identifying and referencing the specific market segment covered.
12. How do I determine which pricing option suits my needs best?
The pricing options vary based on user requirements and access needs. Individual users may opt for single-user licenses, while businesses requiring broader access may choose multi-user or enterprise licenses for cost-effective access to the report.
13. Are there any additional resources or data provided in the Smart Display Industry report?
While the report offers comprehensive insights, it's advisable to review the specific contents or supplementary materials provided to ascertain if additional resources or data are available.
14. How can I stay updated on further developments or reports in the Smart Display Industry?
To stay informed about further developments, trends, and reports in the Smart Display Industry, consider subscribing to industry newsletters, following relevant companies and organizations, or regularly checking reputable industry news sources and publications.
Methodology
Step 1 - Identification of Relevant Samples Size from Population Database


Step 2 - Approaches for Defining Global Market Size (Value, Volume* & Price*)

Note*: In applicable scenarios
Step 3 - Data Sources
Primary Research
- Web Analytics
- Survey Reports
- Research Institute
- Latest Research Reports
- Opinion Leaders
Secondary Research
- Annual Reports
- White Paper
- Latest Press Release
- Industry Association
- Paid Database
- Investor Presentations

Step 4 - Data Triangulation
Involves using different sources of information in order to increase the validity of a study
These sources are likely to be stakeholders in a program - participants, other researchers, program staff, other community members, and so on.
Then we put all data in single framework & apply various statistical tools to find out the dynamic on the market.
During the analysis stage, feedback from the stakeholder groups would be compared to determine areas of agreement as well as areas of divergence


