
Key Insights
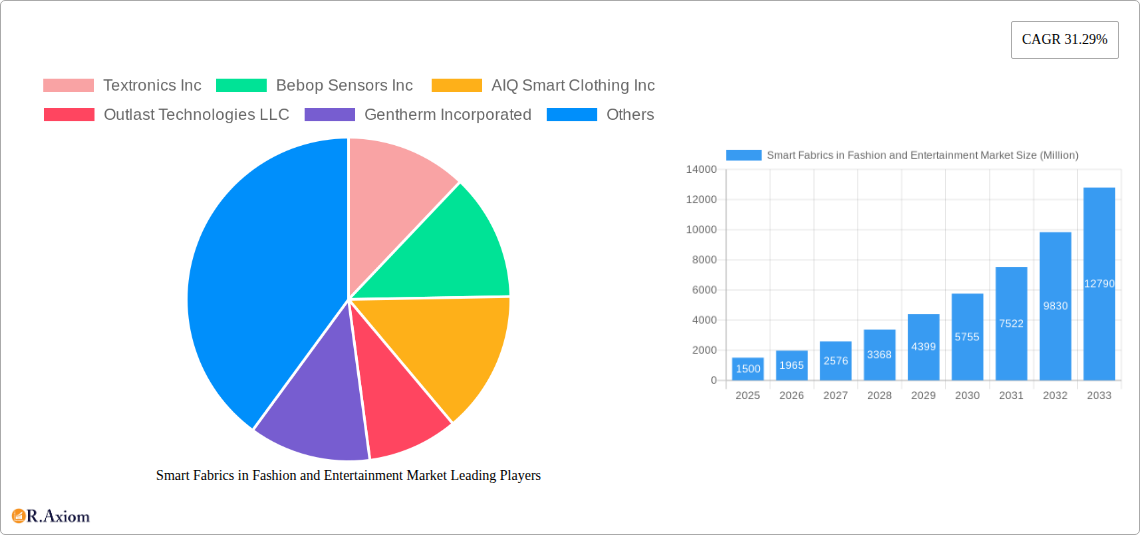
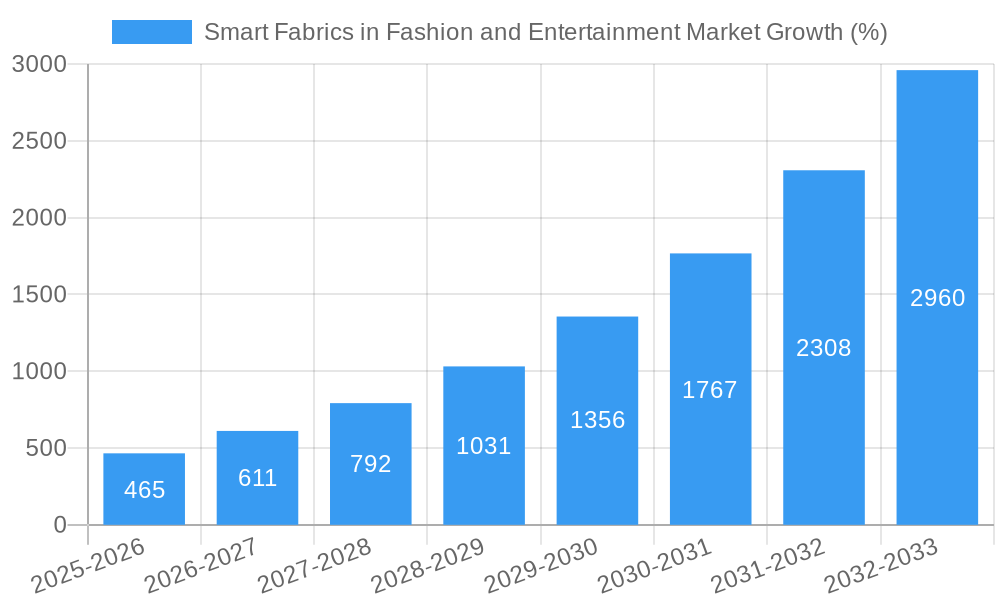
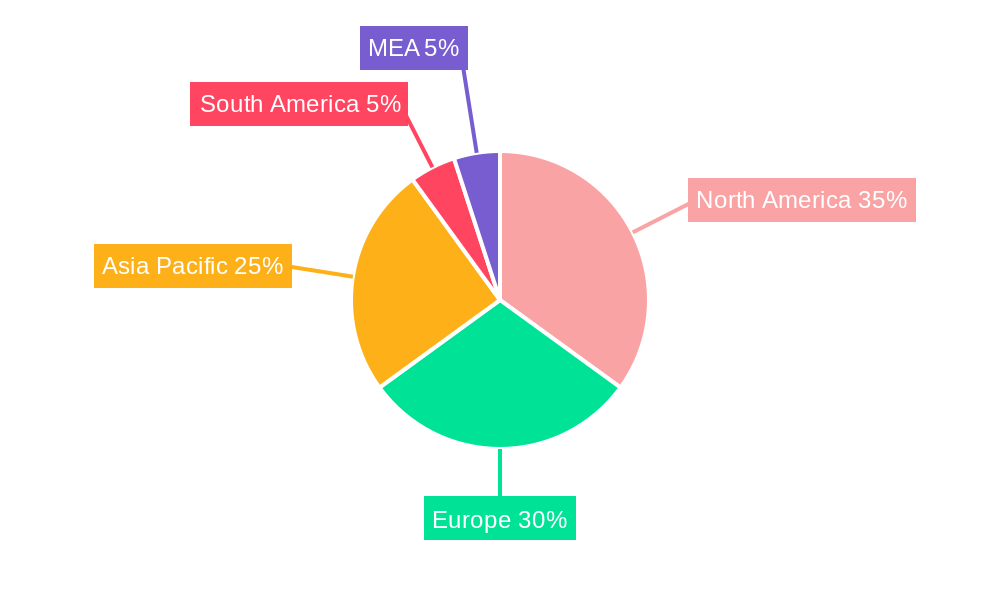
The Smart Fabrics in Fashion and Entertainment Market is experiencing robust growth, projected to reach a significant market size by 2033. Driven by increasing consumer demand for technologically advanced and personalized apparel, coupled with the burgeoning fashion and entertainment industries' adoption of innovative materials, the market exhibits a Compound Annual Growth Rate (CAGR) of 31.29%. Key growth drivers include the integration of functionalities like health monitoring, enhanced comfort, and interactive experiences within garments. The segmentation reveals a diverse landscape, with passive smart textiles holding a substantial share, followed by active and ultra-smart textiles. Material-wise, color-changing and light-emitting fabrics lead the market, owing to their aesthetic appeal and practical applications in diverse fashion and entertainment scenarios. Leading players such as Textronics Inc, Bebop Sensors Inc, and AIQ Smart Clothing Inc are actively contributing to market expansion through innovation and product diversification. Geographical analysis indicates a strong market presence across North America, Europe, and the Asia-Pacific region, with North America currently holding a dominant position due to early adoption and technological advancements. However, the Asia-Pacific region is anticipated to demonstrate significant growth potential in the coming years, driven by rising disposable incomes and increasing consumer awareness of smart textile applications.
The market's growth trajectory is influenced by several factors. Technological advancements continuously improve the functionality and affordability of smart fabrics, expanding their potential applications. However, challenges remain, including concerns regarding the durability, washability, and cost-effectiveness of some smart textiles. Addressing these concerns through further research and development will be crucial for sustained market expansion. The increasing integration of smart fabrics in wearable technology, interactive performance costumes, and personalized fashion experiences will further propel market growth. The competitive landscape is dynamic, with both established players and emerging companies striving to innovate and cater to evolving consumer preferences. Successful market players will need to focus on developing sustainable and ethically sourced materials, while ensuring product safety and regulatory compliance, to maintain long-term market competitiveness.
Smart Fabrics in Fashion and Entertainment Market: A Comprehensive Report (2019-2033)
This comprehensive report provides a detailed analysis of the Smart Fabrics in Fashion and Entertainment Market, covering the period from 2019 to 2033. It offers actionable insights for industry stakeholders, including manufacturers, investors, and researchers, by examining market trends, competitive dynamics, technological advancements, and future growth opportunities. The report utilizes a robust methodology, incorporating historical data (2019-2024), a base year of 2025, and forecasts extending to 2033. The market size is projected in Millions across all relevant segments.
Smart Fabrics in Fashion and Entertainment Market Market Concentration & Innovation
The Smart Fabrics market exhibits a moderately concentrated landscape with several key players vying for market share. Market concentration is influenced by factors like technological advancements, intellectual property rights, and economies of scale. While precise market share figures for individual companies are proprietary and require detailed market research, a competitive landscape exists, with companies such as Textronics Inc., Bebop Sensors Inc., and Outlast Technologies LLC holding notable positions.
Innovation is a critical driver, with significant investment in R&D focused on enhancing fabric functionality, durability, and integration with wearable technology. Regulatory frameworks concerning safety and data privacy are increasingly important, shaping product development and market access. Substitutes for smart fabrics include traditional textiles, though smart fabrics offer unique functionalities like bio-monitoring and interactive capabilities. End-user trends emphasize comfort, sustainability, and personalization, fueling demand for innovative smart fabric solutions. M&A activity, while not exceptionally high in recent years, is predicted to increase due to the consolidation of market players. Observed deals have generally involved smaller companies aiming to leverage partnerships with larger players. Total M&A deal value in the period 2019-2024 is estimated to be xx Million.
- Key Metrics: Market concentration (HHI: xx), Average M&A deal value: xx Million.
- Innovation Drivers: Advancements in sensor technology, miniaturization, and data processing.
- Regulatory Frameworks: Focus on data security, material safety, and environmental impact.
- M&A Activity: Strategic acquisitions aimed at expanding product portfolios and market reach.
Smart Fabrics in Fashion and Entertainment Market Industry Trends & Insights
The Smart Fabrics market is experiencing robust growth, driven by several key factors. The rising adoption of wearable technology, coupled with the increasing demand for personalized and functional clothing, is significantly impacting market expansion. The integration of smart fabrics into athletic apparel, medical textiles, and interactive entertainment is accelerating market penetration. Technological advancements, such as the development of more energy-efficient and comfortable sensors, are enhancing the appeal of smart fabrics. A notable trend is the shift toward sustainable and eco-friendly smart fabric production. Consumer preferences are leaning towards products with improved durability, wash-ability, and seamless integration with existing devices.
The market is anticipated to witness substantial growth, with a Compound Annual Growth Rate (CAGR) projected to be xx% during the forecast period (2025-2033). Market penetration is expected to rise from xx% in 2025 to xx% by 2033. Competitive dynamics are characterized by both established players and emerging start-ups, creating a vibrant and innovative landscape. The industry is subject to rapid technological advancements, necessitating continuous adaptation. Market size is estimated at xx Million in 2025 and projected to reach xx Million by 2033.
Dominant Markets & Segments in Smart Fabrics in Fashion and Entertainment Market
The North American market currently holds a leading position in the Smart Fabrics industry, driven by significant technological advancements, high consumer spending, and a thriving fashion and entertainment sector. Key drivers include strong R&D infrastructure, supportive government policies, and a high adoption rate of wearable technology.
- Dominant Region: North America
- Key Drivers for North America:
- Advanced technological infrastructure
- High disposable incomes
- Strong demand for innovative products
- Supportive government policies.
Segment Dominance:
- Type of Product: Active Smart Textiles are currently the dominant segment, owing to their increased functionality and applications in diverse industries.
- Material: Color-changing materials hold a significant market share driven by their aesthetic appeal in fashion and entertainment applications.
Detailed analysis of each segment’s growth trajectory and market size projections from 2025-2033 requires detailed market-specific data. The projected values for each segment will be xx Million.
Smart Fabrics in Fashion and Entertainment Market Product Developments
Recent innovations in smart fabrics highlight a shift towards miniaturized, energy-efficient sensors seamlessly integrated into textiles. Applications range from performance apparel monitoring vital signs to interactive garments for entertainment. The competitive advantage lies in creating products that are both functional and aesthetically pleasing, catering to the growing demand for personalized and sustainable fashion and entertainment solutions. Companies are actively developing fabrics with improved durability, wash-ability, and reduced environmental impact.
Report Scope & Segmentation Analysis
This report segments the Smart Fabrics market based on:
Type of Product:
- Passive Smart Textiles: This segment encompasses fabrics with inherent properties, such as moisture-wicking or UV protection, without requiring external power sources. Growth is driven by increasing demand for functional apparel. Projected market size in 2025: xx Million.
- Active Smart Textiles: This segment includes fabrics embedded with sensors and electronics, enabling data collection and interaction. Growth is fueled by advancements in wearable technology. Projected market size in 2025: xx Million.
- Ultra Smart Textiles: This emerging segment comprises highly sophisticated fabrics with advanced functionalities, such as self-healing or shape-changing capabilities. Projected market size in 2025: xx Million.
Material:
- Color Changing: This segment is driven by increasing demand for expressive and dynamic fashion items. Projected market size in 2025: xx Million.
- Light Emitting: This segment finds applications in interactive clothing and entertainment. Projected market size in 2025: xx Million.
- Temperature Changing: This segment caters to the need for thermal regulation in apparel and other applications. Projected market size in 2025: xx Million.
- Other Materials: This encompasses a variety of materials with unique properties. Projected market size in 2025: xx Million.
Key Drivers of Smart Fabrics in Fashion and Entertainment Market Growth
The Smart Fabrics market is driven by several factors:
- Technological Advancements: Miniaturization of sensors, improved energy efficiency, and advancements in textile processing techniques.
- Rising Demand for Wearable Technology: Growing consumer preference for technology integration in apparel and accessories.
- Government Initiatives and Funding: Support for R&D in sustainable and innovative textile technologies.
Challenges in the Smart Fabrics in Fashion and Entertainment Market Sector
The industry faces challenges such as:
- High Production Costs: The complexity of integrating electronics into fabrics leads to higher manufacturing costs.
- Durability and Wash-ability Concerns: Maintaining the functionality and integrity of smart fabrics after repeated washing poses a significant hurdle.
- Data Privacy and Security: Concerns about the collection and security of personal data collected by smart fabrics.
Emerging Opportunities in Smart Fabrics in Fashion and Entertainment Market
Emerging opportunities include:
- Integration with IoT: Connecting smart fabrics to the Internet of Things for enhanced data collection and analysis.
- Expansion into New Applications: Exploring novel applications in healthcare, automotive, and industrial settings.
- Development of Sustainable and Eco-friendly Fabrics: Meeting growing consumer demand for environmentally responsible products.
Leading Players in the Smart Fabrics in Fashion and Entertainment Market Market
- Textronics Inc
- Bebop Sensors Inc
- AIQ Smart Clothing Inc
- Outlast Technologies LLC
- Gentherm Incorporated
- Intelligent Textiles Limited
- Schoeller Technologies AG
- Sensoria Inc
- Clothing Plus Ltd
- Interactive Wear AG
- E L Du Pont De Nemours and Company
Key Developments in Smart Fabrics in Fashion and Entertainment Market Industry
- July 2022: Microsoft developed a smart fabric that detects objects and gestures, marking a significant advancement in sensor technology integration.
- January 2022: Pyratex, a Spanish startup, secured USD 680,086 in funding, demonstrating investor confidence in the sector's growth potential.
Strategic Outlook for Smart Fabrics in Fashion and Entertainment Market Market
The Smart Fabrics market holds immense potential, driven by ongoing technological innovations and increasing consumer demand for functional and interactive apparel. Future growth will depend on addressing challenges related to cost, durability, and data security. Strategic partnerships and collaborations will play a crucial role in driving innovation and market expansion. The market is poised for substantial growth, presenting significant opportunities for both established and emerging players.
Smart Fabrics in Fashion and Entertainment Market Segmentation
-
1. Type of Product
- 1.1. Passive Smart Textiles
- 1.2. Active Smart Textiles
- 1.3. Ultra Smart Textiles
-
2. Material
- 2.1. Color Changing
- 2.2. Light Emitting
- 2.3. Temperature Changing
- 2.4. Other Materials
-
3. Application
- 3.1. Fashion
- 3.2. Entertainment
- 3.3. Healthcare
- 3.4. Military and Defense
- 3.5. Automotive
Smart Fabrics in Fashion and Entertainment Market Segmentation By Geography
- 1. North America
- 2. Europe
- 3. Asia Pacific
- 4. Latin America
- 5. Middle East and Africa
Smart Fabrics in Fashion and Entertainment Market REPORT HIGHLIGHTS
| Aspects | Details |
|---|---|
| Study Period | 2019-2033 |
| Base Year | 2024 |
| Estimated Year | 2025 |
| Forecast Period | 2025-2033 |
| Historical Period | 2019-2024 |
| Growth Rate | CAGR of 31.29% from 2019-2033 |
| Segmentation |
|
Table of Contents
- 1. Introduction
- 1.1. Research Scope
- 1.2. Market Segmentation
- 1.3. Research Methodology
- 1.4. Definitions and Assumptions
- 2. Executive Summary
- 2.1. Introduction
- 3. Market Dynamics
- 3.1. Introduction
- 3.2. Market Drivers
- 3.2.1. Miniaturization of Electronic Components Influencing the Growth of the Market; Increasing Use of Wearable Electronics; Rapid Growth of Low-cost Smart Wireless Sensor Networks
- 3.3. Market Restrains
- 3.3.1. Very High Implementation Costs
- 3.4. Market Trends
- 3.4.1. Adoption of Wearable Devices to Drive the Market's Growth
- 4. Market Factor Analysis
- 4.1. Porters Five Forces
- 4.2. Supply/Value Chain
- 4.3. PESTEL analysis
- 4.4. Market Entropy
- 4.5. Patent/Trademark Analysis
- 5. Global Smart Fabrics in Fashion and Entertainment Market Analysis, Insights and Forecast, 2019-2031
- 5.1. Market Analysis, Insights and Forecast - by Type of Product
- 5.1.1. Passive Smart Textiles
- 5.1.2. Active Smart Textiles
- 5.1.3. Ultra Smart Textiles
- 5.2. Market Analysis, Insights and Forecast - by Material
- 5.2.1. Color Changing
- 5.2.2. Light Emitting
- 5.2.3. Temperature Changing
- 5.2.4. Other Materials
- 5.3. Market Analysis, Insights and Forecast - by Application
- 5.3.1. Fashion
- 5.3.2. Entertainment
- 5.3.3. Healthcare
- 5.3.4. Military and Defense
- 5.3.5. Automotive
- 5.4. Market Analysis, Insights and Forecast - by Region
- 5.4.1. North America
- 5.4.2. Europe
- 5.4.3. Asia Pacific
- 5.4.4. Latin America
- 5.4.5. Middle East and Africa
- 5.1. Market Analysis, Insights and Forecast - by Type of Product
- 6. North America Smart Fabrics in Fashion and Entertainment Market Analysis, Insights and Forecast, 2019-2031
- 6.1. Market Analysis, Insights and Forecast - by Type of Product
- 6.1.1. Passive Smart Textiles
- 6.1.2. Active Smart Textiles
- 6.1.3. Ultra Smart Textiles
- 6.2. Market Analysis, Insights and Forecast - by Material
- 6.2.1. Color Changing
- 6.2.2. Light Emitting
- 6.2.3. Temperature Changing
- 6.2.4. Other Materials
- 6.3. Market Analysis, Insights and Forecast - by Application
- 6.3.1. Fashion
- 6.3.2. Entertainment
- 6.3.3. Healthcare
- 6.3.4. Military and Defense
- 6.3.5. Automotive
- 6.1. Market Analysis, Insights and Forecast - by Type of Product
- 7. Europe Smart Fabrics in Fashion and Entertainment Market Analysis, Insights and Forecast, 2019-2031
- 7.1. Market Analysis, Insights and Forecast - by Type of Product
- 7.1.1. Passive Smart Textiles
- 7.1.2. Active Smart Textiles
- 7.1.3. Ultra Smart Textiles
- 7.2. Market Analysis, Insights and Forecast - by Material
- 7.2.1. Color Changing
- 7.2.2. Light Emitting
- 7.2.3. Temperature Changing
- 7.2.4. Other Materials
- 7.3. Market Analysis, Insights and Forecast - by Application
- 7.3.1. Fashion
- 7.3.2. Entertainment
- 7.3.3. Healthcare
- 7.3.4. Military and Defense
- 7.3.5. Automotive
- 7.1. Market Analysis, Insights and Forecast - by Type of Product
- 8. Asia Pacific Smart Fabrics in Fashion and Entertainment Market Analysis, Insights and Forecast, 2019-2031
- 8.1. Market Analysis, Insights and Forecast - by Type of Product
- 8.1.1. Passive Smart Textiles
- 8.1.2. Active Smart Textiles
- 8.1.3. Ultra Smart Textiles
- 8.2. Market Analysis, Insights and Forecast - by Material
- 8.2.1. Color Changing
- 8.2.2. Light Emitting
- 8.2.3. Temperature Changing
- 8.2.4. Other Materials
- 8.3. Market Analysis, Insights and Forecast - by Application
- 8.3.1. Fashion
- 8.3.2. Entertainment
- 8.3.3. Healthcare
- 8.3.4. Military and Defense
- 8.3.5. Automotive
- 8.1. Market Analysis, Insights and Forecast - by Type of Product
- 9. Latin America Smart Fabrics in Fashion and Entertainment Market Analysis, Insights and Forecast, 2019-2031
- 9.1. Market Analysis, Insights and Forecast - by Type of Product
- 9.1.1. Passive Smart Textiles
- 9.1.2. Active Smart Textiles
- 9.1.3. Ultra Smart Textiles
- 9.2. Market Analysis, Insights and Forecast - by Material
- 9.2.1. Color Changing
- 9.2.2. Light Emitting
- 9.2.3. Temperature Changing
- 9.2.4. Other Materials
- 9.3. Market Analysis, Insights and Forecast - by Application
- 9.3.1. Fashion
- 9.3.2. Entertainment
- 9.3.3. Healthcare
- 9.3.4. Military and Defense
- 9.3.5. Automotive
- 9.1. Market Analysis, Insights and Forecast - by Type of Product
- 10. Middle East and Africa Smart Fabrics in Fashion and Entertainment Market Analysis, Insights and Forecast, 2019-2031
- 10.1. Market Analysis, Insights and Forecast - by Type of Product
- 10.1.1. Passive Smart Textiles
- 10.1.2. Active Smart Textiles
- 10.1.3. Ultra Smart Textiles
- 10.2. Market Analysis, Insights and Forecast - by Material
- 10.2.1. Color Changing
- 10.2.2. Light Emitting
- 10.2.3. Temperature Changing
- 10.2.4. Other Materials
- 10.3. Market Analysis, Insights and Forecast - by Application
- 10.3.1. Fashion
- 10.3.2. Entertainment
- 10.3.3. Healthcare
- 10.3.4. Military and Defense
- 10.3.5. Automotive
- 10.1. Market Analysis, Insights and Forecast - by Type of Product
- 11. North America Smart Fabrics in Fashion and Entertainment Market Analysis, Insights and Forecast, 2019-2031
- 11.1. Market Analysis, Insights and Forecast - By Country/Sub-region
- 11.1.1 United States
- 11.1.2 Canada
- 11.1.3 Mexico
- 12. Europe Smart Fabrics in Fashion and Entertainment Market Analysis, Insights and Forecast, 2019-2031
- 12.1. Market Analysis, Insights and Forecast - By Country/Sub-region
- 12.1.1 Germany
- 12.1.2 United Kingdom
- 12.1.3 France
- 12.1.4 Spain
- 12.1.5 Italy
- 12.1.6 Spain
- 12.1.7 Belgium
- 12.1.8 Netherland
- 12.1.9 Nordics
- 12.1.10 Rest of Europe
- 13. Asia Pacific Smart Fabrics in Fashion and Entertainment Market Analysis, Insights and Forecast, 2019-2031
- 13.1. Market Analysis, Insights and Forecast - By Country/Sub-region
- 13.1.1 China
- 13.1.2 Japan
- 13.1.3 India
- 13.1.4 South Korea
- 13.1.5 Southeast Asia
- 13.1.6 Australia
- 13.1.7 Indonesia
- 13.1.8 Phillipes
- 13.1.9 Singapore
- 13.1.10 Thailandc
- 13.1.11 Rest of Asia Pacific
- 14. South America Smart Fabrics in Fashion and Entertainment Market Analysis, Insights and Forecast, 2019-2031
- 14.1. Market Analysis, Insights and Forecast - By Country/Sub-region
- 14.1.1 Brazil
- 14.1.2 Argentina
- 14.1.3 Peru
- 14.1.4 Chile
- 14.1.5 Colombia
- 14.1.6 Ecuador
- 14.1.7 Venezuela
- 14.1.8 Rest of South America
- 15. North America Smart Fabrics in Fashion and Entertainment Market Analysis, Insights and Forecast, 2019-2031
- 15.1. Market Analysis, Insights and Forecast - By Country/Sub-region
- 15.1.1 United States
- 15.1.2 Canada
- 15.1.3 Mexico
- 16. MEA Smart Fabrics in Fashion and Entertainment Market Analysis, Insights and Forecast, 2019-2031
- 16.1. Market Analysis, Insights and Forecast - By Country/Sub-region
- 16.1.1 United Arab Emirates
- 16.1.2 Saudi Arabia
- 16.1.3 South Africa
- 16.1.4 Rest of Middle East and Africa
- 17. Competitive Analysis
- 17.1. Global Market Share Analysis 2024
- 17.2. Company Profiles
- 17.2.1 Textronics Inc
- 17.2.1.1. Overview
- 17.2.1.2. Products
- 17.2.1.3. SWOT Analysis
- 17.2.1.4. Recent Developments
- 17.2.1.5. Financials (Based on Availability)
- 17.2.2 Bebop Sensors Inc
- 17.2.2.1. Overview
- 17.2.2.2. Products
- 17.2.2.3. SWOT Analysis
- 17.2.2.4. Recent Developments
- 17.2.2.5. Financials (Based on Availability)
- 17.2.3 AIQ Smart Clothing Inc
- 17.2.3.1. Overview
- 17.2.3.2. Products
- 17.2.3.3. SWOT Analysis
- 17.2.3.4. Recent Developments
- 17.2.3.5. Financials (Based on Availability)
- 17.2.4 Outlast Technologies LLC
- 17.2.4.1. Overview
- 17.2.4.2. Products
- 17.2.4.3. SWOT Analysis
- 17.2.4.4. Recent Developments
- 17.2.4.5. Financials (Based on Availability)
- 17.2.5 Gentherm Incorporated
- 17.2.5.1. Overview
- 17.2.5.2. Products
- 17.2.5.3. SWOT Analysis
- 17.2.5.4. Recent Developments
- 17.2.5.5. Financials (Based on Availability)
- 17.2.6 Intelligent Textiles Limited
- 17.2.6.1. Overview
- 17.2.6.2. Products
- 17.2.6.3. SWOT Analysis
- 17.2.6.4. Recent Developments
- 17.2.6.5. Financials (Based on Availability)
- 17.2.7 Schoeller Technologies AG
- 17.2.7.1. Overview
- 17.2.7.2. Products
- 17.2.7.3. SWOT Analysis
- 17.2.7.4. Recent Developments
- 17.2.7.5. Financials (Based on Availability)
- 17.2.8 Sensoria Inc
- 17.2.8.1. Overview
- 17.2.8.2. Products
- 17.2.8.3. SWOT Analysis
- 17.2.8.4. Recent Developments
- 17.2.8.5. Financials (Based on Availability)
- 17.2.9 Clothing Plus Ltd
- 17.2.9.1. Overview
- 17.2.9.2. Products
- 17.2.9.3. SWOT Analysis
- 17.2.9.4. Recent Developments
- 17.2.9.5. Financials (Based on Availability)
- 17.2.10 Interactive Wear AG
- 17.2.10.1. Overview
- 17.2.10.2. Products
- 17.2.10.3. SWOT Analysis
- 17.2.10.4. Recent Developments
- 17.2.10.5. Financials (Based on Availability)
- 17.2.11 E L Du Pont De Nemours and Company
- 17.2.11.1. Overview
- 17.2.11.2. Products
- 17.2.11.3. SWOT Analysis
- 17.2.11.4. Recent Developments
- 17.2.11.5. Financials (Based on Availability)
- 17.2.1 Textronics Inc
List of Figures
- Figure 1: Global Smart Fabrics in Fashion and Entertainment Market Revenue Breakdown (Million, %) by Region 2024 & 2032
- Figure 2: Global Smart Fabrics in Fashion and Entertainment Market Volume Breakdown (K Unit, %) by Region 2024 & 2032
- Figure 3: North America Smart Fabrics in Fashion and Entertainment Market Revenue (Million), by Country 2024 & 2032
- Figure 4: North America Smart Fabrics in Fashion and Entertainment Market Volume (K Unit), by Country 2024 & 2032
- Figure 5: North America Smart Fabrics in Fashion and Entertainment Market Revenue Share (%), by Country 2024 & 2032
- Figure 6: North America Smart Fabrics in Fashion and Entertainment Market Volume Share (%), by Country 2024 & 2032
- Figure 7: Europe Smart Fabrics in Fashion and Entertainment Market Revenue (Million), by Country 2024 & 2032
- Figure 8: Europe Smart Fabrics in Fashion and Entertainment Market Volume (K Unit), by Country 2024 & 2032
- Figure 9: Europe Smart Fabrics in Fashion and Entertainment Market Revenue Share (%), by Country 2024 & 2032
- Figure 10: Europe Smart Fabrics in Fashion and Entertainment Market Volume Share (%), by Country 2024 & 2032
- Figure 11: Asia Pacific Smart Fabrics in Fashion and Entertainment Market Revenue (Million), by Country 2024 & 2032
- Figure 12: Asia Pacific Smart Fabrics in Fashion and Entertainment Market Volume (K Unit), by Country 2024 & 2032
- Figure 13: Asia Pacific Smart Fabrics in Fashion and Entertainment Market Revenue Share (%), by Country 2024 & 2032
- Figure 14: Asia Pacific Smart Fabrics in Fashion and Entertainment Market Volume Share (%), by Country 2024 & 2032
- Figure 15: South America Smart Fabrics in Fashion and Entertainment Market Revenue (Million), by Country 2024 & 2032
- Figure 16: South America Smart Fabrics in Fashion and Entertainment Market Volume (K Unit), by Country 2024 & 2032
- Figure 17: South America Smart Fabrics in Fashion and Entertainment Market Revenue Share (%), by Country 2024 & 2032
- Figure 18: South America Smart Fabrics in Fashion and Entertainment Market Volume Share (%), by Country 2024 & 2032
- Figure 19: North America Smart Fabrics in Fashion and Entertainment Market Revenue (Million), by Country 2024 & 2032
- Figure 20: North America Smart Fabrics in Fashion and Entertainment Market Volume (K Unit), by Country 2024 & 2032
- Figure 21: North America Smart Fabrics in Fashion and Entertainment Market Revenue Share (%), by Country 2024 & 2032
- Figure 22: North America Smart Fabrics in Fashion and Entertainment Market Volume Share (%), by Country 2024 & 2032
- Figure 23: MEA Smart Fabrics in Fashion and Entertainment Market Revenue (Million), by Country 2024 & 2032
- Figure 24: MEA Smart Fabrics in Fashion and Entertainment Market Volume (K Unit), by Country 2024 & 2032
- Figure 25: MEA Smart Fabrics in Fashion and Entertainment Market Revenue Share (%), by Country 2024 & 2032
- Figure 26: MEA Smart Fabrics in Fashion and Entertainment Market Volume Share (%), by Country 2024 & 2032
- Figure 27: North America Smart Fabrics in Fashion and Entertainment Market Revenue (Million), by Type of Product 2024 & 2032
- Figure 28: North America Smart Fabrics in Fashion and Entertainment Market Volume (K Unit), by Type of Product 2024 & 2032
- Figure 29: North America Smart Fabrics in Fashion and Entertainment Market Revenue Share (%), by Type of Product 2024 & 2032
- Figure 30: North America Smart Fabrics in Fashion and Entertainment Market Volume Share (%), by Type of Product 2024 & 2032
- Figure 31: North America Smart Fabrics in Fashion and Entertainment Market Revenue (Million), by Material 2024 & 2032
- Figure 32: North America Smart Fabrics in Fashion and Entertainment Market Volume (K Unit), by Material 2024 & 2032
- Figure 33: North America Smart Fabrics in Fashion and Entertainment Market Revenue Share (%), by Material 2024 & 2032
- Figure 34: North America Smart Fabrics in Fashion and Entertainment Market Volume Share (%), by Material 2024 & 2032
- Figure 35: North America Smart Fabrics in Fashion and Entertainment Market Revenue (Million), by Application 2024 & 2032
- Figure 36: North America Smart Fabrics in Fashion and Entertainment Market Volume (K Unit), by Application 2024 & 2032
- Figure 37: North America Smart Fabrics in Fashion and Entertainment Market Revenue Share (%), by Application 2024 & 2032
- Figure 38: North America Smart Fabrics in Fashion and Entertainment Market Volume Share (%), by Application 2024 & 2032
- Figure 39: North America Smart Fabrics in Fashion and Entertainment Market Revenue (Million), by Country 2024 & 2032
- Figure 40: North America Smart Fabrics in Fashion and Entertainment Market Volume (K Unit), by Country 2024 & 2032
- Figure 41: North America Smart Fabrics in Fashion and Entertainment Market Revenue Share (%), by Country 2024 & 2032
- Figure 42: North America Smart Fabrics in Fashion and Entertainment Market Volume Share (%), by Country 2024 & 2032
- Figure 43: Europe Smart Fabrics in Fashion and Entertainment Market Revenue (Million), by Type of Product 2024 & 2032
- Figure 44: Europe Smart Fabrics in Fashion and Entertainment Market Volume (K Unit), by Type of Product 2024 & 2032
- Figure 45: Europe Smart Fabrics in Fashion and Entertainment Market Revenue Share (%), by Type of Product 2024 & 2032
- Figure 46: Europe Smart Fabrics in Fashion and Entertainment Market Volume Share (%), by Type of Product 2024 & 2032
- Figure 47: Europe Smart Fabrics in Fashion and Entertainment Market Revenue (Million), by Material 2024 & 2032
- Figure 48: Europe Smart Fabrics in Fashion and Entertainment Market Volume (K Unit), by Material 2024 & 2032
- Figure 49: Europe Smart Fabrics in Fashion and Entertainment Market Revenue Share (%), by Material 2024 & 2032
- Figure 50: Europe Smart Fabrics in Fashion and Entertainment Market Volume Share (%), by Material 2024 & 2032
- Figure 51: Europe Smart Fabrics in Fashion and Entertainment Market Revenue (Million), by Application 2024 & 2032
- Figure 52: Europe Smart Fabrics in Fashion and Entertainment Market Volume (K Unit), by Application 2024 & 2032
- Figure 53: Europe Smart Fabrics in Fashion and Entertainment Market Revenue Share (%), by Application 2024 & 2032
- Figure 54: Europe Smart Fabrics in Fashion and Entertainment Market Volume Share (%), by Application 2024 & 2032
- Figure 55: Europe Smart Fabrics in Fashion and Entertainment Market Revenue (Million), by Country 2024 & 2032
- Figure 56: Europe Smart Fabrics in Fashion and Entertainment Market Volume (K Unit), by Country 2024 & 2032
- Figure 57: Europe Smart Fabrics in Fashion and Entertainment Market Revenue Share (%), by Country 2024 & 2032
- Figure 58: Europe Smart Fabrics in Fashion and Entertainment Market Volume Share (%), by Country 2024 & 2032
- Figure 59: Asia Pacific Smart Fabrics in Fashion and Entertainment Market Revenue (Million), by Type of Product 2024 & 2032
- Figure 60: Asia Pacific Smart Fabrics in Fashion and Entertainment Market Volume (K Unit), by Type of Product 2024 & 2032
- Figure 61: Asia Pacific Smart Fabrics in Fashion and Entertainment Market Revenue Share (%), by Type of Product 2024 & 2032
- Figure 62: Asia Pacific Smart Fabrics in Fashion and Entertainment Market Volume Share (%), by Type of Product 2024 & 2032
- Figure 63: Asia Pacific Smart Fabrics in Fashion and Entertainment Market Revenue (Million), by Material 2024 & 2032
- Figure 64: Asia Pacific Smart Fabrics in Fashion and Entertainment Market Volume (K Unit), by Material 2024 & 2032
- Figure 65: Asia Pacific Smart Fabrics in Fashion and Entertainment Market Revenue Share (%), by Material 2024 & 2032
- Figure 66: Asia Pacific Smart Fabrics in Fashion and Entertainment Market Volume Share (%), by Material 2024 & 2032
- Figure 67: Asia Pacific Smart Fabrics in Fashion and Entertainment Market Revenue (Million), by Application 2024 & 2032
- Figure 68: Asia Pacific Smart Fabrics in Fashion and Entertainment Market Volume (K Unit), by Application 2024 & 2032
- Figure 69: Asia Pacific Smart Fabrics in Fashion and Entertainment Market Revenue Share (%), by Application 2024 & 2032
- Figure 70: Asia Pacific Smart Fabrics in Fashion and Entertainment Market Volume Share (%), by Application 2024 & 2032
- Figure 71: Asia Pacific Smart Fabrics in Fashion and Entertainment Market Revenue (Million), by Country 2024 & 2032
- Figure 72: Asia Pacific Smart Fabrics in Fashion and Entertainment Market Volume (K Unit), by Country 2024 & 2032
- Figure 73: Asia Pacific Smart Fabrics in Fashion and Entertainment Market Revenue Share (%), by Country 2024 & 2032
- Figure 74: Asia Pacific Smart Fabrics in Fashion and Entertainment Market Volume Share (%), by Country 2024 & 2032
- Figure 75: Latin America Smart Fabrics in Fashion and Entertainment Market Revenue (Million), by Type of Product 2024 & 2032
- Figure 76: Latin America Smart Fabrics in Fashion and Entertainment Market Volume (K Unit), by Type of Product 2024 & 2032
- Figure 77: Latin America Smart Fabrics in Fashion and Entertainment Market Revenue Share (%), by Type of Product 2024 & 2032
- Figure 78: Latin America Smart Fabrics in Fashion and Entertainment Market Volume Share (%), by Type of Product 2024 & 2032
- Figure 79: Latin America Smart Fabrics in Fashion and Entertainment Market Revenue (Million), by Material 2024 & 2032
- Figure 80: Latin America Smart Fabrics in Fashion and Entertainment Market Volume (K Unit), by Material 2024 & 2032
- Figure 81: Latin America Smart Fabrics in Fashion and Entertainment Market Revenue Share (%), by Material 2024 & 2032
- Figure 82: Latin America Smart Fabrics in Fashion and Entertainment Market Volume Share (%), by Material 2024 & 2032
- Figure 83: Latin America Smart Fabrics in Fashion and Entertainment Market Revenue (Million), by Application 2024 & 2032
- Figure 84: Latin America Smart Fabrics in Fashion and Entertainment Market Volume (K Unit), by Application 2024 & 2032
- Figure 85: Latin America Smart Fabrics in Fashion and Entertainment Market Revenue Share (%), by Application 2024 & 2032
- Figure 86: Latin America Smart Fabrics in Fashion and Entertainment Market Volume Share (%), by Application 2024 & 2032
- Figure 87: Latin America Smart Fabrics in Fashion and Entertainment Market Revenue (Million), by Country 2024 & 2032
- Figure 88: Latin America Smart Fabrics in Fashion and Entertainment Market Volume (K Unit), by Country 2024 & 2032
- Figure 89: Latin America Smart Fabrics in Fashion and Entertainment Market Revenue Share (%), by Country 2024 & 2032
- Figure 90: Latin America Smart Fabrics in Fashion and Entertainment Market Volume Share (%), by Country 2024 & 2032
- Figure 91: Middle East and Africa Smart Fabrics in Fashion and Entertainment Market Revenue (Million), by Type of Product 2024 & 2032
- Figure 92: Middle East and Africa Smart Fabrics in Fashion and Entertainment Market Volume (K Unit), by Type of Product 2024 & 2032
- Figure 93: Middle East and Africa Smart Fabrics in Fashion and Entertainment Market Revenue Share (%), by Type of Product 2024 & 2032
- Figure 94: Middle East and Africa Smart Fabrics in Fashion and Entertainment Market Volume Share (%), by Type of Product 2024 & 2032
- Figure 95: Middle East and Africa Smart Fabrics in Fashion and Entertainment Market Revenue (Million), by Material 2024 & 2032
- Figure 96: Middle East and Africa Smart Fabrics in Fashion and Entertainment Market Volume (K Unit), by Material 2024 & 2032
- Figure 97: Middle East and Africa Smart Fabrics in Fashion and Entertainment Market Revenue Share (%), by Material 2024 & 2032
- Figure 98: Middle East and Africa Smart Fabrics in Fashion and Entertainment Market Volume Share (%), by Material 2024 & 2032
- Figure 99: Middle East and Africa Smart Fabrics in Fashion and Entertainment Market Revenue (Million), by Application 2024 & 2032
- Figure 100: Middle East and Africa Smart Fabrics in Fashion and Entertainment Market Volume (K Unit), by Application 2024 & 2032
- Figure 101: Middle East and Africa Smart Fabrics in Fashion and Entertainment Market Revenue Share (%), by Application 2024 & 2032
- Figure 102: Middle East and Africa Smart Fabrics in Fashion and Entertainment Market Volume Share (%), by Application 2024 & 2032
- Figure 103: Middle East and Africa Smart Fabrics in Fashion and Entertainment Market Revenue (Million), by Country 2024 & 2032
- Figure 104: Middle East and Africa Smart Fabrics in Fashion and Entertainment Market Volume (K Unit), by Country 2024 & 2032
- Figure 105: Middle East and Africa Smart Fabrics in Fashion and Entertainment Market Revenue Share (%), by Country 2024 & 2032
- Figure 106: Middle East and Africa Smart Fabrics in Fashion and Entertainment Market Volume Share (%), by Country 2024 & 2032
List of Tables
- Table 1: Global Smart Fabrics in Fashion and Entertainment Market Revenue Million Forecast, by Region 2019 & 2032
- Table 2: Global Smart Fabrics in Fashion and Entertainment Market Volume K Unit Forecast, by Region 2019 & 2032
- Table 3: Global Smart Fabrics in Fashion and Entertainment Market Revenue Million Forecast, by Type of Product 2019 & 2032
- Table 4: Global Smart Fabrics in Fashion and Entertainment Market Volume K Unit Forecast, by Type of Product 2019 & 2032
- Table 5: Global Smart Fabrics in Fashion and Entertainment Market Revenue Million Forecast, by Material 2019 & 2032
- Table 6: Global Smart Fabrics in Fashion and Entertainment Market Volume K Unit Forecast, by Material 2019 & 2032
- Table 7: Global Smart Fabrics in Fashion and Entertainment Market Revenue Million Forecast, by Application 2019 & 2032
- Table 8: Global Smart Fabrics in Fashion and Entertainment Market Volume K Unit Forecast, by Application 2019 & 2032
- Table 9: Global Smart Fabrics in Fashion and Entertainment Market Revenue Million Forecast, by Region 2019 & 2032
- Table 10: Global Smart Fabrics in Fashion and Entertainment Market Volume K Unit Forecast, by Region 2019 & 2032
- Table 11: Global Smart Fabrics in Fashion and Entertainment Market Revenue Million Forecast, by Country 2019 & 2032
- Table 12: Global Smart Fabrics in Fashion and Entertainment Market Volume K Unit Forecast, by Country 2019 & 2032
- Table 13: United States Smart Fabrics in Fashion and Entertainment Market Revenue (Million) Forecast, by Application 2019 & 2032
- Table 14: United States Smart Fabrics in Fashion and Entertainment Market Volume (K Unit) Forecast, by Application 2019 & 2032
- Table 15: Canada Smart Fabrics in Fashion and Entertainment Market Revenue (Million) Forecast, by Application 2019 & 2032
- Table 16: Canada Smart Fabrics in Fashion and Entertainment Market Volume (K Unit) Forecast, by Application 2019 & 2032
- Table 17: Mexico Smart Fabrics in Fashion and Entertainment Market Revenue (Million) Forecast, by Application 2019 & 2032
- Table 18: Mexico Smart Fabrics in Fashion and Entertainment Market Volume (K Unit) Forecast, by Application 2019 & 2032
- Table 19: Global Smart Fabrics in Fashion and Entertainment Market Revenue Million Forecast, by Country 2019 & 2032
- Table 20: Global Smart Fabrics in Fashion and Entertainment Market Volume K Unit Forecast, by Country 2019 & 2032
- Table 21: Germany Smart Fabrics in Fashion and Entertainment Market Revenue (Million) Forecast, by Application 2019 & 2032
- Table 22: Germany Smart Fabrics in Fashion and Entertainment Market Volume (K Unit) Forecast, by Application 2019 & 2032
- Table 23: United Kingdom Smart Fabrics in Fashion and Entertainment Market Revenue (Million) Forecast, by Application 2019 & 2032
- Table 24: United Kingdom Smart Fabrics in Fashion and Entertainment Market Volume (K Unit) Forecast, by Application 2019 & 2032
- Table 25: France Smart Fabrics in Fashion and Entertainment Market Revenue (Million) Forecast, by Application 2019 & 2032
- Table 26: France Smart Fabrics in Fashion and Entertainment Market Volume (K Unit) Forecast, by Application 2019 & 2032
- Table 27: Spain Smart Fabrics in Fashion and Entertainment Market Revenue (Million) Forecast, by Application 2019 & 2032
- Table 28: Spain Smart Fabrics in Fashion and Entertainment Market Volume (K Unit) Forecast, by Application 2019 & 2032
- Table 29: Italy Smart Fabrics in Fashion and Entertainment Market Revenue (Million) Forecast, by Application 2019 & 2032
- Table 30: Italy Smart Fabrics in Fashion and Entertainment Market Volume (K Unit) Forecast, by Application 2019 & 2032
- Table 31: Spain Smart Fabrics in Fashion and Entertainment Market Revenue (Million) Forecast, by Application 2019 & 2032
- Table 32: Spain Smart Fabrics in Fashion and Entertainment Market Volume (K Unit) Forecast, by Application 2019 & 2032
- Table 33: Belgium Smart Fabrics in Fashion and Entertainment Market Revenue (Million) Forecast, by Application 2019 & 2032
- Table 34: Belgium Smart Fabrics in Fashion and Entertainment Market Volume (K Unit) Forecast, by Application 2019 & 2032
- Table 35: Netherland Smart Fabrics in Fashion and Entertainment Market Revenue (Million) Forecast, by Application 2019 & 2032
- Table 36: Netherland Smart Fabrics in Fashion and Entertainment Market Volume (K Unit) Forecast, by Application 2019 & 2032
- Table 37: Nordics Smart Fabrics in Fashion and Entertainment Market Revenue (Million) Forecast, by Application 2019 & 2032
- Table 38: Nordics Smart Fabrics in Fashion and Entertainment Market Volume (K Unit) Forecast, by Application 2019 & 2032
- Table 39: Rest of Europe Smart Fabrics in Fashion and Entertainment Market Revenue (Million) Forecast, by Application 2019 & 2032
- Table 40: Rest of Europe Smart Fabrics in Fashion and Entertainment Market Volume (K Unit) Forecast, by Application 2019 & 2032
- Table 41: Global Smart Fabrics in Fashion and Entertainment Market Revenue Million Forecast, by Country 2019 & 2032
- Table 42: Global Smart Fabrics in Fashion and Entertainment Market Volume K Unit Forecast, by Country 2019 & 2032
- Table 43: China Smart Fabrics in Fashion and Entertainment Market Revenue (Million) Forecast, by Application 2019 & 2032
- Table 44: China Smart Fabrics in Fashion and Entertainment Market Volume (K Unit) Forecast, by Application 2019 & 2032
- Table 45: Japan Smart Fabrics in Fashion and Entertainment Market Revenue (Million) Forecast, by Application 2019 & 2032
- Table 46: Japan Smart Fabrics in Fashion and Entertainment Market Volume (K Unit) Forecast, by Application 2019 & 2032
- Table 47: India Smart Fabrics in Fashion and Entertainment Market Revenue (Million) Forecast, by Application 2019 & 2032
- Table 48: India Smart Fabrics in Fashion and Entertainment Market Volume (K Unit) Forecast, by Application 2019 & 2032
- Table 49: South Korea Smart Fabrics in Fashion and Entertainment Market Revenue (Million) Forecast, by Application 2019 & 2032
- Table 50: South Korea Smart Fabrics in Fashion and Entertainment Market Volume (K Unit) Forecast, by Application 2019 & 2032
- Table 51: Southeast Asia Smart Fabrics in Fashion and Entertainment Market Revenue (Million) Forecast, by Application 2019 & 2032
- Table 52: Southeast Asia Smart Fabrics in Fashion and Entertainment Market Volume (K Unit) Forecast, by Application 2019 & 2032
- Table 53: Australia Smart Fabrics in Fashion and Entertainment Market Revenue (Million) Forecast, by Application 2019 & 2032
- Table 54: Australia Smart Fabrics in Fashion and Entertainment Market Volume (K Unit) Forecast, by Application 2019 & 2032
- Table 55: Indonesia Smart Fabrics in Fashion and Entertainment Market Revenue (Million) Forecast, by Application 2019 & 2032
- Table 56: Indonesia Smart Fabrics in Fashion and Entertainment Market Volume (K Unit) Forecast, by Application 2019 & 2032
- Table 57: Phillipes Smart Fabrics in Fashion and Entertainment Market Revenue (Million) Forecast, by Application 2019 & 2032
- Table 58: Phillipes Smart Fabrics in Fashion and Entertainment Market Volume (K Unit) Forecast, by Application 2019 & 2032
- Table 59: Singapore Smart Fabrics in Fashion and Entertainment Market Revenue (Million) Forecast, by Application 2019 & 2032
- Table 60: Singapore Smart Fabrics in Fashion and Entertainment Market Volume (K Unit) Forecast, by Application 2019 & 2032
- Table 61: Thailandc Smart Fabrics in Fashion and Entertainment Market Revenue (Million) Forecast, by Application 2019 & 2032
- Table 62: Thailandc Smart Fabrics in Fashion and Entertainment Market Volume (K Unit) Forecast, by Application 2019 & 2032
- Table 63: Rest of Asia Pacific Smart Fabrics in Fashion and Entertainment Market Revenue (Million) Forecast, by Application 2019 & 2032
- Table 64: Rest of Asia Pacific Smart Fabrics in Fashion and Entertainment Market Volume (K Unit) Forecast, by Application 2019 & 2032
- Table 65: Global Smart Fabrics in Fashion and Entertainment Market Revenue Million Forecast, by Country 2019 & 2032
- Table 66: Global Smart Fabrics in Fashion and Entertainment Market Volume K Unit Forecast, by Country 2019 & 2032
- Table 67: Brazil Smart Fabrics in Fashion and Entertainment Market Revenue (Million) Forecast, by Application 2019 & 2032
- Table 68: Brazil Smart Fabrics in Fashion and Entertainment Market Volume (K Unit) Forecast, by Application 2019 & 2032
- Table 69: Argentina Smart Fabrics in Fashion and Entertainment Market Revenue (Million) Forecast, by Application 2019 & 2032
- Table 70: Argentina Smart Fabrics in Fashion and Entertainment Market Volume (K Unit) Forecast, by Application 2019 & 2032
- Table 71: Peru Smart Fabrics in Fashion and Entertainment Market Revenue (Million) Forecast, by Application 2019 & 2032
- Table 72: Peru Smart Fabrics in Fashion and Entertainment Market Volume (K Unit) Forecast, by Application 2019 & 2032
- Table 73: Chile Smart Fabrics in Fashion and Entertainment Market Revenue (Million) Forecast, by Application 2019 & 2032
- Table 74: Chile Smart Fabrics in Fashion and Entertainment Market Volume (K Unit) Forecast, by Application 2019 & 2032
- Table 75: Colombia Smart Fabrics in Fashion and Entertainment Market Revenue (Million) Forecast, by Application 2019 & 2032
- Table 76: Colombia Smart Fabrics in Fashion and Entertainment Market Volume (K Unit) Forecast, by Application 2019 & 2032
- Table 77: Ecuador Smart Fabrics in Fashion and Entertainment Market Revenue (Million) Forecast, by Application 2019 & 2032
- Table 78: Ecuador Smart Fabrics in Fashion and Entertainment Market Volume (K Unit) Forecast, by Application 2019 & 2032
- Table 79: Venezuela Smart Fabrics in Fashion and Entertainment Market Revenue (Million) Forecast, by Application 2019 & 2032
- Table 80: Venezuela Smart Fabrics in Fashion and Entertainment Market Volume (K Unit) Forecast, by Application 2019 & 2032
- Table 81: Rest of South America Smart Fabrics in Fashion and Entertainment Market Revenue (Million) Forecast, by Application 2019 & 2032
- Table 82: Rest of South America Smart Fabrics in Fashion and Entertainment Market Volume (K Unit) Forecast, by Application 2019 & 2032
- Table 83: Global Smart Fabrics in Fashion and Entertainment Market Revenue Million Forecast, by Country 2019 & 2032
- Table 84: Global Smart Fabrics in Fashion and Entertainment Market Volume K Unit Forecast, by Country 2019 & 2032
- Table 85: United States Smart Fabrics in Fashion and Entertainment Market Revenue (Million) Forecast, by Application 2019 & 2032
- Table 86: United States Smart Fabrics in Fashion and Entertainment Market Volume (K Unit) Forecast, by Application 2019 & 2032
- Table 87: Canada Smart Fabrics in Fashion and Entertainment Market Revenue (Million) Forecast, by Application 2019 & 2032
- Table 88: Canada Smart Fabrics in Fashion and Entertainment Market Volume (K Unit) Forecast, by Application 2019 & 2032
- Table 89: Mexico Smart Fabrics in Fashion and Entertainment Market Revenue (Million) Forecast, by Application 2019 & 2032
- Table 90: Mexico Smart Fabrics in Fashion and Entertainment Market Volume (K Unit) Forecast, by Application 2019 & 2032
- Table 91: Global Smart Fabrics in Fashion and Entertainment Market Revenue Million Forecast, by Country 2019 & 2032
- Table 92: Global Smart Fabrics in Fashion and Entertainment Market Volume K Unit Forecast, by Country 2019 & 2032
- Table 93: United Arab Emirates Smart Fabrics in Fashion and Entertainment Market Revenue (Million) Forecast, by Application 2019 & 2032
- Table 94: United Arab Emirates Smart Fabrics in Fashion and Entertainment Market Volume (K Unit) Forecast, by Application 2019 & 2032
- Table 95: Saudi Arabia Smart Fabrics in Fashion and Entertainment Market Revenue (Million) Forecast, by Application 2019 & 2032
- Table 96: Saudi Arabia Smart Fabrics in Fashion and Entertainment Market Volume (K Unit) Forecast, by Application 2019 & 2032
- Table 97: South Africa Smart Fabrics in Fashion and Entertainment Market Revenue (Million) Forecast, by Application 2019 & 2032
- Table 98: South Africa Smart Fabrics in Fashion and Entertainment Market Volume (K Unit) Forecast, by Application 2019 & 2032
- Table 99: Rest of Middle East and Africa Smart Fabrics in Fashion and Entertainment Market Revenue (Million) Forecast, by Application 2019 & 2032
- Table 100: Rest of Middle East and Africa Smart Fabrics in Fashion and Entertainment Market Volume (K Unit) Forecast, by Application 2019 & 2032
- Table 101: Global Smart Fabrics in Fashion and Entertainment Market Revenue Million Forecast, by Type of Product 2019 & 2032
- Table 102: Global Smart Fabrics in Fashion and Entertainment Market Volume K Unit Forecast, by Type of Product 2019 & 2032
- Table 103: Global Smart Fabrics in Fashion and Entertainment Market Revenue Million Forecast, by Material 2019 & 2032
- Table 104: Global Smart Fabrics in Fashion and Entertainment Market Volume K Unit Forecast, by Material 2019 & 2032
- Table 105: Global Smart Fabrics in Fashion and Entertainment Market Revenue Million Forecast, by Application 2019 & 2032
- Table 106: Global Smart Fabrics in Fashion and Entertainment Market Volume K Unit Forecast, by Application 2019 & 2032
- Table 107: Global Smart Fabrics in Fashion and Entertainment Market Revenue Million Forecast, by Country 2019 & 2032
- Table 108: Global Smart Fabrics in Fashion and Entertainment Market Volume K Unit Forecast, by Country 2019 & 2032
- Table 109: Global Smart Fabrics in Fashion and Entertainment Market Revenue Million Forecast, by Type of Product 2019 & 2032
- Table 110: Global Smart Fabrics in Fashion and Entertainment Market Volume K Unit Forecast, by Type of Product 2019 & 2032
- Table 111: Global Smart Fabrics in Fashion and Entertainment Market Revenue Million Forecast, by Material 2019 & 2032
- Table 112: Global Smart Fabrics in Fashion and Entertainment Market Volume K Unit Forecast, by Material 2019 & 2032
- Table 113: Global Smart Fabrics in Fashion and Entertainment Market Revenue Million Forecast, by Application 2019 & 2032
- Table 114: Global Smart Fabrics in Fashion and Entertainment Market Volume K Unit Forecast, by Application 2019 & 2032
- Table 115: Global Smart Fabrics in Fashion and Entertainment Market Revenue Million Forecast, by Country 2019 & 2032
- Table 116: Global Smart Fabrics in Fashion and Entertainment Market Volume K Unit Forecast, by Country 2019 & 2032
- Table 117: Global Smart Fabrics in Fashion and Entertainment Market Revenue Million Forecast, by Type of Product 2019 & 2032
- Table 118: Global Smart Fabrics in Fashion and Entertainment Market Volume K Unit Forecast, by Type of Product 2019 & 2032
- Table 119: Global Smart Fabrics in Fashion and Entertainment Market Revenue Million Forecast, by Material 2019 & 2032
- Table 120: Global Smart Fabrics in Fashion and Entertainment Market Volume K Unit Forecast, by Material 2019 & 2032
- Table 121: Global Smart Fabrics in Fashion and Entertainment Market Revenue Million Forecast, by Application 2019 & 2032
- Table 122: Global Smart Fabrics in Fashion and Entertainment Market Volume K Unit Forecast, by Application 2019 & 2032
- Table 123: Global Smart Fabrics in Fashion and Entertainment Market Revenue Million Forecast, by Country 2019 & 2032
- Table 124: Global Smart Fabrics in Fashion and Entertainment Market Volume K Unit Forecast, by Country 2019 & 2032
- Table 125: Global Smart Fabrics in Fashion and Entertainment Market Revenue Million Forecast, by Type of Product 2019 & 2032
- Table 126: Global Smart Fabrics in Fashion and Entertainment Market Volume K Unit Forecast, by Type of Product 2019 & 2032
- Table 127: Global Smart Fabrics in Fashion and Entertainment Market Revenue Million Forecast, by Material 2019 & 2032
- Table 128: Global Smart Fabrics in Fashion and Entertainment Market Volume K Unit Forecast, by Material 2019 & 2032
- Table 129: Global Smart Fabrics in Fashion and Entertainment Market Revenue Million Forecast, by Application 2019 & 2032
- Table 130: Global Smart Fabrics in Fashion and Entertainment Market Volume K Unit Forecast, by Application 2019 & 2032
- Table 131: Global Smart Fabrics in Fashion and Entertainment Market Revenue Million Forecast, by Country 2019 & 2032
- Table 132: Global Smart Fabrics in Fashion and Entertainment Market Volume K Unit Forecast, by Country 2019 & 2032
- Table 133: Global Smart Fabrics in Fashion and Entertainment Market Revenue Million Forecast, by Type of Product 2019 & 2032
- Table 134: Global Smart Fabrics in Fashion and Entertainment Market Volume K Unit Forecast, by Type of Product 2019 & 2032
- Table 135: Global Smart Fabrics in Fashion and Entertainment Market Revenue Million Forecast, by Material 2019 & 2032
- Table 136: Global Smart Fabrics in Fashion and Entertainment Market Volume K Unit Forecast, by Material 2019 & 2032
- Table 137: Global Smart Fabrics in Fashion and Entertainment Market Revenue Million Forecast, by Application 2019 & 2032
- Table 138: Global Smart Fabrics in Fashion and Entertainment Market Volume K Unit Forecast, by Application 2019 & 2032
- Table 139: Global Smart Fabrics in Fashion and Entertainment Market Revenue Million Forecast, by Country 2019 & 2032
- Table 140: Global Smart Fabrics in Fashion and Entertainment Market Volume K Unit Forecast, by Country 2019 & 2032
Frequently Asked Questions
1. What is the projected Compound Annual Growth Rate (CAGR) of the Smart Fabrics in Fashion and Entertainment Market?
The projected CAGR is approximately 31.29%.
2. Which companies are prominent players in the Smart Fabrics in Fashion and Entertainment Market?
Key companies in the market include Textronics Inc, Bebop Sensors Inc , AIQ Smart Clothing Inc, Outlast Technologies LLC, Gentherm Incorporated, Intelligent Textiles Limited, Schoeller Technologies AG, Sensoria Inc, Clothing Plus Ltd, Interactive Wear AG, E L Du Pont De Nemours and Company.
3. What are the main segments of the Smart Fabrics in Fashion and Entertainment Market?
The market segments include Type of Product, Material, Application .
4. Can you provide details about the market size?
The market size is estimated to be USD XX Million as of 2022.
5. What are some drivers contributing to market growth?
Miniaturization of Electronic Components Influencing the Growth of the Market; Increasing Use of Wearable Electronics; Rapid Growth of Low-cost Smart Wireless Sensor Networks.
6. What are the notable trends driving market growth?
Adoption of Wearable Devices to Drive the Market's Growth.
7. Are there any restraints impacting market growth?
Very High Implementation Costs.
8. Can you provide examples of recent developments in the market?
July 2022 - Microsoft developed a smart fabric that detects objects and gestures. Layer networked sensors embedded in the material can detect an object or motion, and it is more than simply a few sensors sewed in. The patent also describes the creation of data processing circuitry. It can receive, process, and transmit data from the smart fabric.
9. What pricing options are available for accessing the report?
Pricing options include single-user, multi-user, and enterprise licenses priced at USD 4750, USD 5250, and USD 8750 respectively.
10. Is the market size provided in terms of value or volume?
The market size is provided in terms of value, measured in Million and volume, measured in K Unit.
11. Are there any specific market keywords associated with the report?
Yes, the market keyword associated with the report is "Smart Fabrics in Fashion and Entertainment Market," which aids in identifying and referencing the specific market segment covered.
12. How do I determine which pricing option suits my needs best?
The pricing options vary based on user requirements and access needs. Individual users may opt for single-user licenses, while businesses requiring broader access may choose multi-user or enterprise licenses for cost-effective access to the report.
13. Are there any additional resources or data provided in the Smart Fabrics in Fashion and Entertainment Market report?
While the report offers comprehensive insights, it's advisable to review the specific contents or supplementary materials provided to ascertain if additional resources or data are available.
14. How can I stay updated on further developments or reports in the Smart Fabrics in Fashion and Entertainment Market?
To stay informed about further developments, trends, and reports in the Smart Fabrics in Fashion and Entertainment Market, consider subscribing to industry newsletters, following relevant companies and organizations, or regularly checking reputable industry news sources and publications.
Methodology
Step 1 - Identification of Relevant Samples Size from Population Database


Step 2 - Approaches for Defining Global Market Size (Value, Volume* & Price*)

Note*: In applicable scenarios
Step 3 - Data Sources
Primary Research
- Web Analytics
- Survey Reports
- Research Institute
- Latest Research Reports
- Opinion Leaders
Secondary Research
- Annual Reports
- White Paper
- Latest Press Release
- Industry Association
- Paid Database
- Investor Presentations

Step 4 - Data Triangulation
Involves using different sources of information in order to increase the validity of a study
These sources are likely to be stakeholders in a program - participants, other researchers, program staff, other community members, and so on.
Then we put all data in single framework & apply various statistical tools to find out the dynamic on the market.
During the analysis stage, feedback from the stakeholder groups would be compared to determine areas of agreement as well as areas of divergence


