
Key Insights
The Smart Learning Systems market is experiencing robust growth, projected to reach a substantial size driven by several key factors. The 22.50% CAGR from 2019-2024 indicates significant market expansion, fueled by increasing adoption of technology in education, growing demand for personalized learning experiences, and the rising need for effective remote learning solutions. The market is segmented by product (hardware, software, services, mobile devices including smartphones and tablets) and end-user (academic institutions and corporate training programs). Hardware solutions, encompassing interactive whiteboards, projectors, and learning management systems (LMS), constitute a significant portion of the market. The software segment, comprising LMS platforms, educational apps, and virtual reality (VR) learning tools, is also experiencing rapid growth, driven by the increasing availability of high-speed internet and affordable devices. Service offerings, including system integration, training, and support, are crucial for successful implementation and adoption of smart learning solutions. The academic sector currently dominates the market share, however, the corporate segment is exhibiting strong growth potential as companies increasingly invest in employee training and development using advanced technological tools. Competition is high, with established players like Blackboard, Microsoft, and Pearson alongside emerging technology providers continuously innovating to meet evolving educational needs. Geographic expansion is also a key driver, with regions like Asia Pacific showing promising growth due to increasing investment in education infrastructure and rising internet penetration. However, challenges such as high initial investment costs, lack of digital literacy in certain regions, and the need for robust cybersecurity measures might restrain market growth in the short-term. Despite these challenges, the long-term outlook for the Smart Learning Systems market remains overwhelmingly positive, with continuous technological advancements and increasing government initiatives supporting digital education fostering further expansion.
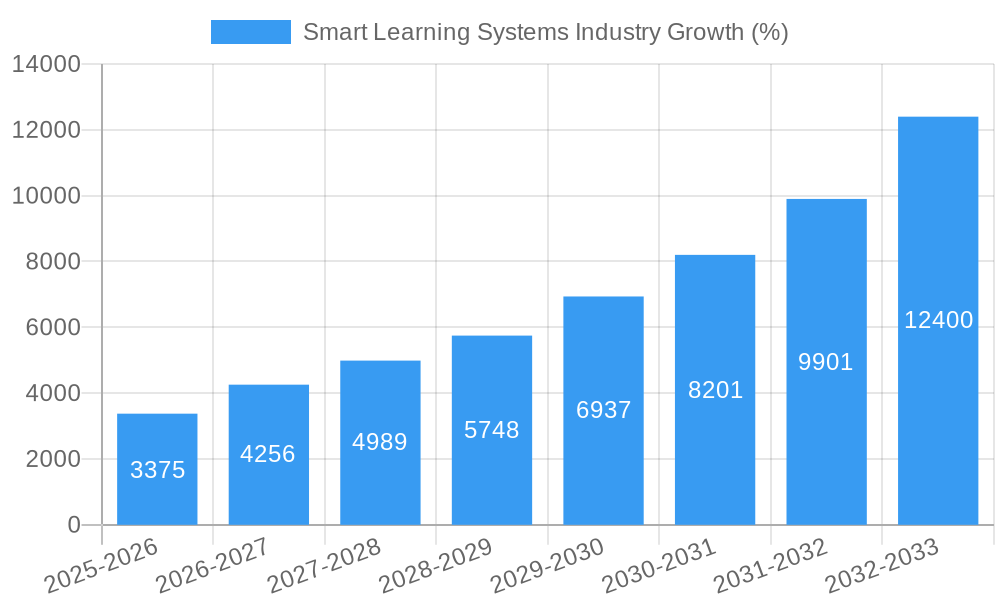
The forecast period (2025-2033) suggests continued market expansion, further propelled by the increasing integration of Artificial Intelligence (AI) and machine learning in educational tools. Personalized learning paths, adaptive assessments, and AI-driven tutoring systems are poised to transform the learning experience. The ongoing development of immersive technologies like VR and augmented reality (AR) will offer engaging and interactive learning environments. Growth will be particularly pronounced in developing economies, as these regions increasingly prioritize digital education infrastructure development and enhance access to technology for students. Furthermore, the integration of smart learning systems with existing educational platforms and the emergence of cloud-based solutions are key trends streamlining accessibility and scalability. Successful players will be those that effectively leverage technological advancements while addressing concerns about data privacy, security and ensuring equitable access to these transformative technologies.

Smart Learning Systems Industry: A Comprehensive Market Report (2019-2033)
This comprehensive report provides an in-depth analysis of the Smart Learning Systems industry, offering valuable insights for stakeholders, investors, and industry professionals. The study period covers 2019-2033, with a base year of 2025 and a forecast period of 2025-2033. The report meticulously examines market trends, competitive dynamics, technological advancements, and growth opportunities within this rapidly evolving sector. Market values are expressed in Millions.
Smart Learning Systems Industry Market Concentration & Innovation
The Smart Learning Systems market exhibits a moderately concentrated landscape, with key players like Smart Technologies Inc, Blackboard Inc, Dell EMC, Microsoft Corporation, Desire2learn, Pearson PLC, Cisco Systems Inc, Promethean World, Citrix Systems Inc, SAP SE, and Ellucian Company holding significant market share. The combined market share of the top five players is estimated at 60% in 2025. Innovation is driven by advancements in Artificial Intelligence (AI), Virtual Reality (VR), Augmented Reality (AR), and cloud-based learning platforms. Regulatory frameworks, particularly concerning data privacy and security, significantly impact market dynamics. Product substitutes, such as traditional learning methods, pose a competitive challenge, though their market penetration is steadily declining. End-user trends, particularly the increasing adoption of personalized learning and blended learning models, are key growth drivers. M&A activity has been significant in recent years, with deal values exceeding $xx Million in 2024, mainly focused on expanding product portfolios and market reach.
Smart Learning Systems Industry Industry Trends & Insights
The Smart Learning Systems market is experiencing robust growth, with a projected Compound Annual Growth Rate (CAGR) of xx% during the forecast period (2025-2033). This growth is fueled by several factors, including the rising adoption of technology in education and corporate training, increasing demand for personalized learning experiences, and the growing prevalence of remote learning and online education. Technological disruptions, such as the proliferation of AI-powered learning platforms and the integration of VR/AR technologies, are reshaping the learning landscape. Consumer preferences are shifting towards interactive, engaging, and personalized learning solutions. Competitive dynamics are intense, with companies focusing on innovation, strategic partnerships, and acquisitions to gain a competitive edge. Market penetration of smart learning systems is expected to reach xx% by 2033, particularly within the corporate sector.
Dominant Markets & Segments in Smart Learning Systems Industry
The North American market currently dominates the Smart Learning Systems industry, driven by strong technological infrastructure, substantial investment in education technology, and a high level of digital literacy. Within the segments:
- Product: Software holds the largest market share, followed by hardware and services. The growth of software is driven by the rising demand for cloud-based learning platforms and AI-powered learning tools.
- Mobile Devices: Smartphones and tablets are increasingly used for accessing learning materials, contributing to the overall market growth. The increasing affordability of these devices in developing economies is further boosting the market.
- End User: The academic segment is currently the largest, however, the corporate segment is projected to experience faster growth due to the growing need for upskilling and reskilling initiatives.
Key drivers for the dominance of North America include:
- Strong government support for educational technology.
- High levels of internet penetration and digital literacy.
- A mature technology ecosystem with a large number of tech companies.
Smart Learning Systems Industry Product Developments
Recent product innovations focus on AI-powered personalized learning platforms, VR/AR-based immersive learning experiences, and gamified learning modules to enhance engagement and knowledge retention. These innovations cater to diverse learning styles and preferences, providing competitive advantages through enhanced user experience and effective learning outcomes. The market is witnessing a shift towards cloud-based, subscription-based models, offering scalability and accessibility.
Report Scope & Segmentation Analysis
This report segments the Smart Learning Systems market based on:
- Product: Hardware (including interactive whiteboards, projectors, and other classroom technology), Software (Learning Management Systems (LMS), content creation tools), Service (implementation, training, and support).
- Mobile Devices: Smartphones and Tablets.
- End User: Academic (K-12, higher education), Corporate (employee training, professional development).
Each segment is analyzed for its growth projections, market size, and competitive dynamics. For example, the software segment is expected to witness significant growth, driven by increased demand for cloud-based LMS solutions, while the hardware segment is likely to experience moderate growth, primarily driven by the adoption of interactive classroom technology.
Key Drivers of Smart Learning Systems Industry Growth
The Smart Learning Systems industry's growth is driven by technological advancements, such as AI, VR/AR, and cloud computing; increasing government investments in education technology; the rising demand for personalized learning; the growing adoption of online and blended learning models; and the increasing need for upskilling and reskilling initiatives in the corporate sector.
Challenges in the Smart Learning Systems Industry Sector
Challenges include high initial investment costs for implementing smart learning systems, concerns about data privacy and security, the digital divide among students and employees, and the need for effective teacher training and integration. The global chip shortage has also temporarily impacted the availability of certain hardware components, resulting in xx Million loss in revenue in 2024.
Emerging Opportunities in Smart Learning Systems Industry
Emerging opportunities include the expansion into new markets (especially developing economies), the integration of blockchain technology for secure credential management, personalized learning recommendations via AI, and the development of immersive learning experiences using Extended Reality (XR) technologies.
Leading Players in the Smart Learning Systems Industry Market
- Smart Technologies Inc
- Blackboard Inc
- Dell EMC
- Microsoft Corporation
- Desire2learn
- Pearson PLC
- Cisco Systems Inc
- Promethean World
- Citrix Systems Inc
- SAP SE
- Ellucian Company
Key Developments in Smart Learning Systems Industry Industry
- Jan 2023: Blackboard Inc. launched a new AI-powered learning platform.
- March 2024: Smart Technologies Inc. acquired a smaller educational technology company, expanding its product portfolio.
- June 2024: Microsoft Corporation announced a significant investment in educational technology research and development.
Strategic Outlook for Smart Learning Systems Industry Market
The Smart Learning Systems market is poised for continued growth, driven by technological innovation and the increasing adoption of technology across all sectors of education and training. Future opportunities lie in leveraging emerging technologies such as AI, VR/AR, and blockchain to create highly personalized, engaging, and effective learning experiences. Companies that adapt quickly to evolving technological trends and consumer preferences will be best positioned for success in this dynamic market.
Smart Learning Systems Industry Segmentation
-
1. Product
-
1.1. Hardware
- 1.1.1. Interactive Display
- 1.1.2. Student Response System
-
1.1.3. Mobile Devices
- 1.1.3.1. Smartphones
- 1.1.3.2. Tablets
- 1.2. Software
- 1.3. Service
-
1.1. Hardware
-
2. End User
- 2.1. Academic
- 2.2. Corporate
Smart Learning Systems Industry Segmentation By Geography
- 1. North America
- 2. Europe
- 3. Asia Pacific
- 4. Latin America
- 5. Middle East and Africa

Smart Learning Systems Industry REPORT HIGHLIGHTS
| Aspects | Details |
|---|---|
| Study Period | 2019-2033 |
| Base Year | 2024 |
| Estimated Year | 2025 |
| Forecast Period | 2025-2033 |
| Historical Period | 2019-2024 |
| Growth Rate | CAGR of 22.50% from 2019-2033 |
| Segmentation |
|
Table of Contents
- 1. Introduction
- 1.1. Research Scope
- 1.2. Market Segmentation
- 1.3. Research Methodology
- 1.4. Definitions and Assumptions
- 2. Executive Summary
- 2.1. Introduction
- 3. Market Dynamics
- 3.1. Introduction
- 3.2. Market Drivers
- 3.2.1. ; Growing Adoption of Digital Learning Solutions; Growing Concept of BYOD
- 3.3. Market Restrains
- 3.3.1. ; Lack of Infrastructure and Limited Awareness about E-learning
- 3.4. Market Trends
- 3.4.1. Mobile Devices are Expected to Witness Significant Growth
- 4. Market Factor Analysis
- 4.1. Porters Five Forces
- 4.2. Supply/Value Chain
- 4.3. PESTEL analysis
- 4.4. Market Entropy
- 4.5. Patent/Trademark Analysis
- 5. Global Smart Learning Systems Industry Analysis, Insights and Forecast, 2019-2031
- 5.1. Market Analysis, Insights and Forecast - by Product
- 5.1.1. Hardware
- 5.1.1.1. Interactive Display
- 5.1.1.2. Student Response System
- 5.1.1.3. Mobile Devices
- 5.1.1.3.1. Smartphones
- 5.1.1.3.2. Tablets
- 5.1.2. Software
- 5.1.3. Service
- 5.1.1. Hardware
- 5.2. Market Analysis, Insights and Forecast - by End User
- 5.2.1. Academic
- 5.2.2. Corporate
- 5.3. Market Analysis, Insights and Forecast - by Region
- 5.3.1. North America
- 5.3.2. Europe
- 5.3.3. Asia Pacific
- 5.3.4. Latin America
- 5.3.5. Middle East and Africa
- 5.1. Market Analysis, Insights and Forecast - by Product
- 6. North America Smart Learning Systems Industry Analysis, Insights and Forecast, 2019-2031
- 6.1. Market Analysis, Insights and Forecast - by Product
- 6.1.1. Hardware
- 6.1.1.1. Interactive Display
- 6.1.1.2. Student Response System
- 6.1.1.3. Mobile Devices
- 6.1.1.3.1. Smartphones
- 6.1.1.3.2. Tablets
- 6.1.2. Software
- 6.1.3. Service
- 6.1.1. Hardware
- 6.2. Market Analysis, Insights and Forecast - by End User
- 6.2.1. Academic
- 6.2.2. Corporate
- 6.1. Market Analysis, Insights and Forecast - by Product
- 7. Europe Smart Learning Systems Industry Analysis, Insights and Forecast, 2019-2031
- 7.1. Market Analysis, Insights and Forecast - by Product
- 7.1.1. Hardware
- 7.1.1.1. Interactive Display
- 7.1.1.2. Student Response System
- 7.1.1.3. Mobile Devices
- 7.1.1.3.1. Smartphones
- 7.1.1.3.2. Tablets
- 7.1.2. Software
- 7.1.3. Service
- 7.1.1. Hardware
- 7.2. Market Analysis, Insights and Forecast - by End User
- 7.2.1. Academic
- 7.2.2. Corporate
- 7.1. Market Analysis, Insights and Forecast - by Product
- 8. Asia Pacific Smart Learning Systems Industry Analysis, Insights and Forecast, 2019-2031
- 8.1. Market Analysis, Insights and Forecast - by Product
- 8.1.1. Hardware
- 8.1.1.1. Interactive Display
- 8.1.1.2. Student Response System
- 8.1.1.3. Mobile Devices
- 8.1.1.3.1. Smartphones
- 8.1.1.3.2. Tablets
- 8.1.2. Software
- 8.1.3. Service
- 8.1.1. Hardware
- 8.2. Market Analysis, Insights and Forecast - by End User
- 8.2.1. Academic
- 8.2.2. Corporate
- 8.1. Market Analysis, Insights and Forecast - by Product
- 9. Latin America Smart Learning Systems Industry Analysis, Insights and Forecast, 2019-2031
- 9.1. Market Analysis, Insights and Forecast - by Product
- 9.1.1. Hardware
- 9.1.1.1. Interactive Display
- 9.1.1.2. Student Response System
- 9.1.1.3. Mobile Devices
- 9.1.1.3.1. Smartphones
- 9.1.1.3.2. Tablets
- 9.1.2. Software
- 9.1.3. Service
- 9.1.1. Hardware
- 9.2. Market Analysis, Insights and Forecast - by End User
- 9.2.1. Academic
- 9.2.2. Corporate
- 9.1. Market Analysis, Insights and Forecast - by Product
- 10. Middle East and Africa Smart Learning Systems Industry Analysis, Insights and Forecast, 2019-2031
- 10.1. Market Analysis, Insights and Forecast - by Product
- 10.1.1. Hardware
- 10.1.1.1. Interactive Display
- 10.1.1.2. Student Response System
- 10.1.1.3. Mobile Devices
- 10.1.1.3.1. Smartphones
- 10.1.1.3.2. Tablets
- 10.1.2. Software
- 10.1.3. Service
- 10.1.1. Hardware
- 10.2. Market Analysis, Insights and Forecast - by End User
- 10.2.1. Academic
- 10.2.2. Corporate
- 10.1. Market Analysis, Insights and Forecast - by Product
- 11. North America Smart Learning Systems Industry Analysis, Insights and Forecast, 2019-2031
- 11.1. Market Analysis, Insights and Forecast - By Country/Sub-region
- 11.1.1.
- 12. Europe Smart Learning Systems Industry Analysis, Insights and Forecast, 2019-2031
- 12.1. Market Analysis, Insights and Forecast - By Country/Sub-region
- 12.1.1.
- 13. Asia Pacific Smart Learning Systems Industry Analysis, Insights and Forecast, 2019-2031
- 13.1. Market Analysis, Insights and Forecast - By Country/Sub-region
- 13.1.1.
- 14. Latin America Smart Learning Systems Industry Analysis, Insights and Forecast, 2019-2031
- 14.1. Market Analysis, Insights and Forecast - By Country/Sub-region
- 14.1.1.
- 15. Middle East and Africa Smart Learning Systems Industry Analysis, Insights and Forecast, 2019-2031
- 15.1. Market Analysis, Insights and Forecast - By Country/Sub-region
- 15.1.1.
- 16. Competitive Analysis
- 16.1. Global Market Share Analysis 2024
- 16.2. Company Profiles
- 16.2.1 Smart Technologies Inc
- 16.2.1.1. Overview
- 16.2.1.2. Products
- 16.2.1.3. SWOT Analysis
- 16.2.1.4. Recent Developments
- 16.2.1.5. Financials (Based on Availability)
- 16.2.2 Blackboard Inc
- 16.2.2.1. Overview
- 16.2.2.2. Products
- 16.2.2.3. SWOT Analysis
- 16.2.2.4. Recent Developments
- 16.2.2.5. Financials (Based on Availability)
- 16.2.3 Dell EMC
- 16.2.3.1. Overview
- 16.2.3.2. Products
- 16.2.3.3. SWOT Analysis
- 16.2.3.4. Recent Developments
- 16.2.3.5. Financials (Based on Availability)
- 16.2.4 Microsoft Corporation
- 16.2.4.1. Overview
- 16.2.4.2. Products
- 16.2.4.3. SWOT Analysis
- 16.2.4.4. Recent Developments
- 16.2.4.5. Financials (Based on Availability)
- 16.2.5 Desire2learn
- 16.2.5.1. Overview
- 16.2.5.2. Products
- 16.2.5.3. SWOT Analysis
- 16.2.5.4. Recent Developments
- 16.2.5.5. Financials (Based on Availability)
- 16.2.6 Pearson PLC
- 16.2.6.1. Overview
- 16.2.6.2. Products
- 16.2.6.3. SWOT Analysis
- 16.2.6.4. Recent Developments
- 16.2.6.5. Financials (Based on Availability)
- 16.2.7 Cisco Systems Inc *List Not Exhaustive
- 16.2.7.1. Overview
- 16.2.7.2. Products
- 16.2.7.3. SWOT Analysis
- 16.2.7.4. Recent Developments
- 16.2.7.5. Financials (Based on Availability)
- 16.2.8 Promethean World
- 16.2.8.1. Overview
- 16.2.8.2. Products
- 16.2.8.3. SWOT Analysis
- 16.2.8.4. Recent Developments
- 16.2.8.5. Financials (Based on Availability)
- 16.2.9 Citrix Systems Inc
- 16.2.9.1. Overview
- 16.2.9.2. Products
- 16.2.9.3. SWOT Analysis
- 16.2.9.4. Recent Developments
- 16.2.9.5. Financials (Based on Availability)
- 16.2.10 SAP SE
- 16.2.10.1. Overview
- 16.2.10.2. Products
- 16.2.10.3. SWOT Analysis
- 16.2.10.4. Recent Developments
- 16.2.10.5. Financials (Based on Availability)
- 16.2.11 Ellucian Company
- 16.2.11.1. Overview
- 16.2.11.2. Products
- 16.2.11.3. SWOT Analysis
- 16.2.11.4. Recent Developments
- 16.2.11.5. Financials (Based on Availability)
- 16.2.1 Smart Technologies Inc
List of Figures
- Figure 1: Global Smart Learning Systems Industry Revenue Breakdown (Million, %) by Region 2024 & 2032
- Figure 2: North America Smart Learning Systems Industry Revenue (Million), by Country 2024 & 2032
- Figure 3: North America Smart Learning Systems Industry Revenue Share (%), by Country 2024 & 2032
- Figure 4: Europe Smart Learning Systems Industry Revenue (Million), by Country 2024 & 2032
- Figure 5: Europe Smart Learning Systems Industry Revenue Share (%), by Country 2024 & 2032
- Figure 6: Asia Pacific Smart Learning Systems Industry Revenue (Million), by Country 2024 & 2032
- Figure 7: Asia Pacific Smart Learning Systems Industry Revenue Share (%), by Country 2024 & 2032
- Figure 8: Latin America Smart Learning Systems Industry Revenue (Million), by Country 2024 & 2032
- Figure 9: Latin America Smart Learning Systems Industry Revenue Share (%), by Country 2024 & 2032
- Figure 10: Middle East and Africa Smart Learning Systems Industry Revenue (Million), by Country 2024 & 2032
- Figure 11: Middle East and Africa Smart Learning Systems Industry Revenue Share (%), by Country 2024 & 2032
- Figure 12: North America Smart Learning Systems Industry Revenue (Million), by Product 2024 & 2032
- Figure 13: North America Smart Learning Systems Industry Revenue Share (%), by Product 2024 & 2032
- Figure 14: North America Smart Learning Systems Industry Revenue (Million), by End User 2024 & 2032
- Figure 15: North America Smart Learning Systems Industry Revenue Share (%), by End User 2024 & 2032
- Figure 16: North America Smart Learning Systems Industry Revenue (Million), by Country 2024 & 2032
- Figure 17: North America Smart Learning Systems Industry Revenue Share (%), by Country 2024 & 2032
- Figure 18: Europe Smart Learning Systems Industry Revenue (Million), by Product 2024 & 2032
- Figure 19: Europe Smart Learning Systems Industry Revenue Share (%), by Product 2024 & 2032
- Figure 20: Europe Smart Learning Systems Industry Revenue (Million), by End User 2024 & 2032
- Figure 21: Europe Smart Learning Systems Industry Revenue Share (%), by End User 2024 & 2032
- Figure 22: Europe Smart Learning Systems Industry Revenue (Million), by Country 2024 & 2032
- Figure 23: Europe Smart Learning Systems Industry Revenue Share (%), by Country 2024 & 2032
- Figure 24: Asia Pacific Smart Learning Systems Industry Revenue (Million), by Product 2024 & 2032
- Figure 25: Asia Pacific Smart Learning Systems Industry Revenue Share (%), by Product 2024 & 2032
- Figure 26: Asia Pacific Smart Learning Systems Industry Revenue (Million), by End User 2024 & 2032
- Figure 27: Asia Pacific Smart Learning Systems Industry Revenue Share (%), by End User 2024 & 2032
- Figure 28: Asia Pacific Smart Learning Systems Industry Revenue (Million), by Country 2024 & 2032
- Figure 29: Asia Pacific Smart Learning Systems Industry Revenue Share (%), by Country 2024 & 2032
- Figure 30: Latin America Smart Learning Systems Industry Revenue (Million), by Product 2024 & 2032
- Figure 31: Latin America Smart Learning Systems Industry Revenue Share (%), by Product 2024 & 2032
- Figure 32: Latin America Smart Learning Systems Industry Revenue (Million), by End User 2024 & 2032
- Figure 33: Latin America Smart Learning Systems Industry Revenue Share (%), by End User 2024 & 2032
- Figure 34: Latin America Smart Learning Systems Industry Revenue (Million), by Country 2024 & 2032
- Figure 35: Latin America Smart Learning Systems Industry Revenue Share (%), by Country 2024 & 2032
- Figure 36: Middle East and Africa Smart Learning Systems Industry Revenue (Million), by Product 2024 & 2032
- Figure 37: Middle East and Africa Smart Learning Systems Industry Revenue Share (%), by Product 2024 & 2032
- Figure 38: Middle East and Africa Smart Learning Systems Industry Revenue (Million), by End User 2024 & 2032
- Figure 39: Middle East and Africa Smart Learning Systems Industry Revenue Share (%), by End User 2024 & 2032
- Figure 40: Middle East and Africa Smart Learning Systems Industry Revenue (Million), by Country 2024 & 2032
- Figure 41: Middle East and Africa Smart Learning Systems Industry Revenue Share (%), by Country 2024 & 2032
List of Tables
- Table 1: Global Smart Learning Systems Industry Revenue Million Forecast, by Region 2019 & 2032
- Table 2: Global Smart Learning Systems Industry Revenue Million Forecast, by Product 2019 & 2032
- Table 3: Global Smart Learning Systems Industry Revenue Million Forecast, by End User 2019 & 2032
- Table 4: Global Smart Learning Systems Industry Revenue Million Forecast, by Region 2019 & 2032
- Table 5: Global Smart Learning Systems Industry Revenue Million Forecast, by Country 2019 & 2032
- Table 6: Smart Learning Systems Industry Revenue (Million) Forecast, by Application 2019 & 2032
- Table 7: Global Smart Learning Systems Industry Revenue Million Forecast, by Country 2019 & 2032
- Table 8: Smart Learning Systems Industry Revenue (Million) Forecast, by Application 2019 & 2032
- Table 9: Global Smart Learning Systems Industry Revenue Million Forecast, by Country 2019 & 2032
- Table 10: Smart Learning Systems Industry Revenue (Million) Forecast, by Application 2019 & 2032
- Table 11: Global Smart Learning Systems Industry Revenue Million Forecast, by Country 2019 & 2032
- Table 12: Smart Learning Systems Industry Revenue (Million) Forecast, by Application 2019 & 2032
- Table 13: Global Smart Learning Systems Industry Revenue Million Forecast, by Country 2019 & 2032
- Table 14: Smart Learning Systems Industry Revenue (Million) Forecast, by Application 2019 & 2032
- Table 15: Global Smart Learning Systems Industry Revenue Million Forecast, by Product 2019 & 2032
- Table 16: Global Smart Learning Systems Industry Revenue Million Forecast, by End User 2019 & 2032
- Table 17: Global Smart Learning Systems Industry Revenue Million Forecast, by Country 2019 & 2032
- Table 18: Global Smart Learning Systems Industry Revenue Million Forecast, by Product 2019 & 2032
- Table 19: Global Smart Learning Systems Industry Revenue Million Forecast, by End User 2019 & 2032
- Table 20: Global Smart Learning Systems Industry Revenue Million Forecast, by Country 2019 & 2032
- Table 21: Global Smart Learning Systems Industry Revenue Million Forecast, by Product 2019 & 2032
- Table 22: Global Smart Learning Systems Industry Revenue Million Forecast, by End User 2019 & 2032
- Table 23: Global Smart Learning Systems Industry Revenue Million Forecast, by Country 2019 & 2032
- Table 24: Global Smart Learning Systems Industry Revenue Million Forecast, by Product 2019 & 2032
- Table 25: Global Smart Learning Systems Industry Revenue Million Forecast, by End User 2019 & 2032
- Table 26: Global Smart Learning Systems Industry Revenue Million Forecast, by Country 2019 & 2032
- Table 27: Global Smart Learning Systems Industry Revenue Million Forecast, by Product 2019 & 2032
- Table 28: Global Smart Learning Systems Industry Revenue Million Forecast, by End User 2019 & 2032
- Table 29: Global Smart Learning Systems Industry Revenue Million Forecast, by Country 2019 & 2032
Frequently Asked Questions
1. What is the projected Compound Annual Growth Rate (CAGR) of the Smart Learning Systems Industry?
The projected CAGR is approximately 22.50%.
2. Which companies are prominent players in the Smart Learning Systems Industry?
Key companies in the market include Smart Technologies Inc, Blackboard Inc, Dell EMC, Microsoft Corporation, Desire2learn, Pearson PLC, Cisco Systems Inc *List Not Exhaustive, Promethean World, Citrix Systems Inc, SAP SE, Ellucian Company.
3. What are the main segments of the Smart Learning Systems Industry?
The market segments include Product, End User.
4. Can you provide details about the market size?
The market size is estimated to be USD XX Million as of 2022.
5. What are some drivers contributing to market growth?
; Growing Adoption of Digital Learning Solutions; Growing Concept of BYOD.
6. What are the notable trends driving market growth?
Mobile Devices are Expected to Witness Significant Growth.
7. Are there any restraints impacting market growth?
; Lack of Infrastructure and Limited Awareness about E-learning.
8. Can you provide examples of recent developments in the market?
N/A
9. What pricing options are available for accessing the report?
Pricing options include single-user, multi-user, and enterprise licenses priced at USD 4750, USD 5250, and USD 8750 respectively.
10. Is the market size provided in terms of value or volume?
The market size is provided in terms of value, measured in Million.
11. Are there any specific market keywords associated with the report?
Yes, the market keyword associated with the report is "Smart Learning Systems Industry," which aids in identifying and referencing the specific market segment covered.
12. How do I determine which pricing option suits my needs best?
The pricing options vary based on user requirements and access needs. Individual users may opt for single-user licenses, while businesses requiring broader access may choose multi-user or enterprise licenses for cost-effective access to the report.
13. Are there any additional resources or data provided in the Smart Learning Systems Industry report?
While the report offers comprehensive insights, it's advisable to review the specific contents or supplementary materials provided to ascertain if additional resources or data are available.
14. How can I stay updated on further developments or reports in the Smart Learning Systems Industry?
To stay informed about further developments, trends, and reports in the Smart Learning Systems Industry, consider subscribing to industry newsletters, following relevant companies and organizations, or regularly checking reputable industry news sources and publications.
Methodology
Step 1 - Identification of Relevant Samples Size from Population Database


Step 2 - Approaches for Defining Global Market Size (Value, Volume* & Price*)

Note*: In applicable scenarios
Step 3 - Data Sources
Primary Research
- Web Analytics
- Survey Reports
- Research Institute
- Latest Research Reports
- Opinion Leaders
Secondary Research
- Annual Reports
- White Paper
- Latest Press Release
- Industry Association
- Paid Database
- Investor Presentations

Step 4 - Data Triangulation
Involves using different sources of information in order to increase the validity of a study
These sources are likely to be stakeholders in a program - participants, other researchers, program staff, other community members, and so on.
Then we put all data in single framework & apply various statistical tools to find out the dynamic on the market.
During the analysis stage, feedback from the stakeholder groups would be compared to determine areas of agreement as well as areas of divergence


