
Key Insights
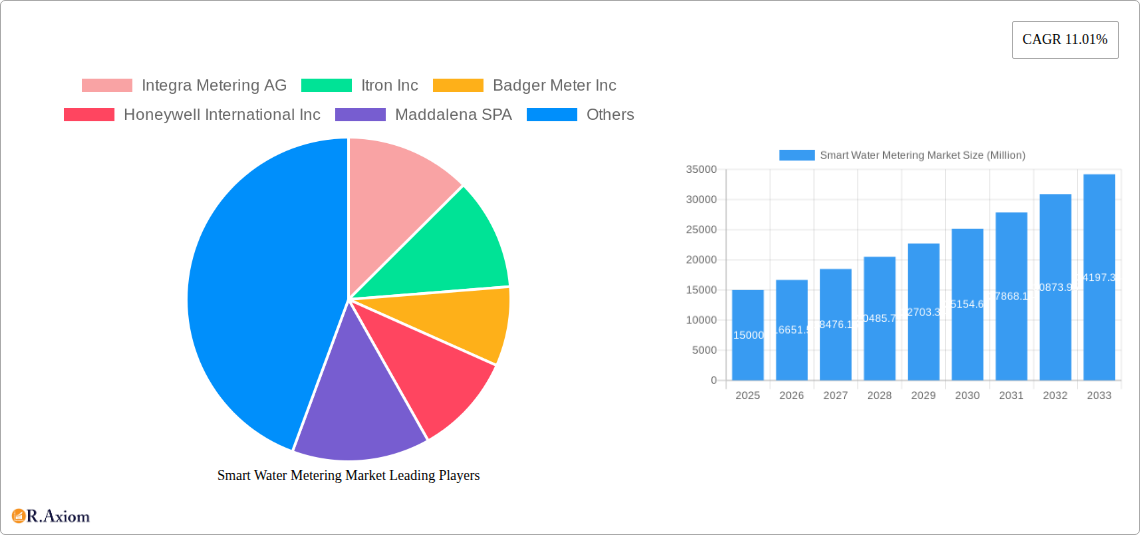
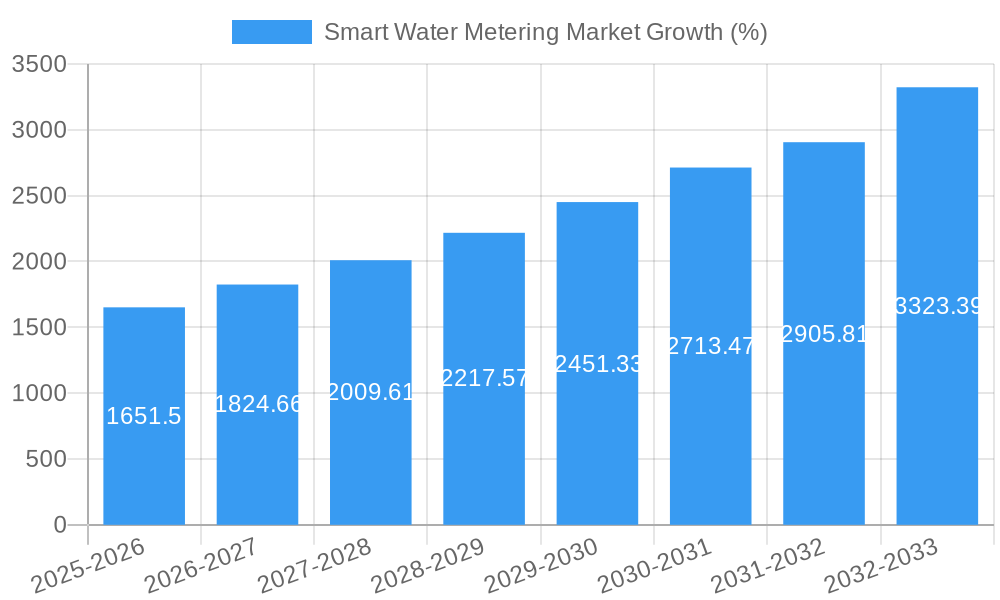
The global smart water metering market is experiencing robust growth, driven by increasing urbanization, water scarcity concerns, and the need for efficient water management. The market's Compound Annual Growth Rate (CAGR) of 11.01% from 2019 to 2024 indicates a significant upward trajectory, projected to continue throughout the forecast period (2025-2033). Key technological advancements such as Automatic Meter Reading (AMR) and Advanced Metering Infrastructure (AMI) are revolutionizing water distribution, enabling real-time data collection and analysis for improved leak detection, reduced water loss, and optimized resource allocation. The residential segment currently dominates the market due to the high number of residential water connections globally, however, the commercial and industrial segments are expected to witness significant growth fueled by increasing focus on operational efficiency and cost reduction in these sectors. Leading market players like Itron, Badger Meter, and Honeywell are investing heavily in R&D to develop innovative solutions that enhance accuracy, reliability, and data analytics capabilities. The adoption of smart water metering solutions is also being driven by government regulations and initiatives aimed at promoting water conservation and improving infrastructure efficiency in regions facing water stress.
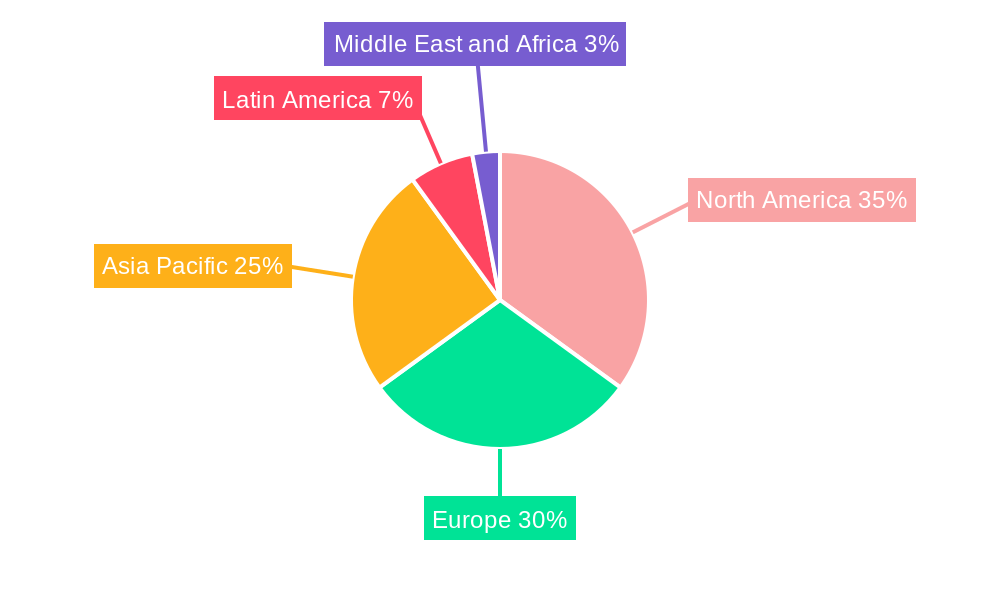
Geographic distribution reveals a diverse market landscape. North America and Europe currently hold significant market shares, owing to advanced infrastructure and early adoption of smart technologies. However, the Asia-Pacific region is poised for substantial growth due to rapid urbanization and increasing investments in water infrastructure development. Latin America and the Middle East and Africa are also expected to show increasing adoption rates, driven by rising awareness of water conservation and the need to manage limited resources effectively. The competitive landscape is characterized by the presence of both established players and emerging companies, leading to a dynamic market with continuous innovation and competition. The market’s overall growth is expected to remain strong throughout the forecast period, driven by technological innovation, supportive government policies, and rising global concerns regarding water resource management.
Smart Water Metering Market: A Comprehensive Report (2019-2033)
This detailed report provides a comprehensive analysis of the global Smart Water Metering Market, offering invaluable insights for industry stakeholders, investors, and strategic decision-makers. Covering the period from 2019 to 2033, with a focus on 2025, this report meticulously examines market dynamics, technological advancements, competitive landscapes, and future growth projections. The market is valued at xx Million in 2025 and is projected to reach xx Million by 2033, exhibiting a CAGR of xx% during the forecast period (2025-2033).
Smart Water Metering Market Market Concentration & Innovation
The Smart Water Metering market exhibits a moderately concentrated landscape, with several key players holding significant market share. While precise market share figures for individual companies are proprietary, Itron Inc, Badger Meter Inc, and Honeywell International Inc are consistently recognized as major players. The market is characterized by ongoing innovation, driven by the need for improved water management efficiency, reduced water loss, and enhanced data analytics capabilities. Regulatory frameworks mandating smart meter deployment in various regions further stimulate market growth. Product substitutes, such as traditional mechanical meters, are gradually losing ground due to the significant advantages offered by smart meters in terms of data accuracy, real-time monitoring, and leak detection. End-user trends increasingly favor advanced metering infrastructure (AMI) solutions for their comprehensive data analysis and remote management capabilities. Mergers and acquisitions (M&A) activity within the sector remains moderate, with deal values fluctuating depending on the size and strategic importance of the acquired company. For example, a recent xx Million acquisition of a smaller sensor technology company by a major player underscores the ongoing consolidation efforts within the market.
Smart Water Metering Market Industry Trends & Insights
The Smart Water Metering market is experiencing robust growth, primarily driven by increasing urbanization, growing water scarcity concerns, and the rising need for efficient water resource management. Technological disruptions, particularly in areas such as IoT integration, big data analytics, and AI-powered predictive maintenance, are revolutionizing the sector. Consumer preferences are shifting toward smart meters that provide detailed consumption data, enabling better water conservation practices. Competitive dynamics are intense, with companies focusing on product differentiation through innovative features, robust data analytics platforms, and strategic partnerships to expand their market reach. The market penetration of smart water meters varies significantly across regions, with developed nations exhibiting higher adoption rates compared to developing economies. The CAGR for the forecast period reflects this robust growth, driven by government initiatives supporting water infrastructure upgrades and growing awareness of water conservation.
Dominant Markets & Segments in Smart Water Metering Market
Leading Region: North America currently holds the dominant position in the Smart Water Metering market, driven by strong regulatory support, advanced infrastructure, and high consumer adoption rates. Europe follows closely, with significant investments in smart water management initiatives.
Dominant Country: The United States leads in terms of market size and adoption of smart water metering technologies, driven by extensive water infrastructure upgrades and the presence of major market players.
Dominant Segment (By Technology): Advanced Metering Infrastructure (AMI) is the leading technology segment, offering superior data management and remote monitoring capabilities, although Automatic Meter Reading (AMR) still holds a considerable market share due to its cost-effectiveness in simpler applications.
Dominant Segment (By Application): The residential segment represents the largest application area due to the sheer number of residential water connections. However, the commercial and industrial segments are exhibiting faster growth rates driven by the need for precise water usage monitoring and cost optimization in these sectors.
Key Drivers: Several factors contribute to the dominance of these regions and segments: robust economic policies supporting infrastructure development, supportive regulatory frameworks, government incentives for smart meter adoption, and the presence of strong technological players.
Smart Water Metering Market Product Developments
Recent product innovations focus on enhanced data analytics capabilities, improved communication technologies (e.g., narrowband IoT, LoRaWAN), and increased security features to protect against cyber threats. Smart meters are increasingly integrated with other smart city infrastructure components to create interconnected and efficient water management systems. The competitive advantage lies in offering comprehensive solutions that combine advanced hardware with powerful software analytics, allowing users to access real-time data and proactively address water management issues. These developments align directly with market needs for improved data accuracy, remote monitoring, and predictive maintenance.
Report Scope & Segmentation Analysis
This report segments the Smart Water Metering market by technology (Automatic Meter Reading and Advanced Metering Infrastructure) and application (Residential, Commercial, and Industrial).
By Technology: The AMR segment offers a cost-effective solution, while the AMI segment provides more advanced features with faster growth projected due to its data capabilities. The competitive landscape in both segments is intense, with established players and new entrants vying for market share.
By Application: The residential segment comprises the largest market share, driven by high consumer adoption, but the commercial and industrial segments are experiencing faster growth due to the focus on optimization and cost-reduction strategies. Competition in each application segment is shaped by specific customer needs and preferences.
Key Drivers of Smart Water Metering Market Growth
The growth of the smart water metering market is propelled by several key drivers:
- Increasing Water Scarcity: Global water stress is driving the need for efficient water management solutions.
- Government Regulations: Many governments are mandating or incentivizing the adoption of smart water meters.
- Technological Advancements: Improvements in communication technologies and data analytics capabilities are enhancing the functionalities of smart meters.
- Improved Infrastructure: Investment in upgrading water infrastructure is fueling the demand for smart metering systems.
Challenges in the Smart Water Metering Market Sector
Despite the market's promising outlook, several challenges hinder its growth:
- High Initial Investment Costs: The upfront investment required for deploying smart metering systems can be substantial.
- Cybersecurity Concerns: The interconnected nature of smart meters raises concerns about potential cyberattacks.
- Interoperability Issues: Lack of standardization can create interoperability challenges between different smart metering systems.
- Supply Chain Disruptions: Global events can impact the availability of components required for manufacturing smart meters.
Emerging Opportunities in Smart Water Metering Market
The smart water metering market presents numerous exciting opportunities:
- Expansion in Developing Economies: Developing countries represent significant untapped potential for smart meter adoption.
- Integration with Smart City Initiatives: Smart water metering systems can be seamlessly integrated with other smart city applications.
- Advancements in AI and Machine Learning: AI-powered analytics can enhance predictive maintenance and optimize water resource management.
- Development of New Sensor Technologies: Improved sensors can enable more accurate water usage monitoring and leak detection.
Leading Players in the Smart Water Metering Market Market
- Integra Metering AG
- Itron Inc
- Badger Meter Inc
- Honeywell International Inc
- Maddalena SPA
- Mom Zrt
- Watertech S P A (Arad Group)
- Suntront tech Co Ltd
- Kamstrup A/S
- Apator SA
- Waviot
- Arad Group
- Diehl Stiftung & Co KG
- Sensus Usa Inc (Xylem Inc )
- BETAR Company
- Axioma Metering
- Landis+GYR Group AG
- G Gioanola Srl
- Zenner International Gmbh & Co KG
Key Developments in Smart Water Metering Market Industry
- September 2023: Honeywell announced the integration of quantum computing hardware encryption keys on smart utility meters, enhancing data security against cyber threats.
- June 2023: Badger Meter partnered with the city of Savannah to implement AMI smart water meters for 10,000 customers, demonstrating increasing adoption.
Strategic Outlook for Smart Water Metering Market Market
The future of the Smart Water Metering market is exceptionally promising. Continued technological advancements, coupled with growing awareness of water conservation and increasing government support, will drive substantial market growth. Expansion into developing economies and the integration of smart meters into broader smart city infrastructure projects represent significant opportunities. Companies focusing on innovation, data analytics, and robust cybersecurity solutions are best positioned to capitalize on this market's potential for long-term growth and profitability.
Smart Water Metering Market Segmentation
-
1. Technology
- 1.1. Automatic Meter Reading
- 1.2. Advanced Metering Infrastructure
-
2. Application
- 2.1. Residential
- 2.2. Commercial
- 2.3. Industrial
Smart Water Metering Market Segmentation By Geography
- 1. North America
- 2. Europe
- 3. Asia
- 4. Australia and New Zealand
- 5. Latin America
- 6. Middle East and Africa
Smart Water Metering Market REPORT HIGHLIGHTS
| Aspects | Details |
|---|---|
| Study Period | 2019-2033 |
| Base Year | 2024 |
| Estimated Year | 2025 |
| Forecast Period | 2025-2033 |
| Historical Period | 2019-2024 |
| Growth Rate | CAGR of 11.01% from 2019-2033 |
| Segmentation |
|
Table of Contents
- 1. Introduction
- 1.1. Research Scope
- 1.2. Market Segmentation
- 1.3. Research Methodology
- 1.4. Definitions and Assumptions
- 2. Executive Summary
- 2.1. Introduction
- 3. Market Dynamics
- 3.1. Introduction
- 3.2. Market Drivers
- 3.2.1. Supportive Government Regulations; Need for Improvement in Water Utility Usage and Efficiency; Increasing Demand to Reduce Non-revenue Water Losses
- 3.3. Market Restrains
- 3.3.1. High Costs and Security Concerns; Integration Difficulties with Smart Meters; Utility Supplier Switching Costs
- 3.4. Market Trends
- 3.4.1. Residential Application Segment is Expected Hold Significant Market Share
- 4. Market Factor Analysis
- 4.1. Porters Five Forces
- 4.2. Supply/Value Chain
- 4.3. PESTEL analysis
- 4.4. Market Entropy
- 4.5. Patent/Trademark Analysis
- 5. Global Smart Water Metering Market Analysis, Insights and Forecast, 2019-2031
- 5.1. Market Analysis, Insights and Forecast - by Technology
- 5.1.1. Automatic Meter Reading
- 5.1.2. Advanced Metering Infrastructure
- 5.2. Market Analysis, Insights and Forecast - by Application
- 5.2.1. Residential
- 5.2.2. Commercial
- 5.2.3. Industrial
- 5.3. Market Analysis, Insights and Forecast - by Region
- 5.3.1. North America
- 5.3.2. Europe
- 5.3.3. Asia
- 5.3.4. Australia and New Zealand
- 5.3.5. Latin America
- 5.3.6. Middle East and Africa
- 5.1. Market Analysis, Insights and Forecast - by Technology
- 6. North America Smart Water Metering Market Analysis, Insights and Forecast, 2019-2031
- 6.1. Market Analysis, Insights and Forecast - by Technology
- 6.1.1. Automatic Meter Reading
- 6.1.2. Advanced Metering Infrastructure
- 6.2. Market Analysis, Insights and Forecast - by Application
- 6.2.1. Residential
- 6.2.2. Commercial
- 6.2.3. Industrial
- 6.1. Market Analysis, Insights and Forecast - by Technology
- 7. Europe Smart Water Metering Market Analysis, Insights and Forecast, 2019-2031
- 7.1. Market Analysis, Insights and Forecast - by Technology
- 7.1.1. Automatic Meter Reading
- 7.1.2. Advanced Metering Infrastructure
- 7.2. Market Analysis, Insights and Forecast - by Application
- 7.2.1. Residential
- 7.2.2. Commercial
- 7.2.3. Industrial
- 7.1. Market Analysis, Insights and Forecast - by Technology
- 8. Asia Smart Water Metering Market Analysis, Insights and Forecast, 2019-2031
- 8.1. Market Analysis, Insights and Forecast - by Technology
- 8.1.1. Automatic Meter Reading
- 8.1.2. Advanced Metering Infrastructure
- 8.2. Market Analysis, Insights and Forecast - by Application
- 8.2.1. Residential
- 8.2.2. Commercial
- 8.2.3. Industrial
- 8.1. Market Analysis, Insights and Forecast - by Technology
- 9. Australia and New Zealand Smart Water Metering Market Analysis, Insights and Forecast, 2019-2031
- 9.1. Market Analysis, Insights and Forecast - by Technology
- 9.1.1. Automatic Meter Reading
- 9.1.2. Advanced Metering Infrastructure
- 9.2. Market Analysis, Insights and Forecast - by Application
- 9.2.1. Residential
- 9.2.2. Commercial
- 9.2.3. Industrial
- 9.1. Market Analysis, Insights and Forecast - by Technology
- 10. Latin America Smart Water Metering Market Analysis, Insights and Forecast, 2019-2031
- 10.1. Market Analysis, Insights and Forecast - by Technology
- 10.1.1. Automatic Meter Reading
- 10.1.2. Advanced Metering Infrastructure
- 10.2. Market Analysis, Insights and Forecast - by Application
- 10.2.1. Residential
- 10.2.2. Commercial
- 10.2.3. Industrial
- 10.1. Market Analysis, Insights and Forecast - by Technology
- 11. Middle East and Africa Smart Water Metering Market Analysis, Insights and Forecast, 2019-2031
- 11.1. Market Analysis, Insights and Forecast - by Technology
- 11.1.1. Automatic Meter Reading
- 11.1.2. Advanced Metering Infrastructure
- 11.2. Market Analysis, Insights and Forecast - by Application
- 11.2.1. Residential
- 11.2.2. Commercial
- 11.2.3. Industrial
- 11.1. Market Analysis, Insights and Forecast - by Technology
- 12. North America Smart Water Metering Market Analysis, Insights and Forecast, 2019-2031
- 12.1. Market Analysis, Insights and Forecast - By Country/Sub-region
- 12.1.1.
- 13. Europe Smart Water Metering Market Analysis, Insights and Forecast, 2019-2031
- 13.1. Market Analysis, Insights and Forecast - By Country/Sub-region
- 13.1.1.
- 14. Asia Pacific Smart Water Metering Market Analysis, Insights and Forecast, 2019-2031
- 14.1. Market Analysis, Insights and Forecast - By Country/Sub-region
- 14.1.1.
- 15. Latin America Smart Water Metering Market Analysis, Insights and Forecast, 2019-2031
- 15.1. Market Analysis, Insights and Forecast - By Country/Sub-region
- 15.1.1.
- 16. Middle East and Africa Smart Water Metering Market Analysis, Insights and Forecast, 2019-2031
- 16.1. Market Analysis, Insights and Forecast - By Country/Sub-region
- 16.1.1.
- 17. Competitive Analysis
- 17.1. Global Market Share Analysis 2024
- 17.2. Company Profiles
- 17.2.1 Integra Metering AG
- 17.2.1.1. Overview
- 17.2.1.2. Products
- 17.2.1.3. SWOT Analysis
- 17.2.1.4. Recent Developments
- 17.2.1.5. Financials (Based on Availability)
- 17.2.2 Itron Inc
- 17.2.2.1. Overview
- 17.2.2.2. Products
- 17.2.2.3. SWOT Analysis
- 17.2.2.4. Recent Developments
- 17.2.2.5. Financials (Based on Availability)
- 17.2.3 Badger Meter Inc
- 17.2.3.1. Overview
- 17.2.3.2. Products
- 17.2.3.3. SWOT Analysis
- 17.2.3.4. Recent Developments
- 17.2.3.5. Financials (Based on Availability)
- 17.2.4 Honeywell International Inc
- 17.2.4.1. Overview
- 17.2.4.2. Products
- 17.2.4.3. SWOT Analysis
- 17.2.4.4. Recent Developments
- 17.2.4.5. Financials (Based on Availability)
- 17.2.5 Maddalena SPA
- 17.2.5.1. Overview
- 17.2.5.2. Products
- 17.2.5.3. SWOT Analysis
- 17.2.5.4. Recent Developments
- 17.2.5.5. Financials (Based on Availability)
- 17.2.6 Mom Zrt
- 17.2.6.1. Overview
- 17.2.6.2. Products
- 17.2.6.3. SWOT Analysis
- 17.2.6.4. Recent Developments
- 17.2.6.5. Financials (Based on Availability)
- 17.2.7 Watertech S P A (Arad Group)
- 17.2.7.1. Overview
- 17.2.7.2. Products
- 17.2.7.3. SWOT Analysis
- 17.2.7.4. Recent Developments
- 17.2.7.5. Financials (Based on Availability)
- 17.2.8 Suntront tech Co Ltd
- 17.2.8.1. Overview
- 17.2.8.2. Products
- 17.2.8.3. SWOT Analysis
- 17.2.8.4. Recent Developments
- 17.2.8.5. Financials (Based on Availability)
- 17.2.9 Kamstrup A/S
- 17.2.9.1. Overview
- 17.2.9.2. Products
- 17.2.9.3. SWOT Analysis
- 17.2.9.4. Recent Developments
- 17.2.9.5. Financials (Based on Availability)
- 17.2.10 Apator SA
- 17.2.10.1. Overview
- 17.2.10.2. Products
- 17.2.10.3. SWOT Analysis
- 17.2.10.4. Recent Developments
- 17.2.10.5. Financials (Based on Availability)
- 17.2.11 Waviot
- 17.2.11.1. Overview
- 17.2.11.2. Products
- 17.2.11.3. SWOT Analysis
- 17.2.11.4. Recent Developments
- 17.2.11.5. Financials (Based on Availability)
- 17.2.12 Arad Group
- 17.2.12.1. Overview
- 17.2.12.2. Products
- 17.2.12.3. SWOT Analysis
- 17.2.12.4. Recent Developments
- 17.2.12.5. Financials (Based on Availability)
- 17.2.13 Diehl Stiftung & Co KG
- 17.2.13.1. Overview
- 17.2.13.2. Products
- 17.2.13.3. SWOT Analysis
- 17.2.13.4. Recent Developments
- 17.2.13.5. Financials (Based on Availability)
- 17.2.14 Sensus Usa Inc (Xylem Inc )
- 17.2.14.1. Overview
- 17.2.14.2. Products
- 17.2.14.3. SWOT Analysis
- 17.2.14.4. Recent Developments
- 17.2.14.5. Financials (Based on Availability)
- 17.2.15 BETAR Company
- 17.2.15.1. Overview
- 17.2.15.2. Products
- 17.2.15.3. SWOT Analysis
- 17.2.15.4. Recent Developments
- 17.2.15.5. Financials (Based on Availability)
- 17.2.16 Axioma Metering
- 17.2.16.1. Overview
- 17.2.16.2. Products
- 17.2.16.3. SWOT Analysis
- 17.2.16.4. Recent Developments
- 17.2.16.5. Financials (Based on Availability)
- 17.2.17 Landis+GYR Group AG
- 17.2.17.1. Overview
- 17.2.17.2. Products
- 17.2.17.3. SWOT Analysis
- 17.2.17.4. Recent Developments
- 17.2.17.5. Financials (Based on Availability)
- 17.2.18 G Gioanola Srl
- 17.2.18.1. Overview
- 17.2.18.2. Products
- 17.2.18.3. SWOT Analysis
- 17.2.18.4. Recent Developments
- 17.2.18.5. Financials (Based on Availability)
- 17.2.19 Zenner International Gmbh & Co KG*List Not Exhaustive
- 17.2.19.1. Overview
- 17.2.19.2. Products
- 17.2.19.3. SWOT Analysis
- 17.2.19.4. Recent Developments
- 17.2.19.5. Financials (Based on Availability)
- 17.2.1 Integra Metering AG
List of Figures
- Figure 1: Global Smart Water Metering Market Revenue Breakdown (Million, %) by Region 2024 & 2032
- Figure 2: Global Smart Water Metering Market Volume Breakdown (Million, %) by Region 2024 & 2032
- Figure 3: North America Smart Water Metering Market Revenue (Million), by Country 2024 & 2032
- Figure 4: North America Smart Water Metering Market Volume (Million), by Country 2024 & 2032
- Figure 5: North America Smart Water Metering Market Revenue Share (%), by Country 2024 & 2032
- Figure 6: North America Smart Water Metering Market Volume Share (%), by Country 2024 & 2032
- Figure 7: Europe Smart Water Metering Market Revenue (Million), by Country 2024 & 2032
- Figure 8: Europe Smart Water Metering Market Volume (Million), by Country 2024 & 2032
- Figure 9: Europe Smart Water Metering Market Revenue Share (%), by Country 2024 & 2032
- Figure 10: Europe Smart Water Metering Market Volume Share (%), by Country 2024 & 2032
- Figure 11: Asia Pacific Smart Water Metering Market Revenue (Million), by Country 2024 & 2032
- Figure 12: Asia Pacific Smart Water Metering Market Volume (Million), by Country 2024 & 2032
- Figure 13: Asia Pacific Smart Water Metering Market Revenue Share (%), by Country 2024 & 2032
- Figure 14: Asia Pacific Smart Water Metering Market Volume Share (%), by Country 2024 & 2032
- Figure 15: Latin America Smart Water Metering Market Revenue (Million), by Country 2024 & 2032
- Figure 16: Latin America Smart Water Metering Market Volume (Million), by Country 2024 & 2032
- Figure 17: Latin America Smart Water Metering Market Revenue Share (%), by Country 2024 & 2032
- Figure 18: Latin America Smart Water Metering Market Volume Share (%), by Country 2024 & 2032
- Figure 19: Middle East and Africa Smart Water Metering Market Revenue (Million), by Country 2024 & 2032
- Figure 20: Middle East and Africa Smart Water Metering Market Volume (Million), by Country 2024 & 2032
- Figure 21: Middle East and Africa Smart Water Metering Market Revenue Share (%), by Country 2024 & 2032
- Figure 22: Middle East and Africa Smart Water Metering Market Volume Share (%), by Country 2024 & 2032
- Figure 23: North America Smart Water Metering Market Revenue (Million), by Technology 2024 & 2032
- Figure 24: North America Smart Water Metering Market Volume (Million), by Technology 2024 & 2032
- Figure 25: North America Smart Water Metering Market Revenue Share (%), by Technology 2024 & 2032
- Figure 26: North America Smart Water Metering Market Volume Share (%), by Technology 2024 & 2032
- Figure 27: North America Smart Water Metering Market Revenue (Million), by Application 2024 & 2032
- Figure 28: North America Smart Water Metering Market Volume (Million), by Application 2024 & 2032
- Figure 29: North America Smart Water Metering Market Revenue Share (%), by Application 2024 & 2032
- Figure 30: North America Smart Water Metering Market Volume Share (%), by Application 2024 & 2032
- Figure 31: North America Smart Water Metering Market Revenue (Million), by Country 2024 & 2032
- Figure 32: North America Smart Water Metering Market Volume (Million), by Country 2024 & 2032
- Figure 33: North America Smart Water Metering Market Revenue Share (%), by Country 2024 & 2032
- Figure 34: North America Smart Water Metering Market Volume Share (%), by Country 2024 & 2032
- Figure 35: Europe Smart Water Metering Market Revenue (Million), by Technology 2024 & 2032
- Figure 36: Europe Smart Water Metering Market Volume (Million), by Technology 2024 & 2032
- Figure 37: Europe Smart Water Metering Market Revenue Share (%), by Technology 2024 & 2032
- Figure 38: Europe Smart Water Metering Market Volume Share (%), by Technology 2024 & 2032
- Figure 39: Europe Smart Water Metering Market Revenue (Million), by Application 2024 & 2032
- Figure 40: Europe Smart Water Metering Market Volume (Million), by Application 2024 & 2032
- Figure 41: Europe Smart Water Metering Market Revenue Share (%), by Application 2024 & 2032
- Figure 42: Europe Smart Water Metering Market Volume Share (%), by Application 2024 & 2032
- Figure 43: Europe Smart Water Metering Market Revenue (Million), by Country 2024 & 2032
- Figure 44: Europe Smart Water Metering Market Volume (Million), by Country 2024 & 2032
- Figure 45: Europe Smart Water Metering Market Revenue Share (%), by Country 2024 & 2032
- Figure 46: Europe Smart Water Metering Market Volume Share (%), by Country 2024 & 2032
- Figure 47: Asia Smart Water Metering Market Revenue (Million), by Technology 2024 & 2032
- Figure 48: Asia Smart Water Metering Market Volume (Million), by Technology 2024 & 2032
- Figure 49: Asia Smart Water Metering Market Revenue Share (%), by Technology 2024 & 2032
- Figure 50: Asia Smart Water Metering Market Volume Share (%), by Technology 2024 & 2032
- Figure 51: Asia Smart Water Metering Market Revenue (Million), by Application 2024 & 2032
- Figure 52: Asia Smart Water Metering Market Volume (Million), by Application 2024 & 2032
- Figure 53: Asia Smart Water Metering Market Revenue Share (%), by Application 2024 & 2032
- Figure 54: Asia Smart Water Metering Market Volume Share (%), by Application 2024 & 2032
- Figure 55: Asia Smart Water Metering Market Revenue (Million), by Country 2024 & 2032
- Figure 56: Asia Smart Water Metering Market Volume (Million), by Country 2024 & 2032
- Figure 57: Asia Smart Water Metering Market Revenue Share (%), by Country 2024 & 2032
- Figure 58: Asia Smart Water Metering Market Volume Share (%), by Country 2024 & 2032
- Figure 59: Australia and New Zealand Smart Water Metering Market Revenue (Million), by Technology 2024 & 2032
- Figure 60: Australia and New Zealand Smart Water Metering Market Volume (Million), by Technology 2024 & 2032
- Figure 61: Australia and New Zealand Smart Water Metering Market Revenue Share (%), by Technology 2024 & 2032
- Figure 62: Australia and New Zealand Smart Water Metering Market Volume Share (%), by Technology 2024 & 2032
- Figure 63: Australia and New Zealand Smart Water Metering Market Revenue (Million), by Application 2024 & 2032
- Figure 64: Australia and New Zealand Smart Water Metering Market Volume (Million), by Application 2024 & 2032
- Figure 65: Australia and New Zealand Smart Water Metering Market Revenue Share (%), by Application 2024 & 2032
- Figure 66: Australia and New Zealand Smart Water Metering Market Volume Share (%), by Application 2024 & 2032
- Figure 67: Australia and New Zealand Smart Water Metering Market Revenue (Million), by Country 2024 & 2032
- Figure 68: Australia and New Zealand Smart Water Metering Market Volume (Million), by Country 2024 & 2032
- Figure 69: Australia and New Zealand Smart Water Metering Market Revenue Share (%), by Country 2024 & 2032
- Figure 70: Australia and New Zealand Smart Water Metering Market Volume Share (%), by Country 2024 & 2032
- Figure 71: Latin America Smart Water Metering Market Revenue (Million), by Technology 2024 & 2032
- Figure 72: Latin America Smart Water Metering Market Volume (Million), by Technology 2024 & 2032
- Figure 73: Latin America Smart Water Metering Market Revenue Share (%), by Technology 2024 & 2032
- Figure 74: Latin America Smart Water Metering Market Volume Share (%), by Technology 2024 & 2032
- Figure 75: Latin America Smart Water Metering Market Revenue (Million), by Application 2024 & 2032
- Figure 76: Latin America Smart Water Metering Market Volume (Million), by Application 2024 & 2032
- Figure 77: Latin America Smart Water Metering Market Revenue Share (%), by Application 2024 & 2032
- Figure 78: Latin America Smart Water Metering Market Volume Share (%), by Application 2024 & 2032
- Figure 79: Latin America Smart Water Metering Market Revenue (Million), by Country 2024 & 2032
- Figure 80: Latin America Smart Water Metering Market Volume (Million), by Country 2024 & 2032
- Figure 81: Latin America Smart Water Metering Market Revenue Share (%), by Country 2024 & 2032
- Figure 82: Latin America Smart Water Metering Market Volume Share (%), by Country 2024 & 2032
- Figure 83: Middle East and Africa Smart Water Metering Market Revenue (Million), by Technology 2024 & 2032
- Figure 84: Middle East and Africa Smart Water Metering Market Volume (Million), by Technology 2024 & 2032
- Figure 85: Middle East and Africa Smart Water Metering Market Revenue Share (%), by Technology 2024 & 2032
- Figure 86: Middle East and Africa Smart Water Metering Market Volume Share (%), by Technology 2024 & 2032
- Figure 87: Middle East and Africa Smart Water Metering Market Revenue (Million), by Application 2024 & 2032
- Figure 88: Middle East and Africa Smart Water Metering Market Volume (Million), by Application 2024 & 2032
- Figure 89: Middle East and Africa Smart Water Metering Market Revenue Share (%), by Application 2024 & 2032
- Figure 90: Middle East and Africa Smart Water Metering Market Volume Share (%), by Application 2024 & 2032
- Figure 91: Middle East and Africa Smart Water Metering Market Revenue (Million), by Country 2024 & 2032
- Figure 92: Middle East and Africa Smart Water Metering Market Volume (Million), by Country 2024 & 2032
- Figure 93: Middle East and Africa Smart Water Metering Market Revenue Share (%), by Country 2024 & 2032
- Figure 94: Middle East and Africa Smart Water Metering Market Volume Share (%), by Country 2024 & 2032
List of Tables
- Table 1: Global Smart Water Metering Market Revenue Million Forecast, by Region 2019 & 2032
- Table 2: Global Smart Water Metering Market Volume Million Forecast, by Region 2019 & 2032
- Table 3: Global Smart Water Metering Market Revenue Million Forecast, by Technology 2019 & 2032
- Table 4: Global Smart Water Metering Market Volume Million Forecast, by Technology 2019 & 2032
- Table 5: Global Smart Water Metering Market Revenue Million Forecast, by Application 2019 & 2032
- Table 6: Global Smart Water Metering Market Volume Million Forecast, by Application 2019 & 2032
- Table 7: Global Smart Water Metering Market Revenue Million Forecast, by Region 2019 & 2032
- Table 8: Global Smart Water Metering Market Volume Million Forecast, by Region 2019 & 2032
- Table 9: Global Smart Water Metering Market Revenue Million Forecast, by Country 2019 & 2032
- Table 10: Global Smart Water Metering Market Volume Million Forecast, by Country 2019 & 2032
- Table 11: Smart Water Metering Market Revenue (Million) Forecast, by Application 2019 & 2032
- Table 12: Smart Water Metering Market Volume (Million) Forecast, by Application 2019 & 2032
- Table 13: Global Smart Water Metering Market Revenue Million Forecast, by Country 2019 & 2032
- Table 14: Global Smart Water Metering Market Volume Million Forecast, by Country 2019 & 2032
- Table 15: Smart Water Metering Market Revenue (Million) Forecast, by Application 2019 & 2032
- Table 16: Smart Water Metering Market Volume (Million) Forecast, by Application 2019 & 2032
- Table 17: Global Smart Water Metering Market Revenue Million Forecast, by Country 2019 & 2032
- Table 18: Global Smart Water Metering Market Volume Million Forecast, by Country 2019 & 2032
- Table 19: Smart Water Metering Market Revenue (Million) Forecast, by Application 2019 & 2032
- Table 20: Smart Water Metering Market Volume (Million) Forecast, by Application 2019 & 2032
- Table 21: Global Smart Water Metering Market Revenue Million Forecast, by Country 2019 & 2032
- Table 22: Global Smart Water Metering Market Volume Million Forecast, by Country 2019 & 2032
- Table 23: Smart Water Metering Market Revenue (Million) Forecast, by Application 2019 & 2032
- Table 24: Smart Water Metering Market Volume (Million) Forecast, by Application 2019 & 2032
- Table 25: Global Smart Water Metering Market Revenue Million Forecast, by Country 2019 & 2032
- Table 26: Global Smart Water Metering Market Volume Million Forecast, by Country 2019 & 2032
- Table 27: Smart Water Metering Market Revenue (Million) Forecast, by Application 2019 & 2032
- Table 28: Smart Water Metering Market Volume (Million) Forecast, by Application 2019 & 2032
- Table 29: Global Smart Water Metering Market Revenue Million Forecast, by Technology 2019 & 2032
- Table 30: Global Smart Water Metering Market Volume Million Forecast, by Technology 2019 & 2032
- Table 31: Global Smart Water Metering Market Revenue Million Forecast, by Application 2019 & 2032
- Table 32: Global Smart Water Metering Market Volume Million Forecast, by Application 2019 & 2032
- Table 33: Global Smart Water Metering Market Revenue Million Forecast, by Country 2019 & 2032
- Table 34: Global Smart Water Metering Market Volume Million Forecast, by Country 2019 & 2032
- Table 35: Global Smart Water Metering Market Revenue Million Forecast, by Technology 2019 & 2032
- Table 36: Global Smart Water Metering Market Volume Million Forecast, by Technology 2019 & 2032
- Table 37: Global Smart Water Metering Market Revenue Million Forecast, by Application 2019 & 2032
- Table 38: Global Smart Water Metering Market Volume Million Forecast, by Application 2019 & 2032
- Table 39: Global Smart Water Metering Market Revenue Million Forecast, by Country 2019 & 2032
- Table 40: Global Smart Water Metering Market Volume Million Forecast, by Country 2019 & 2032
- Table 41: Global Smart Water Metering Market Revenue Million Forecast, by Technology 2019 & 2032
- Table 42: Global Smart Water Metering Market Volume Million Forecast, by Technology 2019 & 2032
- Table 43: Global Smart Water Metering Market Revenue Million Forecast, by Application 2019 & 2032
- Table 44: Global Smart Water Metering Market Volume Million Forecast, by Application 2019 & 2032
- Table 45: Global Smart Water Metering Market Revenue Million Forecast, by Country 2019 & 2032
- Table 46: Global Smart Water Metering Market Volume Million Forecast, by Country 2019 & 2032
- Table 47: Global Smart Water Metering Market Revenue Million Forecast, by Technology 2019 & 2032
- Table 48: Global Smart Water Metering Market Volume Million Forecast, by Technology 2019 & 2032
- Table 49: Global Smart Water Metering Market Revenue Million Forecast, by Application 2019 & 2032
- Table 50: Global Smart Water Metering Market Volume Million Forecast, by Application 2019 & 2032
- Table 51: Global Smart Water Metering Market Revenue Million Forecast, by Country 2019 & 2032
- Table 52: Global Smart Water Metering Market Volume Million Forecast, by Country 2019 & 2032
- Table 53: Global Smart Water Metering Market Revenue Million Forecast, by Technology 2019 & 2032
- Table 54: Global Smart Water Metering Market Volume Million Forecast, by Technology 2019 & 2032
- Table 55: Global Smart Water Metering Market Revenue Million Forecast, by Application 2019 & 2032
- Table 56: Global Smart Water Metering Market Volume Million Forecast, by Application 2019 & 2032
- Table 57: Global Smart Water Metering Market Revenue Million Forecast, by Country 2019 & 2032
- Table 58: Global Smart Water Metering Market Volume Million Forecast, by Country 2019 & 2032
- Table 59: Global Smart Water Metering Market Revenue Million Forecast, by Technology 2019 & 2032
- Table 60: Global Smart Water Metering Market Volume Million Forecast, by Technology 2019 & 2032
- Table 61: Global Smart Water Metering Market Revenue Million Forecast, by Application 2019 & 2032
- Table 62: Global Smart Water Metering Market Volume Million Forecast, by Application 2019 & 2032
- Table 63: Global Smart Water Metering Market Revenue Million Forecast, by Country 2019 & 2032
- Table 64: Global Smart Water Metering Market Volume Million Forecast, by Country 2019 & 2032
Frequently Asked Questions
1. What is the projected Compound Annual Growth Rate (CAGR) of the Smart Water Metering Market?
The projected CAGR is approximately 11.01%.
2. Which companies are prominent players in the Smart Water Metering Market?
Key companies in the market include Integra Metering AG, Itron Inc, Badger Meter Inc, Honeywell International Inc, Maddalena SPA, Mom Zrt, Watertech S P A (Arad Group), Suntront tech Co Ltd, Kamstrup A/S, Apator SA, Waviot, Arad Group, Diehl Stiftung & Co KG, Sensus Usa Inc (Xylem Inc ), BETAR Company, Axioma Metering, Landis+GYR Group AG, G Gioanola Srl, Zenner International Gmbh & Co KG*List Not Exhaustive.
3. What are the main segments of the Smart Water Metering Market?
The market segments include Technology, Application.
4. Can you provide details about the market size?
The market size is estimated to be USD XX Million as of 2022.
5. What are some drivers contributing to market growth?
Supportive Government Regulations; Need for Improvement in Water Utility Usage and Efficiency; Increasing Demand to Reduce Non-revenue Water Losses.
6. What are the notable trends driving market growth?
Residential Application Segment is Expected Hold Significant Market Share.
7. Are there any restraints impacting market growth?
High Costs and Security Concerns; Integration Difficulties with Smart Meters; Utility Supplier Switching Costs.
8. Can you provide examples of recent developments in the market?
September 2023 - Honeywell announced the integration of quantum computing hardware encryption Keys on smart utility meters to protect the end user's data from increasing cyber threats. To help strengthen reliability and trust in a digitalized energy sector, the company will use the Quantum Origin technology of Quantinuum. To ensure that natural gas, water, and electricity infrastructures are maintained for residential and commercial purposes, the enhanced security utility meter establishes a new benchmark that protects against data breaches.
9. What pricing options are available for accessing the report?
Pricing options include single-user, multi-user, and enterprise licenses priced at USD 4750, USD 5250, and USD 8750 respectively.
10. Is the market size provided in terms of value or volume?
The market size is provided in terms of value, measured in Million and volume, measured in Million.
11. Are there any specific market keywords associated with the report?
Yes, the market keyword associated with the report is "Smart Water Metering Market," which aids in identifying and referencing the specific market segment covered.
12. How do I determine which pricing option suits my needs best?
The pricing options vary based on user requirements and access needs. Individual users may opt for single-user licenses, while businesses requiring broader access may choose multi-user or enterprise licenses for cost-effective access to the report.
13. Are there any additional resources or data provided in the Smart Water Metering Market report?
While the report offers comprehensive insights, it's advisable to review the specific contents or supplementary materials provided to ascertain if additional resources or data are available.
14. How can I stay updated on further developments or reports in the Smart Water Metering Market?
To stay informed about further developments, trends, and reports in the Smart Water Metering Market, consider subscribing to industry newsletters, following relevant companies and organizations, or regularly checking reputable industry news sources and publications.
Methodology
Step 1 - Identification of Relevant Samples Size from Population Database


Step 2 - Approaches for Defining Global Market Size (Value, Volume* & Price*)

Note*: In applicable scenarios
Step 3 - Data Sources
Primary Research
- Web Analytics
- Survey Reports
- Research Institute
- Latest Research Reports
- Opinion Leaders
Secondary Research
- Annual Reports
- White Paper
- Latest Press Release
- Industry Association
- Paid Database
- Investor Presentations

Step 4 - Data Triangulation
Involves using different sources of information in order to increase the validity of a study
These sources are likely to be stakeholders in a program - participants, other researchers, program staff, other community members, and so on.
Then we put all data in single framework & apply various statistical tools to find out the dynamic on the market.
During the analysis stage, feedback from the stakeholder groups would be compared to determine areas of agreement as well as areas of divergence


