
Key Insights
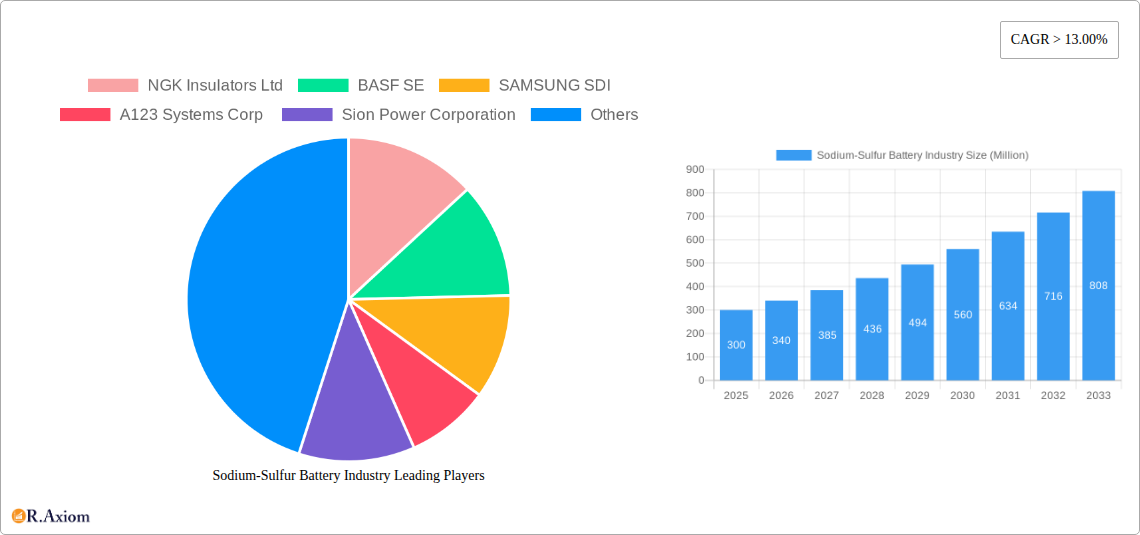
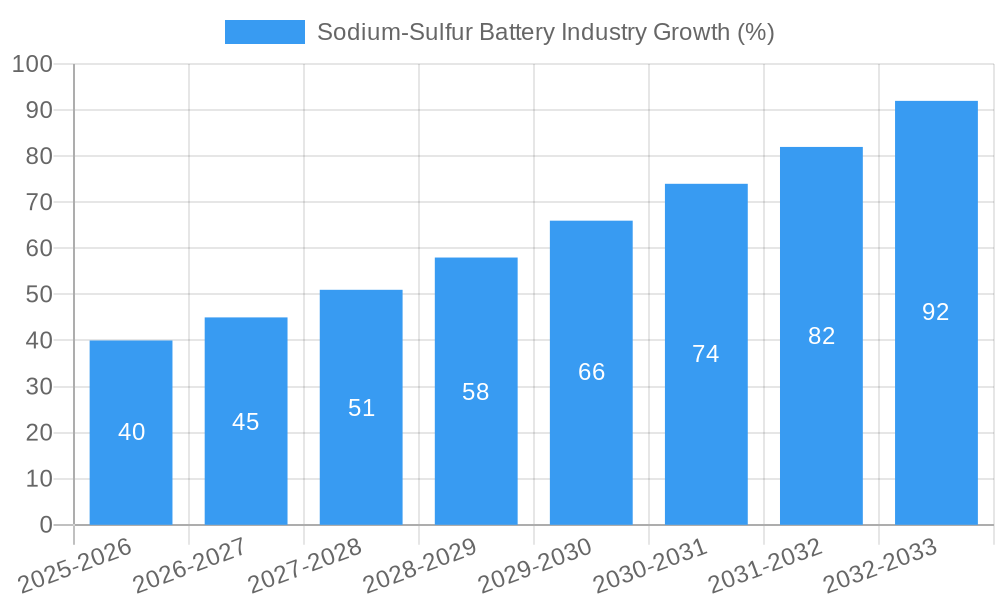
The Sodium-Sulfur (NaS) battery market is experiencing robust growth, driven by increasing demand for large-scale energy storage solutions. With a Compound Annual Growth Rate (CAGR) exceeding 13% and a current market size in the hundreds of millions of dollars (exact figure unavailable, but estimated based on comparable energy storage technologies and market trends), the NaS battery industry is poised for significant expansion over the next decade. Key drivers include the global push for renewable energy integration, necessitating effective grid stabilization and backup power solutions. The inherent advantages of NaS batteries, such as high energy density, long lifespan, and relatively low cost compared to other advanced battery technologies, are fueling their adoption in various applications. Renewable energy stabilization, particularly for wind and solar power integration, represents a major segment, alongside backup power for critical infrastructure and load leveling applications. While challenges remain, such as operational temperature requirements and the need for further technological advancements to improve safety and efficiency, the ongoing research and development efforts are steadily addressing these limitations. Significant investments from key players like NGK Insulators Ltd, BASF SE, SAMSUNG SDI, A123 Systems Corp, and Sion Power Corporation are contributing to the market's expansion, with geographic growth projected across North America, Europe, Asia-Pacific, and other regions.
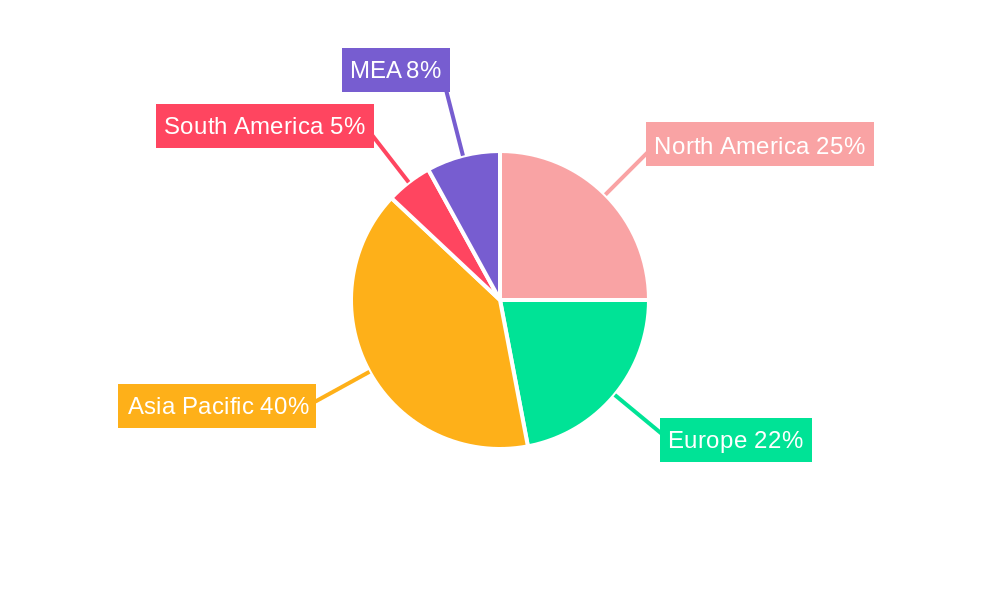
The market segmentation reveals the diverse applications of NaS batteries. Renewable energy stabilization is the leading segment, reflecting the growing need for reliable and cost-effective energy storage solutions to mitigate the intermittent nature of renewable energy sources. The backup power segment is also experiencing significant growth, driven by the increasing demand for reliable power in critical infrastructure applications such as data centers and hospitals. Load leveling applications, where NaS batteries help to balance electricity demand and supply, further contribute to market expansion. While the "other applications" segment is smaller, it holds potential for future growth as new applications for large-scale energy storage emerge. Regional analysis shows strong growth potential across all regions, with Asia-Pacific likely to emerge as a dominant market due to the significant investments in renewable energy infrastructure in countries like China, Japan, and India. The forecast period (2025-2033) paints a positive picture for the NaS battery market, promising continued growth fueled by technological advancements, supportive government policies, and the ever-increasing demand for sustainable energy solutions.
Sodium-Sulfur Battery Industry: A Comprehensive Market Report (2019-2033)
This detailed report provides a comprehensive analysis of the Sodium-Sulfur (NaS) battery industry, covering market trends, competitive landscape, technological advancements, and future growth prospects. The study period spans from 2019 to 2033, with 2025 serving as the base and estimated year. The report offers actionable insights for industry stakeholders, investors, and researchers seeking to understand and capitalize on the evolving NaS battery market. The market is projected to reach xx Million by 2033, exhibiting a CAGR of xx% during the forecast period (2025-2033).
Sodium-Sulfur Battery Industry Market Concentration & Innovation
The Sodium-Sulfur battery market exhibits a moderately concentrated landscape, with key players like NGK Insulators Ltd, BASF SE, SAMSUNG SDI, A123 Systems Corp, and Sion Power Corporation holding significant market share. However, the emergence of new entrants and technological innovations is gradually increasing competition. Market share data for 2024 indicates NGK Insulators Ltd holds approximately xx% market share, followed by BASF SE with xx%, while other players share the remaining xx%. The average M&A deal value in the industry during the historical period (2019-2024) was approximately xx Million, indicating considerable investment in the sector's growth.
Innovation in NaS battery technology is driven by the need for enhanced energy density, improved cycle life, and cost reduction. Stricter environmental regulations and the growing demand for renewable energy storage solutions are further accelerating innovation. Regulatory frameworks vary across regions, impacting the adoption rate of NaS batteries. The primary substitutes for NaS batteries include lithium-ion batteries and flow batteries, posing competitive challenges. End-user trends highlight a growing preference for high-capacity, long-life energy storage solutions, particularly in the renewable energy and grid-scale storage sectors. The increased M&A activity signifies a focus on strategic partnerships and acquisitions to accelerate technological advancements and expand market reach.
Sodium-Sulfur Battery Industry Industry Trends & Insights
The Sodium-Sulfur battery market is experiencing significant growth driven by several factors. The increasing penetration of renewable energy sources, coupled with the need for effective energy storage solutions, is a key driver. Technological advancements leading to improved energy density, cycle life, and safety are attracting significant investment and fostering market expansion. Consumer preferences are shifting towards environmentally friendly and cost-effective energy storage solutions, benefiting the adoption of NaS batteries. However, the competitive landscape is dynamic, with existing players facing pressure from new entrants and alternative technologies. The market penetration of NaS batteries is currently estimated at xx% in the global energy storage market, with projections indicating a rise to xx% by 2033. This substantial growth is primarily fueled by the falling cost of NaS battery production and improvements in its performance characteristics, resulting in a forecasted CAGR of xx% during the forecast period.
Dominant Markets & Segments in Sodium-Sulfur Battery Industry
The Asia-Pacific region currently dominates the Sodium-Sulfur battery market, driven by robust economic growth, substantial government support for renewable energy initiatives, and the increasing adoption of large-scale energy storage projects. China, in particular, is a key market due to its ambitious renewable energy targets and massive infrastructure development.
- Key Drivers in Asia-Pacific:
- Favorable government policies and subsidies promoting renewable energy adoption.
- Extensive investments in grid-scale energy storage projects.
- Rapid economic growth and industrialization driving energy demand.
Within application segments, Renewable Energy Stabilization is the leading segment, accounting for xx% of the total market share in 2024, followed by Load Leveling at xx%. This dominance is attributed to the increasing integration of intermittent renewable energy sources like solar and wind power, requiring effective storage solutions to ensure grid stability. The Back-Up Power segment holds a smaller market share, projected to increase due to growing demand for reliable backup power in various industries. The Other Applications segment encompasses niche applications and is expected to show moderate growth. The substantial growth potential of these segments is largely driven by the cost-effectiveness and long lifespan of NaS batteries compared to their counterparts.
Sodium-Sulfur Battery Industry Product Developments
Recent product innovations focus on enhancing the energy density, cycle life, and safety of NaS batteries. Manufacturers are incorporating advanced materials and manufacturing techniques to improve performance and reduce costs. The improved thermal management systems and enhanced cell designs are key advancements, making NaS batteries increasingly suitable for various applications. These advancements are also improving market fit, driving adoption in grid-scale storage, renewable energy integration, and other industrial applications.
Report Scope & Segmentation Analysis
This report segments the NaS battery market by application:
Renewable Energy Stabilization: This segment is projected to grow at a CAGR of xx% during the forecast period, driven by increasing renewable energy capacity and the need for grid stability. The competitive landscape is intense, with major players focusing on cost reduction and performance improvement.
Back-Up Power: This segment is expected to witness a CAGR of xx%, driven by the growing demand for reliable backup power in critical infrastructure and industrial settings. The market is characterized by a smaller number of players focusing on high reliability and performance.
Load Leveling: This segment is projected to grow at a CAGR of xx%, driven by the increasing adoption of large-scale energy storage systems to balance electricity supply and demand. This segment also involves intense competition, with several players striving to differentiate themselves through product features and cost-effectiveness.
Other Applications: This segment includes niche applications like electric vehicles and portable energy storage devices. The growth rate is expected to be xx% driven by ongoing research and development activities and gradual technological improvements.
Key Drivers of Sodium-Sulfur Battery Industry Growth
Several factors drive the growth of the NaS battery industry. The increasing demand for renewable energy storage is paramount, along with supportive government policies and subsidies encouraging renewable energy adoption. Technological advancements, resulting in higher energy density, longer lifespan, and improved safety, are also key drivers. Furthermore, the decreasing cost of production is making NaS batteries increasingly competitive compared to alternative technologies.
Challenges in the Sodium-Sulfur Battery Industry Sector
The NaS battery industry faces challenges, including the relatively high initial investment costs, complex manufacturing processes, and safety concerns associated with handling sodium and sulfur. Supply chain disruptions and the availability of raw materials can also impact production and profitability. Competition from other battery technologies, such as lithium-ion batteries, also poses a significant challenge. These issues collectively contribute to slower market penetration compared to other energy storage technologies. The industry’s overall development is restricted due to these factors, with a predicted growth rate that may be lower than other promising energy storage alternatives.
Emerging Opportunities in Sodium-Sulfur Battery Industry
Emerging opportunities lie in the development of advanced NaS battery chemistries with improved performance characteristics, cost-effective manufacturing processes, and safer operating conditions. New applications in areas like electric vehicles and grid-scale energy storage hold significant potential. Expansion into emerging markets and strategic partnerships with key players are also important avenues for growth and innovation.
Leading Players in the Sodium-Sulfur Battery Industry Market
- NGK Insulators Ltd
- BASF SE
- SAMSUNG SDI
- A123 Systems Corp
- Sion Power Corporation
Key Developments in Sodium-Sulfur Battery Industry Industry
- October 2021: BASF New Business (BNB) commissioned an energy storage system using four NaS battery containers at BASF's Antwerp site. This demonstrates the viability of NaS batteries in grid-scale applications.
- January 2020: BASF SE and NGK Insulators Ltd formed a strategic partnership to develop next-generation NaS batteries, leveraging their combined expertise to enhance technology and expand market reach.
Strategic Outlook for Sodium-Sulfur Battery Industry Market
The future of the NaS battery market looks promising, driven by the growing demand for large-scale energy storage and the continued improvement in NaS battery technology. The cost reduction potential, coupled with advancements in safety and performance, will drive wider adoption. Strategic partnerships and collaborations among key players will play a significant role in accelerating market growth and shaping the future of energy storage.
Sodium-Sulfur Battery Industry Segmentation
-
1. Application
- 1.1. Renewable Energy Stabilization
- 1.2. Back-Up Power
- 1.3. Load levelling
- 1.4. Other Applications
Sodium-Sulfur Battery Industry Segmentation By Geography
- 1. North America
- 2. Europe
- 3. Asia Pacific
- 4. South America
- 5. Middle East
Sodium-Sulfur Battery Industry REPORT HIGHLIGHTS
| Aspects | Details |
|---|---|
| Study Period | 2019-2033 |
| Base Year | 2024 |
| Estimated Year | 2025 |
| Forecast Period | 2025-2033 |
| Historical Period | 2019-2024 |
| Growth Rate | CAGR of > 13.00% from 2019-2033 |
| Segmentation |
|
Table of Contents
- 1. Introduction
- 1.1. Research Scope
- 1.2. Market Segmentation
- 1.3. Research Methodology
- 1.4. Definitions and Assumptions
- 2. Executive Summary
- 2.1. Introduction
- 3. Market Dynamics
- 3.1. Introduction
- 3.2. Market Drivers
- 3.2.1 4.; Increasing Amount of Waste Generation
- 3.2.2 Growing Concern for Waste Management to Meet the Needs for Sustainable Urban Living4.; Increasing Focus on Non-fossil Fuel Sources of Energy
- 3.3. Market Restrains
- 3.3.1. 4.; Expensive Nature of Incinerators
- 3.4. Market Trends
- 3.4.1. Renewable Energy Stabilization Expected to Witness Significant Growth
- 4. Market Factor Analysis
- 4.1. Porters Five Forces
- 4.2. Supply/Value Chain
- 4.3. PESTEL analysis
- 4.4. Market Entropy
- 4.5. Patent/Trademark Analysis
- 5. Global Sodium-Sulfur Battery Industry Analysis, Insights and Forecast, 2019-2031
- 5.1. Market Analysis, Insights and Forecast - by Application
- 5.1.1. Renewable Energy Stabilization
- 5.1.2. Back-Up Power
- 5.1.3. Load levelling
- 5.1.4. Other Applications
- 5.2. Market Analysis, Insights and Forecast - by Region
- 5.2.1. North America
- 5.2.2. Europe
- 5.2.3. Asia Pacific
- 5.2.4. South America
- 5.2.5. Middle East
- 5.1. Market Analysis, Insights and Forecast - by Application
- 6. North America Sodium-Sulfur Battery Industry Analysis, Insights and Forecast, 2019-2031
- 6.1. Market Analysis, Insights and Forecast - by Application
- 6.1.1. Renewable Energy Stabilization
- 6.1.2. Back-Up Power
- 6.1.3. Load levelling
- 6.1.4. Other Applications
- 6.1. Market Analysis, Insights and Forecast - by Application
- 7. Europe Sodium-Sulfur Battery Industry Analysis, Insights and Forecast, 2019-2031
- 7.1. Market Analysis, Insights and Forecast - by Application
- 7.1.1. Renewable Energy Stabilization
- 7.1.2. Back-Up Power
- 7.1.3. Load levelling
- 7.1.4. Other Applications
- 7.1. Market Analysis, Insights and Forecast - by Application
- 8. Asia Pacific Sodium-Sulfur Battery Industry Analysis, Insights and Forecast, 2019-2031
- 8.1. Market Analysis, Insights and Forecast - by Application
- 8.1.1. Renewable Energy Stabilization
- 8.1.2. Back-Up Power
- 8.1.3. Load levelling
- 8.1.4. Other Applications
- 8.1. Market Analysis, Insights and Forecast - by Application
- 9. South America Sodium-Sulfur Battery Industry Analysis, Insights and Forecast, 2019-2031
- 9.1. Market Analysis, Insights and Forecast - by Application
- 9.1.1. Renewable Energy Stabilization
- 9.1.2. Back-Up Power
- 9.1.3. Load levelling
- 9.1.4. Other Applications
- 9.1. Market Analysis, Insights and Forecast - by Application
- 10. Middle East Sodium-Sulfur Battery Industry Analysis, Insights and Forecast, 2019-2031
- 10.1. Market Analysis, Insights and Forecast - by Application
- 10.1.1. Renewable Energy Stabilization
- 10.1.2. Back-Up Power
- 10.1.3. Load levelling
- 10.1.4. Other Applications
- 10.1. Market Analysis, Insights and Forecast - by Application
- 11. North America Sodium-Sulfur Battery Industry Analysis, Insights and Forecast, 2019-2031
- 11.1. Market Analysis, Insights and Forecast - By Country/Sub-region
- 11.1.1 United States
- 11.1.2 Canada
- 11.1.3 Mexico
- 12. Europe Sodium-Sulfur Battery Industry Analysis, Insights and Forecast, 2019-2031
- 12.1. Market Analysis, Insights and Forecast - By Country/Sub-region
- 12.1.1 Germany
- 12.1.2 United Kingdom
- 12.1.3 France
- 12.1.4 Spain
- 12.1.5 Italy
- 12.1.6 Spain
- 12.1.7 Belgium
- 12.1.8 Netherland
- 12.1.9 Nordics
- 12.1.10 Rest of Europe
- 13. Asia Pacific Sodium-Sulfur Battery Industry Analysis, Insights and Forecast, 2019-2031
- 13.1. Market Analysis, Insights and Forecast - By Country/Sub-region
- 13.1.1 China
- 13.1.2 Japan
- 13.1.3 India
- 13.1.4 South Korea
- 13.1.5 Southeast Asia
- 13.1.6 Australia
- 13.1.7 Indonesia
- 13.1.8 Phillipes
- 13.1.9 Singapore
- 13.1.10 Thailandc
- 13.1.11 Rest of Asia Pacific
- 14. South America Sodium-Sulfur Battery Industry Analysis, Insights and Forecast, 2019-2031
- 14.1. Market Analysis, Insights and Forecast - By Country/Sub-region
- 14.1.1 Brazil
- 14.1.2 Argentina
- 14.1.3 Peru
- 14.1.4 Chile
- 14.1.5 Colombia
- 14.1.6 Ecuador
- 14.1.7 Venezuela
- 14.1.8 Rest of South America
- 15. MEA Sodium-Sulfur Battery Industry Analysis, Insights and Forecast, 2019-2031
- 15.1. Market Analysis, Insights and Forecast - By Country/Sub-region
- 15.1.1 United Arab Emirates
- 15.1.2 Saudi Arabia
- 15.1.3 South Africa
- 15.1.4 Rest of Middle East and Africa
- 16. Competitive Analysis
- 16.1. Global Market Share Analysis 2024
- 16.2. Company Profiles
- 16.2.1 NGK Insulators Ltd
- 16.2.1.1. Overview
- 16.2.1.2. Products
- 16.2.1.3. SWOT Analysis
- 16.2.1.4. Recent Developments
- 16.2.1.5. Financials (Based on Availability)
- 16.2.2 BASF SE
- 16.2.2.1. Overview
- 16.2.2.2. Products
- 16.2.2.3. SWOT Analysis
- 16.2.2.4. Recent Developments
- 16.2.2.5. Financials (Based on Availability)
- 16.2.3 SAMSUNG SDI
- 16.2.3.1. Overview
- 16.2.3.2. Products
- 16.2.3.3. SWOT Analysis
- 16.2.3.4. Recent Developments
- 16.2.3.5. Financials (Based on Availability)
- 16.2.4 A123 Systems Corp
- 16.2.4.1. Overview
- 16.2.4.2. Products
- 16.2.4.3. SWOT Analysis
- 16.2.4.4. Recent Developments
- 16.2.4.5. Financials (Based on Availability)
- 16.2.5 Sion Power Corporation
- 16.2.5.1. Overview
- 16.2.5.2. Products
- 16.2.5.3. SWOT Analysis
- 16.2.5.4. Recent Developments
- 16.2.5.5. Financials (Based on Availability)
- 16.2.1 NGK Insulators Ltd
List of Figures
- Figure 1: Global Sodium-Sulfur Battery Industry Revenue Breakdown (Million, %) by Region 2024 & 2032
- Figure 2: Global Sodium-Sulfur Battery Industry Volume Breakdown (K Unit, %) by Region 2024 & 2032
- Figure 3: North America Sodium-Sulfur Battery Industry Revenue (Million), by Country 2024 & 2032
- Figure 4: North America Sodium-Sulfur Battery Industry Volume (K Unit), by Country 2024 & 2032
- Figure 5: North America Sodium-Sulfur Battery Industry Revenue Share (%), by Country 2024 & 2032
- Figure 6: North America Sodium-Sulfur Battery Industry Volume Share (%), by Country 2024 & 2032
- Figure 7: Europe Sodium-Sulfur Battery Industry Revenue (Million), by Country 2024 & 2032
- Figure 8: Europe Sodium-Sulfur Battery Industry Volume (K Unit), by Country 2024 & 2032
- Figure 9: Europe Sodium-Sulfur Battery Industry Revenue Share (%), by Country 2024 & 2032
- Figure 10: Europe Sodium-Sulfur Battery Industry Volume Share (%), by Country 2024 & 2032
- Figure 11: Asia Pacific Sodium-Sulfur Battery Industry Revenue (Million), by Country 2024 & 2032
- Figure 12: Asia Pacific Sodium-Sulfur Battery Industry Volume (K Unit), by Country 2024 & 2032
- Figure 13: Asia Pacific Sodium-Sulfur Battery Industry Revenue Share (%), by Country 2024 & 2032
- Figure 14: Asia Pacific Sodium-Sulfur Battery Industry Volume Share (%), by Country 2024 & 2032
- Figure 15: South America Sodium-Sulfur Battery Industry Revenue (Million), by Country 2024 & 2032
- Figure 16: South America Sodium-Sulfur Battery Industry Volume (K Unit), by Country 2024 & 2032
- Figure 17: South America Sodium-Sulfur Battery Industry Revenue Share (%), by Country 2024 & 2032
- Figure 18: South America Sodium-Sulfur Battery Industry Volume Share (%), by Country 2024 & 2032
- Figure 19: MEA Sodium-Sulfur Battery Industry Revenue (Million), by Country 2024 & 2032
- Figure 20: MEA Sodium-Sulfur Battery Industry Volume (K Unit), by Country 2024 & 2032
- Figure 21: MEA Sodium-Sulfur Battery Industry Revenue Share (%), by Country 2024 & 2032
- Figure 22: MEA Sodium-Sulfur Battery Industry Volume Share (%), by Country 2024 & 2032
- Figure 23: North America Sodium-Sulfur Battery Industry Revenue (Million), by Application 2024 & 2032
- Figure 24: North America Sodium-Sulfur Battery Industry Volume (K Unit), by Application 2024 & 2032
- Figure 25: North America Sodium-Sulfur Battery Industry Revenue Share (%), by Application 2024 & 2032
- Figure 26: North America Sodium-Sulfur Battery Industry Volume Share (%), by Application 2024 & 2032
- Figure 27: North America Sodium-Sulfur Battery Industry Revenue (Million), by Country 2024 & 2032
- Figure 28: North America Sodium-Sulfur Battery Industry Volume (K Unit), by Country 2024 & 2032
- Figure 29: North America Sodium-Sulfur Battery Industry Revenue Share (%), by Country 2024 & 2032
- Figure 30: North America Sodium-Sulfur Battery Industry Volume Share (%), by Country 2024 & 2032
- Figure 31: Europe Sodium-Sulfur Battery Industry Revenue (Million), by Application 2024 & 2032
- Figure 32: Europe Sodium-Sulfur Battery Industry Volume (K Unit), by Application 2024 & 2032
- Figure 33: Europe Sodium-Sulfur Battery Industry Revenue Share (%), by Application 2024 & 2032
- Figure 34: Europe Sodium-Sulfur Battery Industry Volume Share (%), by Application 2024 & 2032
- Figure 35: Europe Sodium-Sulfur Battery Industry Revenue (Million), by Country 2024 & 2032
- Figure 36: Europe Sodium-Sulfur Battery Industry Volume (K Unit), by Country 2024 & 2032
- Figure 37: Europe Sodium-Sulfur Battery Industry Revenue Share (%), by Country 2024 & 2032
- Figure 38: Europe Sodium-Sulfur Battery Industry Volume Share (%), by Country 2024 & 2032
- Figure 39: Asia Pacific Sodium-Sulfur Battery Industry Revenue (Million), by Application 2024 & 2032
- Figure 40: Asia Pacific Sodium-Sulfur Battery Industry Volume (K Unit), by Application 2024 & 2032
- Figure 41: Asia Pacific Sodium-Sulfur Battery Industry Revenue Share (%), by Application 2024 & 2032
- Figure 42: Asia Pacific Sodium-Sulfur Battery Industry Volume Share (%), by Application 2024 & 2032
- Figure 43: Asia Pacific Sodium-Sulfur Battery Industry Revenue (Million), by Country 2024 & 2032
- Figure 44: Asia Pacific Sodium-Sulfur Battery Industry Volume (K Unit), by Country 2024 & 2032
- Figure 45: Asia Pacific Sodium-Sulfur Battery Industry Revenue Share (%), by Country 2024 & 2032
- Figure 46: Asia Pacific Sodium-Sulfur Battery Industry Volume Share (%), by Country 2024 & 2032
- Figure 47: South America Sodium-Sulfur Battery Industry Revenue (Million), by Application 2024 & 2032
- Figure 48: South America Sodium-Sulfur Battery Industry Volume (K Unit), by Application 2024 & 2032
- Figure 49: South America Sodium-Sulfur Battery Industry Revenue Share (%), by Application 2024 & 2032
- Figure 50: South America Sodium-Sulfur Battery Industry Volume Share (%), by Application 2024 & 2032
- Figure 51: South America Sodium-Sulfur Battery Industry Revenue (Million), by Country 2024 & 2032
- Figure 52: South America Sodium-Sulfur Battery Industry Volume (K Unit), by Country 2024 & 2032
- Figure 53: South America Sodium-Sulfur Battery Industry Revenue Share (%), by Country 2024 & 2032
- Figure 54: South America Sodium-Sulfur Battery Industry Volume Share (%), by Country 2024 & 2032
- Figure 55: Middle East Sodium-Sulfur Battery Industry Revenue (Million), by Application 2024 & 2032
- Figure 56: Middle East Sodium-Sulfur Battery Industry Volume (K Unit), by Application 2024 & 2032
- Figure 57: Middle East Sodium-Sulfur Battery Industry Revenue Share (%), by Application 2024 & 2032
- Figure 58: Middle East Sodium-Sulfur Battery Industry Volume Share (%), by Application 2024 & 2032
- Figure 59: Middle East Sodium-Sulfur Battery Industry Revenue (Million), by Country 2024 & 2032
- Figure 60: Middle East Sodium-Sulfur Battery Industry Volume (K Unit), by Country 2024 & 2032
- Figure 61: Middle East Sodium-Sulfur Battery Industry Revenue Share (%), by Country 2024 & 2032
- Figure 62: Middle East Sodium-Sulfur Battery Industry Volume Share (%), by Country 2024 & 2032
List of Tables
- Table 1: Global Sodium-Sulfur Battery Industry Revenue Million Forecast, by Region 2019 & 2032
- Table 2: Global Sodium-Sulfur Battery Industry Volume K Unit Forecast, by Region 2019 & 2032
- Table 3: Global Sodium-Sulfur Battery Industry Revenue Million Forecast, by Application 2019 & 2032
- Table 4: Global Sodium-Sulfur Battery Industry Volume K Unit Forecast, by Application 2019 & 2032
- Table 5: Global Sodium-Sulfur Battery Industry Revenue Million Forecast, by Region 2019 & 2032
- Table 6: Global Sodium-Sulfur Battery Industry Volume K Unit Forecast, by Region 2019 & 2032
- Table 7: Global Sodium-Sulfur Battery Industry Revenue Million Forecast, by Country 2019 & 2032
- Table 8: Global Sodium-Sulfur Battery Industry Volume K Unit Forecast, by Country 2019 & 2032
- Table 9: United States Sodium-Sulfur Battery Industry Revenue (Million) Forecast, by Application 2019 & 2032
- Table 10: United States Sodium-Sulfur Battery Industry Volume (K Unit) Forecast, by Application 2019 & 2032
- Table 11: Canada Sodium-Sulfur Battery Industry Revenue (Million) Forecast, by Application 2019 & 2032
- Table 12: Canada Sodium-Sulfur Battery Industry Volume (K Unit) Forecast, by Application 2019 & 2032
- Table 13: Mexico Sodium-Sulfur Battery Industry Revenue (Million) Forecast, by Application 2019 & 2032
- Table 14: Mexico Sodium-Sulfur Battery Industry Volume (K Unit) Forecast, by Application 2019 & 2032
- Table 15: Global Sodium-Sulfur Battery Industry Revenue Million Forecast, by Country 2019 & 2032
- Table 16: Global Sodium-Sulfur Battery Industry Volume K Unit Forecast, by Country 2019 & 2032
- Table 17: Germany Sodium-Sulfur Battery Industry Revenue (Million) Forecast, by Application 2019 & 2032
- Table 18: Germany Sodium-Sulfur Battery Industry Volume (K Unit) Forecast, by Application 2019 & 2032
- Table 19: United Kingdom Sodium-Sulfur Battery Industry Revenue (Million) Forecast, by Application 2019 & 2032
- Table 20: United Kingdom Sodium-Sulfur Battery Industry Volume (K Unit) Forecast, by Application 2019 & 2032
- Table 21: France Sodium-Sulfur Battery Industry Revenue (Million) Forecast, by Application 2019 & 2032
- Table 22: France Sodium-Sulfur Battery Industry Volume (K Unit) Forecast, by Application 2019 & 2032
- Table 23: Spain Sodium-Sulfur Battery Industry Revenue (Million) Forecast, by Application 2019 & 2032
- Table 24: Spain Sodium-Sulfur Battery Industry Volume (K Unit) Forecast, by Application 2019 & 2032
- Table 25: Italy Sodium-Sulfur Battery Industry Revenue (Million) Forecast, by Application 2019 & 2032
- Table 26: Italy Sodium-Sulfur Battery Industry Volume (K Unit) Forecast, by Application 2019 & 2032
- Table 27: Spain Sodium-Sulfur Battery Industry Revenue (Million) Forecast, by Application 2019 & 2032
- Table 28: Spain Sodium-Sulfur Battery Industry Volume (K Unit) Forecast, by Application 2019 & 2032
- Table 29: Belgium Sodium-Sulfur Battery Industry Revenue (Million) Forecast, by Application 2019 & 2032
- Table 30: Belgium Sodium-Sulfur Battery Industry Volume (K Unit) Forecast, by Application 2019 & 2032
- Table 31: Netherland Sodium-Sulfur Battery Industry Revenue (Million) Forecast, by Application 2019 & 2032
- Table 32: Netherland Sodium-Sulfur Battery Industry Volume (K Unit) Forecast, by Application 2019 & 2032
- Table 33: Nordics Sodium-Sulfur Battery Industry Revenue (Million) Forecast, by Application 2019 & 2032
- Table 34: Nordics Sodium-Sulfur Battery Industry Volume (K Unit) Forecast, by Application 2019 & 2032
- Table 35: Rest of Europe Sodium-Sulfur Battery Industry Revenue (Million) Forecast, by Application 2019 & 2032
- Table 36: Rest of Europe Sodium-Sulfur Battery Industry Volume (K Unit) Forecast, by Application 2019 & 2032
- Table 37: Global Sodium-Sulfur Battery Industry Revenue Million Forecast, by Country 2019 & 2032
- Table 38: Global Sodium-Sulfur Battery Industry Volume K Unit Forecast, by Country 2019 & 2032
- Table 39: China Sodium-Sulfur Battery Industry Revenue (Million) Forecast, by Application 2019 & 2032
- Table 40: China Sodium-Sulfur Battery Industry Volume (K Unit) Forecast, by Application 2019 & 2032
- Table 41: Japan Sodium-Sulfur Battery Industry Revenue (Million) Forecast, by Application 2019 & 2032
- Table 42: Japan Sodium-Sulfur Battery Industry Volume (K Unit) Forecast, by Application 2019 & 2032
- Table 43: India Sodium-Sulfur Battery Industry Revenue (Million) Forecast, by Application 2019 & 2032
- Table 44: India Sodium-Sulfur Battery Industry Volume (K Unit) Forecast, by Application 2019 & 2032
- Table 45: South Korea Sodium-Sulfur Battery Industry Revenue (Million) Forecast, by Application 2019 & 2032
- Table 46: South Korea Sodium-Sulfur Battery Industry Volume (K Unit) Forecast, by Application 2019 & 2032
- Table 47: Southeast Asia Sodium-Sulfur Battery Industry Revenue (Million) Forecast, by Application 2019 & 2032
- Table 48: Southeast Asia Sodium-Sulfur Battery Industry Volume (K Unit) Forecast, by Application 2019 & 2032
- Table 49: Australia Sodium-Sulfur Battery Industry Revenue (Million) Forecast, by Application 2019 & 2032
- Table 50: Australia Sodium-Sulfur Battery Industry Volume (K Unit) Forecast, by Application 2019 & 2032
- Table 51: Indonesia Sodium-Sulfur Battery Industry Revenue (Million) Forecast, by Application 2019 & 2032
- Table 52: Indonesia Sodium-Sulfur Battery Industry Volume (K Unit) Forecast, by Application 2019 & 2032
- Table 53: Phillipes Sodium-Sulfur Battery Industry Revenue (Million) Forecast, by Application 2019 & 2032
- Table 54: Phillipes Sodium-Sulfur Battery Industry Volume (K Unit) Forecast, by Application 2019 & 2032
- Table 55: Singapore Sodium-Sulfur Battery Industry Revenue (Million) Forecast, by Application 2019 & 2032
- Table 56: Singapore Sodium-Sulfur Battery Industry Volume (K Unit) Forecast, by Application 2019 & 2032
- Table 57: Thailandc Sodium-Sulfur Battery Industry Revenue (Million) Forecast, by Application 2019 & 2032
- Table 58: Thailandc Sodium-Sulfur Battery Industry Volume (K Unit) Forecast, by Application 2019 & 2032
- Table 59: Rest of Asia Pacific Sodium-Sulfur Battery Industry Revenue (Million) Forecast, by Application 2019 & 2032
- Table 60: Rest of Asia Pacific Sodium-Sulfur Battery Industry Volume (K Unit) Forecast, by Application 2019 & 2032
- Table 61: Global Sodium-Sulfur Battery Industry Revenue Million Forecast, by Country 2019 & 2032
- Table 62: Global Sodium-Sulfur Battery Industry Volume K Unit Forecast, by Country 2019 & 2032
- Table 63: Brazil Sodium-Sulfur Battery Industry Revenue (Million) Forecast, by Application 2019 & 2032
- Table 64: Brazil Sodium-Sulfur Battery Industry Volume (K Unit) Forecast, by Application 2019 & 2032
- Table 65: Argentina Sodium-Sulfur Battery Industry Revenue (Million) Forecast, by Application 2019 & 2032
- Table 66: Argentina Sodium-Sulfur Battery Industry Volume (K Unit) Forecast, by Application 2019 & 2032
- Table 67: Peru Sodium-Sulfur Battery Industry Revenue (Million) Forecast, by Application 2019 & 2032
- Table 68: Peru Sodium-Sulfur Battery Industry Volume (K Unit) Forecast, by Application 2019 & 2032
- Table 69: Chile Sodium-Sulfur Battery Industry Revenue (Million) Forecast, by Application 2019 & 2032
- Table 70: Chile Sodium-Sulfur Battery Industry Volume (K Unit) Forecast, by Application 2019 & 2032
- Table 71: Colombia Sodium-Sulfur Battery Industry Revenue (Million) Forecast, by Application 2019 & 2032
- Table 72: Colombia Sodium-Sulfur Battery Industry Volume (K Unit) Forecast, by Application 2019 & 2032
- Table 73: Ecuador Sodium-Sulfur Battery Industry Revenue (Million) Forecast, by Application 2019 & 2032
- Table 74: Ecuador Sodium-Sulfur Battery Industry Volume (K Unit) Forecast, by Application 2019 & 2032
- Table 75: Venezuela Sodium-Sulfur Battery Industry Revenue (Million) Forecast, by Application 2019 & 2032
- Table 76: Venezuela Sodium-Sulfur Battery Industry Volume (K Unit) Forecast, by Application 2019 & 2032
- Table 77: Rest of South America Sodium-Sulfur Battery Industry Revenue (Million) Forecast, by Application 2019 & 2032
- Table 78: Rest of South America Sodium-Sulfur Battery Industry Volume (K Unit) Forecast, by Application 2019 & 2032
- Table 79: Global Sodium-Sulfur Battery Industry Revenue Million Forecast, by Country 2019 & 2032
- Table 80: Global Sodium-Sulfur Battery Industry Volume K Unit Forecast, by Country 2019 & 2032
- Table 81: United Arab Emirates Sodium-Sulfur Battery Industry Revenue (Million) Forecast, by Application 2019 & 2032
- Table 82: United Arab Emirates Sodium-Sulfur Battery Industry Volume (K Unit) Forecast, by Application 2019 & 2032
- Table 83: Saudi Arabia Sodium-Sulfur Battery Industry Revenue (Million) Forecast, by Application 2019 & 2032
- Table 84: Saudi Arabia Sodium-Sulfur Battery Industry Volume (K Unit) Forecast, by Application 2019 & 2032
- Table 85: South Africa Sodium-Sulfur Battery Industry Revenue (Million) Forecast, by Application 2019 & 2032
- Table 86: South Africa Sodium-Sulfur Battery Industry Volume (K Unit) Forecast, by Application 2019 & 2032
- Table 87: Rest of Middle East and Africa Sodium-Sulfur Battery Industry Revenue (Million) Forecast, by Application 2019 & 2032
- Table 88: Rest of Middle East and Africa Sodium-Sulfur Battery Industry Volume (K Unit) Forecast, by Application 2019 & 2032
- Table 89: Global Sodium-Sulfur Battery Industry Revenue Million Forecast, by Application 2019 & 2032
- Table 90: Global Sodium-Sulfur Battery Industry Volume K Unit Forecast, by Application 2019 & 2032
- Table 91: Global Sodium-Sulfur Battery Industry Revenue Million Forecast, by Country 2019 & 2032
- Table 92: Global Sodium-Sulfur Battery Industry Volume K Unit Forecast, by Country 2019 & 2032
- Table 93: Global Sodium-Sulfur Battery Industry Revenue Million Forecast, by Application 2019 & 2032
- Table 94: Global Sodium-Sulfur Battery Industry Volume K Unit Forecast, by Application 2019 & 2032
- Table 95: Global Sodium-Sulfur Battery Industry Revenue Million Forecast, by Country 2019 & 2032
- Table 96: Global Sodium-Sulfur Battery Industry Volume K Unit Forecast, by Country 2019 & 2032
- Table 97: Global Sodium-Sulfur Battery Industry Revenue Million Forecast, by Application 2019 & 2032
- Table 98: Global Sodium-Sulfur Battery Industry Volume K Unit Forecast, by Application 2019 & 2032
- Table 99: Global Sodium-Sulfur Battery Industry Revenue Million Forecast, by Country 2019 & 2032
- Table 100: Global Sodium-Sulfur Battery Industry Volume K Unit Forecast, by Country 2019 & 2032
- Table 101: Global Sodium-Sulfur Battery Industry Revenue Million Forecast, by Application 2019 & 2032
- Table 102: Global Sodium-Sulfur Battery Industry Volume K Unit Forecast, by Application 2019 & 2032
- Table 103: Global Sodium-Sulfur Battery Industry Revenue Million Forecast, by Country 2019 & 2032
- Table 104: Global Sodium-Sulfur Battery Industry Volume K Unit Forecast, by Country 2019 & 2032
- Table 105: Global Sodium-Sulfur Battery Industry Revenue Million Forecast, by Application 2019 & 2032
- Table 106: Global Sodium-Sulfur Battery Industry Volume K Unit Forecast, by Application 2019 & 2032
- Table 107: Global Sodium-Sulfur Battery Industry Revenue Million Forecast, by Country 2019 & 2032
- Table 108: Global Sodium-Sulfur Battery Industry Volume K Unit Forecast, by Country 2019 & 2032
Frequently Asked Questions
1. What is the projected Compound Annual Growth Rate (CAGR) of the Sodium-Sulfur Battery Industry?
The projected CAGR is approximately > 13.00%.
2. Which companies are prominent players in the Sodium-Sulfur Battery Industry?
Key companies in the market include NGK Insulators Ltd, BASF SE, SAMSUNG SDI, A123 Systems Corp , Sion Power Corporation.
3. What are the main segments of the Sodium-Sulfur Battery Industry?
The market segments include Application.
4. Can you provide details about the market size?
The market size is estimated to be USD XX Million as of 2022.
5. What are some drivers contributing to market growth?
4.; Increasing Amount of Waste Generation. Growing Concern for Waste Management to Meet the Needs for Sustainable Urban Living4.; Increasing Focus on Non-fossil Fuel Sources of Energy.
6. What are the notable trends driving market growth?
Renewable Energy Stabilization Expected to Witness Significant Growth.
7. Are there any restraints impacting market growth?
4.; Expensive Nature of Incinerators.
8. Can you provide examples of recent developments in the market?
In October 2021, German chemicals company BASF's subsidiary BASF New Business (BNB) commissioned the energy storage system consisting of four NAS battery containers integrated into the electricity grid at BASF's Verbund site in Antwerp, Belgium.
9. What pricing options are available for accessing the report?
Pricing options include single-user, multi-user, and enterprise licenses priced at USD 4750, USD 5250, and USD 8750 respectively.
10. Is the market size provided in terms of value or volume?
The market size is provided in terms of value, measured in Million and volume, measured in K Unit.
11. Are there any specific market keywords associated with the report?
Yes, the market keyword associated with the report is "Sodium-Sulfur Battery Industry," which aids in identifying and referencing the specific market segment covered.
12. How do I determine which pricing option suits my needs best?
The pricing options vary based on user requirements and access needs. Individual users may opt for single-user licenses, while businesses requiring broader access may choose multi-user or enterprise licenses for cost-effective access to the report.
13. Are there any additional resources or data provided in the Sodium-Sulfur Battery Industry report?
While the report offers comprehensive insights, it's advisable to review the specific contents or supplementary materials provided to ascertain if additional resources or data are available.
14. How can I stay updated on further developments or reports in the Sodium-Sulfur Battery Industry?
To stay informed about further developments, trends, and reports in the Sodium-Sulfur Battery Industry, consider subscribing to industry newsletters, following relevant companies and organizations, or regularly checking reputable industry news sources and publications.
Methodology
Step 1 - Identification of Relevant Samples Size from Population Database


Step 2 - Approaches for Defining Global Market Size (Value, Volume* & Price*)

Note*: In applicable scenarios
Step 3 - Data Sources
Primary Research
- Web Analytics
- Survey Reports
- Research Institute
- Latest Research Reports
- Opinion Leaders
Secondary Research
- Annual Reports
- White Paper
- Latest Press Release
- Industry Association
- Paid Database
- Investor Presentations

Step 4 - Data Triangulation
Involves using different sources of information in order to increase the validity of a study
These sources are likely to be stakeholders in a program - participants, other researchers, program staff, other community members, and so on.
Then we put all data in single framework & apply various statistical tools to find out the dynamic on the market.
During the analysis stage, feedback from the stakeholder groups would be compared to determine areas of agreement as well as areas of divergence


