
Key Insights
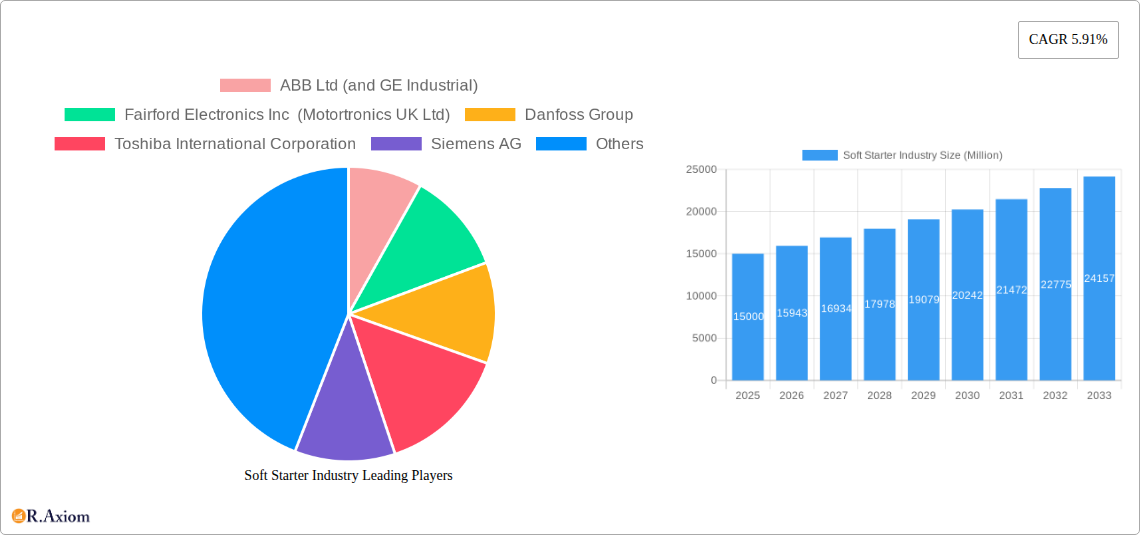
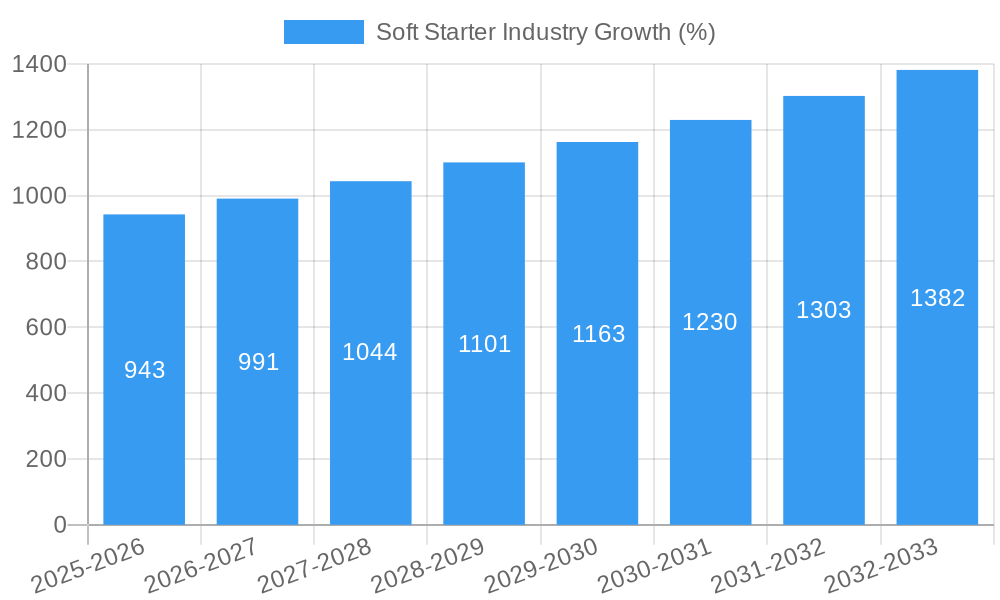
The global soft starter market, currently exhibiting a robust CAGR of 5.91%, is poised for significant growth between 2025 and 2033. Driven by increasing automation across diverse industries, particularly in mining and metals, food and beverage, energy and power, and oil and gas, the demand for soft starters is projected to rise substantially. These devices are crucial for extending the lifespan of motors and reducing energy consumption, factors that are increasingly critical in the face of rising energy costs and a global focus on sustainability. Furthermore, technological advancements leading to smaller, more efficient, and easily integrated soft starters are further fueling market expansion. Key players like ABB, Siemens, and Eaton are continuously innovating to meet evolving industry needs, driving competition and fostering technological improvements. This competitive landscape fosters innovation, resulting in more efficient and cost-effective solutions for end-users. Despite potential restraints such as high initial investment costs, the long-term benefits of reduced maintenance and energy savings outweigh these concerns, leading to sustained market growth.
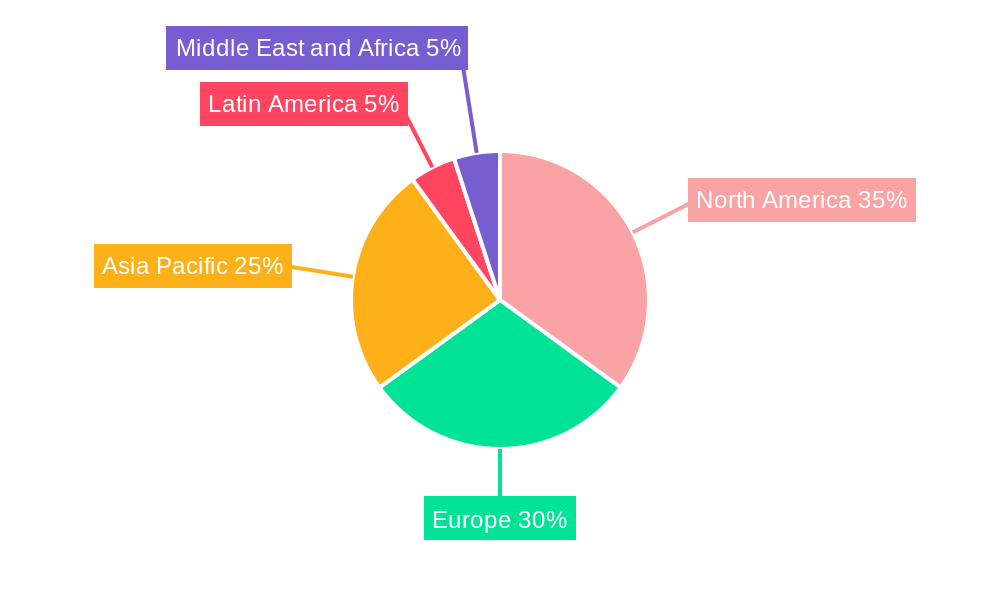
The market segmentation reveals a significant contribution from the mining and metals sector, reflecting the substantial power requirements and need for controlled motor starting in this industry. The food and beverage industry, with its stringent quality control and hygiene requirements, also presents a substantial market for soft starters, ensuring consistent and reliable operation of processing machinery. The consistent growth in the energy and power sector, fueled by renewable energy integration and modernization initiatives, creates strong demand for reliable and efficient motor control solutions, including soft starters. Geographic analysis suggests a strong presence in North America and Europe, driven by established industrial infrastructure and robust regulatory frameworks. However, the Asia-Pacific region is anticipated to witness the fastest growth in the coming years, fueled by industrialization and rapid economic development. The forecast period (2025-2033) promises substantial growth opportunities for both established players and emerging market entrants, as the need for reliable, energy-efficient motor control solutions continues to rise across various sectors globally.
This comprehensive report provides an in-depth analysis of the global soft starter industry, encompassing market size, growth drivers, competitive landscape, and future outlook. The study period covers 2019-2033, with 2025 as the base and estimated year. The forecast period is 2025-2033, and the historical period is 2019-2024. This report is crucial for industry stakeholders, investors, and businesses seeking to understand and navigate this dynamic market. The global soft starter market is projected to reach xx Million by 2033, exhibiting a robust CAGR of xx% during the forecast period.
Soft Starter Industry Market Concentration & Innovation
The soft starter industry exhibits a moderately concentrated market structure, with key players like ABB Ltd (ABB) (and GE Industrial), Danfoss Group, Siemens AG, Schneider Electric SE, and Eaton Corporation PLC holding significant market share. Market share data for 2024 indicates that ABB Ltd and Danfoss Group together hold approximately xx% of the market. Innovation is driven by the need for improved energy efficiency, enhanced control capabilities, and robust performance in demanding industrial settings. Regulatory frameworks, particularly those focused on energy conservation and environmental protection, significantly influence market growth. Product substitutes, such as variable frequency drives (VFDs), present competition, although soft starters maintain a strong position in specific applications due to their cost-effectiveness and simplicity. End-user trends towards automation and Industry 4.0 technologies are fueling demand. The past five years have witnessed several M&A activities, with deal values totaling approximately xx Million. These activities have primarily focused on expanding product portfolios and geographic reach.
- Key Players Market Share (2024, Estimated): ABB Ltd (xx%), Danfoss Group (xx%), Siemens AG (xx%), Schneider Electric SE (xx%), Eaton Corporation PLC (xx%), Others (xx%).
- M&A Activity (2019-2024): Total deal value approximately xx Million.
Soft Starter Industry Industry Trends & Insights
The soft starter market is experiencing significant growth driven by the increasing demand for energy-efficient motor control solutions across various industries. The rising adoption of automation technologies in manufacturing, particularly in emerging economies, is a primary growth catalyst. Technological disruptions, such as the development of intelligent soft starters with advanced communication capabilities and predictive maintenance features, are reshaping the competitive landscape. Consumer preferences are shifting towards energy-efficient and environmentally friendly solutions, which directly benefits the soft starter market. Competitive dynamics are characterized by intense competition among established players and the emergence of innovative startups. The market exhibits a high level of technological advancement, with ongoing development of features like improved overload protection, enhanced control algorithms, and integration with industrial automation systems. The market penetration rate for soft starters is increasing, driven by factors such as rising industrial automation and government regulations aimed at improving energy efficiency. The CAGR for the global soft starter market from 2025 to 2033 is projected to be xx%.
Dominant Markets & Segments in Soft Starter Industry
The energy and power sector is the dominant segment in the soft starter industry, accounting for approximately xx% of the total market value in 2024. Significant growth is witnessed in Asia-Pacific, driven by rapid industrialization and infrastructure development.
Key Drivers for Dominance in the Energy & Power Sector:
- Expanding Power Generation Capacity: The global push towards renewable energy and the expansion of power grids drive significant demand for soft starters in power generation and distribution systems.
- Stringent Environmental Regulations: Governments worldwide are increasingly implementing regulations to promote energy efficiency and reduce carbon emissions, leading to the greater adoption of energy-efficient motor control solutions, such as soft starters.
- Infrastructure Development: Large-scale infrastructure projects, including power plants and transmission lines, create significant demand for soft starters.
Dominance Analysis:
The dominance of the energy & power sector stems from the extensive use of large electric motors in power generation, transmission, and distribution. The high demand for reliable and efficient motor control solutions in this sector makes soft starters a critical component of modern power systems.
Other significant segments include:
- Mining and Metal: High demand for robust and reliable motor control in harsh operating environments.
- Food & Beverage: Stringent hygiene requirements and precise control needs in food processing applications.
- Oil & Gas: Demand for durable and reliable systems capable of withstanding challenging conditions.
- Other End-user Industries: Diverse applications across various sectors, including water treatment, HVAC, and material handling.
Soft Starter Industry Product Developments
Recent innovations in soft starters include the integration of advanced communication protocols like Ethernet/IP and PROFINET for seamless integration with industrial automation systems. The development of intelligent soft starters with predictive maintenance capabilities enhances operational efficiency and reduces downtime. These advancements offer competitive advantages by improving energy efficiency, extending equipment lifespan, and enhancing operational safety. The market is witnessing a shift towards compact and modular designs, allowing for easy installation and maintenance in various applications. These developments align with industry trends towards automation, digitalization, and improved energy efficiency.
Report Scope & Segmentation Analysis
This report segments the soft starter market based on end-user industry: Mining and Metal, Food & Beverage, Energy & Power, Oil & Gas, and Other End-user Industries. Each segment is analyzed based on its market size, growth rate, and competitive dynamics. The Energy & Power segment is expected to maintain its dominant position throughout the forecast period, demonstrating strong growth fueled by infrastructure development and renewable energy adoption. The Mining and Metal segment will show steady growth driven by increased mining activities worldwide. The Food & Beverage segment will also experience moderate growth due to increasing automation in the food processing industry. The Oil & Gas segment's growth will be linked to global energy demand and exploration activities. The "Other End-user Industries" segment encompasses a diverse range of applications and will show moderate growth.
Key Drivers of Soft Starter Industry Growth
The growth of the soft starter industry is primarily driven by increasing industrial automation, stringent energy efficiency regulations, and rising demand for reliable motor control solutions across various sectors. Technological advancements, such as the integration of smart sensors and predictive maintenance capabilities, further enhance the attractiveness of soft starters. Economic growth in emerging economies, coupled with significant infrastructure development projects, creates a substantial market for soft starters. Government initiatives promoting energy conservation and environmental sustainability also contribute significantly to market growth. The increasing adoption of soft starters in renewable energy applications contributes to the market's expansion.
Challenges in the Soft Starter Industry Sector
The soft starter industry faces challenges including intense competition from other motor control technologies such as Variable Frequency Drives (VFDs), which offer more precise speed control but at a higher cost. Supply chain disruptions and fluctuating raw material prices impact production costs and profitability. Stringent safety and environmental regulations increase compliance costs for manufacturers. The need for skilled workforce for installation and maintenance also poses a challenge for the market growth. These factors can collectively impede market growth if not effectively managed.
Emerging Opportunities in Soft Starter Industry
Emerging opportunities lie in the increasing adoption of soft starters in renewable energy applications, smart grids, and industrial automation systems. The development of intelligent soft starters with advanced features like predictive maintenance and remote monitoring creates new market avenues. Expansion into emerging markets with rapidly growing industrial sectors presents significant growth potential. The growing focus on energy efficiency and sustainability opens up opportunities for innovative and eco-friendly soft starter designs.
Leading Players in the Soft Starter Industry Market
- ABB Ltd (and GE Industrial)
- Fairford Electronics Inc (Motortronics UK Ltd)
- Danfoss Group
- Toshiba International Corporation
- Siemens AG
- Schneider Electric SE
- Eaton Corporation PLC
- AuCom Electronics Ltd
- Rockwell Automation Inc
- IGEL Electric GmbH
- CG Power and Industrial Solutions Ltd
Key Developments in Soft Starter Industry Industry
- 2022-Q4: ABB launches a new line of energy-efficient soft starters with enhanced communication capabilities.
- 2023-Q1: Danfoss acquires a smaller competitor, expanding its market share in the European region.
- 2023-Q3: Siemens announces a new strategic partnership with a leading industrial automation company to integrate its soft starters into advanced control systems. (Further details on specific partnerships and product launches throughout the period to be added within the full report).
Strategic Outlook for Soft Starter Industry Market
The soft starter market is poised for significant growth in the coming years driven by sustained demand across key end-user industries. Continued technological advancements, including the development of more energy-efficient and intelligent soft starters, will drive market expansion. Increased focus on sustainability and energy efficiency regulations will further fuel the demand for these solutions. Expanding into new markets and leveraging strategic partnerships will be crucial for players seeking to capitalize on emerging opportunities. The focus on improving the reliability and efficiency of industrial motor control systems will continue to be a key driver of growth.
Soft Starter Industry Segmentation
-
1. End-user Industry
- 1.1. Mining and Metal
- 1.2. Food & Beveerage
- 1.3. Energy & Power
- 1.4. Oil & Gas
- 1.5. Other End-user Industries
Soft Starter Industry Segmentation By Geography
- 1. North America
- 2. Europe
- 3. Asia Pacific
- 4. Latin America
- 5. Middle East and Africa
Soft Starter Industry REPORT HIGHLIGHTS
| Aspects | Details |
|---|---|
| Study Period | 2019-2033 |
| Base Year | 2024 |
| Estimated Year | 2025 |
| Forecast Period | 2025-2033 |
| Historical Period | 2019-2024 |
| Growth Rate | CAGR of 5.91% from 2019-2033 |
| Segmentation |
|
Table of Contents
- 1. Introduction
- 1.1. Research Scope
- 1.2. Market Segmentation
- 1.3. Research Methodology
- 1.4. Definitions and Assumptions
- 2. Executive Summary
- 2.1. Introduction
- 3. Market Dynamics
- 3.1. Introduction
- 3.2. Market Drivers
- 3.2.1. Adoption of Digitisation to Improve Production; Introduction of Cloud Technology to Consolidate Information
- 3.3. Market Restrains
- 3.3.1. High Investment and Running Costs Involved in Implementation and Upgrade of Manufacturing Execution Systems for Small-Scale Production; Lack of Awareness Regarding Benefits of MES Solutions Among SMEs
- 3.4. Market Trends
- 3.4.1. Oil and Gas Industry to Drive the Market Growth
- 4. Market Factor Analysis
- 4.1. Porters Five Forces
- 4.2. Supply/Value Chain
- 4.3. PESTEL analysis
- 4.4. Market Entropy
- 4.5. Patent/Trademark Analysis
- 5. Global Soft Starter Industry Analysis, Insights and Forecast, 2019-2031
- 5.1. Market Analysis, Insights and Forecast - by End-user Industry
- 5.1.1. Mining and Metal
- 5.1.2. Food & Beveerage
- 5.1.3. Energy & Power
- 5.1.4. Oil & Gas
- 5.1.5. Other End-user Industries
- 5.2. Market Analysis, Insights and Forecast - by Region
- 5.2.1. North America
- 5.2.2. Europe
- 5.2.3. Asia Pacific
- 5.2.4. Latin America
- 5.2.5. Middle East and Africa
- 5.1. Market Analysis, Insights and Forecast - by End-user Industry
- 6. North America Soft Starter Industry Analysis, Insights and Forecast, 2019-2031
- 6.1. Market Analysis, Insights and Forecast - by End-user Industry
- 6.1.1. Mining and Metal
- 6.1.2. Food & Beveerage
- 6.1.3. Energy & Power
- 6.1.4. Oil & Gas
- 6.1.5. Other End-user Industries
- 6.1. Market Analysis, Insights and Forecast - by End-user Industry
- 7. Europe Soft Starter Industry Analysis, Insights and Forecast, 2019-2031
- 7.1. Market Analysis, Insights and Forecast - by End-user Industry
- 7.1.1. Mining and Metal
- 7.1.2. Food & Beveerage
- 7.1.3. Energy & Power
- 7.1.4. Oil & Gas
- 7.1.5. Other End-user Industries
- 7.1. Market Analysis, Insights and Forecast - by End-user Industry
- 8. Asia Pacific Soft Starter Industry Analysis, Insights and Forecast, 2019-2031
- 8.1. Market Analysis, Insights and Forecast - by End-user Industry
- 8.1.1. Mining and Metal
- 8.1.2. Food & Beveerage
- 8.1.3. Energy & Power
- 8.1.4. Oil & Gas
- 8.1.5. Other End-user Industries
- 8.1. Market Analysis, Insights and Forecast - by End-user Industry
- 9. Latin America Soft Starter Industry Analysis, Insights and Forecast, 2019-2031
- 9.1. Market Analysis, Insights and Forecast - by End-user Industry
- 9.1.1. Mining and Metal
- 9.1.2. Food & Beveerage
- 9.1.3. Energy & Power
- 9.1.4. Oil & Gas
- 9.1.5. Other End-user Industries
- 9.1. Market Analysis, Insights and Forecast - by End-user Industry
- 10. Middle East and Africa Soft Starter Industry Analysis, Insights and Forecast, 2019-2031
- 10.1. Market Analysis, Insights and Forecast - by End-user Industry
- 10.1.1. Mining and Metal
- 10.1.2. Food & Beveerage
- 10.1.3. Energy & Power
- 10.1.4. Oil & Gas
- 10.1.5. Other End-user Industries
- 10.1. Market Analysis, Insights and Forecast - by End-user Industry
- 11. North America Soft Starter Industry Analysis, Insights and Forecast, 2019-2031
- 11.1. Market Analysis, Insights and Forecast - By Country/Sub-region
- 11.1.1.
- 12. Europe Soft Starter Industry Analysis, Insights and Forecast, 2019-2031
- 12.1. Market Analysis, Insights and Forecast - By Country/Sub-region
- 12.1.1.
- 13. Asia Pacific Soft Starter Industry Analysis, Insights and Forecast, 2019-2031
- 13.1. Market Analysis, Insights and Forecast - By Country/Sub-region
- 13.1.1.
- 14. Latin America Soft Starter Industry Analysis, Insights and Forecast, 2019-2031
- 14.1. Market Analysis, Insights and Forecast - By Country/Sub-region
- 14.1.1.
- 15. Middle East and Africa Soft Starter Industry Analysis, Insights and Forecast, 2019-2031
- 15.1. Market Analysis, Insights and Forecast - By Country/Sub-region
- 15.1.1.
- 16. Competitive Analysis
- 16.1. Global Market Share Analysis 2024
- 16.2. Company Profiles
- 16.2.1 ABB Ltd (and GE Industrial)
- 16.2.1.1. Overview
- 16.2.1.2. Products
- 16.2.1.3. SWOT Analysis
- 16.2.1.4. Recent Developments
- 16.2.1.5. Financials (Based on Availability)
- 16.2.2 Fairford Electronics Inc (Motortronics UK Ltd)
- 16.2.2.1. Overview
- 16.2.2.2. Products
- 16.2.2.3. SWOT Analysis
- 16.2.2.4. Recent Developments
- 16.2.2.5. Financials (Based on Availability)
- 16.2.3 Danfoss Group
- 16.2.3.1. Overview
- 16.2.3.2. Products
- 16.2.3.3. SWOT Analysis
- 16.2.3.4. Recent Developments
- 16.2.3.5. Financials (Based on Availability)
- 16.2.4 Toshiba International Corporation
- 16.2.4.1. Overview
- 16.2.4.2. Products
- 16.2.4.3. SWOT Analysis
- 16.2.4.4. Recent Developments
- 16.2.4.5. Financials (Based on Availability)
- 16.2.5 Siemens AG
- 16.2.5.1. Overview
- 16.2.5.2. Products
- 16.2.5.3. SWOT Analysis
- 16.2.5.4. Recent Developments
- 16.2.5.5. Financials (Based on Availability)
- 16.2.6 Schneider Electric SE
- 16.2.6.1. Overview
- 16.2.6.2. Products
- 16.2.6.3. SWOT Analysis
- 16.2.6.4. Recent Developments
- 16.2.6.5. Financials (Based on Availability)
- 16.2.7 Eaton Corporation PLC
- 16.2.7.1. Overview
- 16.2.7.2. Products
- 16.2.7.3. SWOT Analysis
- 16.2.7.4. Recent Developments
- 16.2.7.5. Financials (Based on Availability)
- 16.2.8 AuCom Electronics Ltd*List Not Exhaustive
- 16.2.8.1. Overview
- 16.2.8.2. Products
- 16.2.8.3. SWOT Analysis
- 16.2.8.4. Recent Developments
- 16.2.8.5. Financials (Based on Availability)
- 16.2.9 Rockwell Automation Inc
- 16.2.9.1. Overview
- 16.2.9.2. Products
- 16.2.9.3. SWOT Analysis
- 16.2.9.4. Recent Developments
- 16.2.9.5. Financials (Based on Availability)
- 16.2.10 IGEL Electric GmbH
- 16.2.10.1. Overview
- 16.2.10.2. Products
- 16.2.10.3. SWOT Analysis
- 16.2.10.4. Recent Developments
- 16.2.10.5. Financials (Based on Availability)
- 16.2.11 CG Power and Industrial Solutions Ltd
- 16.2.11.1. Overview
- 16.2.11.2. Products
- 16.2.11.3. SWOT Analysis
- 16.2.11.4. Recent Developments
- 16.2.11.5. Financials (Based on Availability)
- 16.2.1 ABB Ltd (and GE Industrial)
List of Figures
- Figure 1: Global Soft Starter Industry Revenue Breakdown (Million, %) by Region 2024 & 2032
- Figure 2: North America Soft Starter Industry Revenue (Million), by Country 2024 & 2032
- Figure 3: North America Soft Starter Industry Revenue Share (%), by Country 2024 & 2032
- Figure 4: Europe Soft Starter Industry Revenue (Million), by Country 2024 & 2032
- Figure 5: Europe Soft Starter Industry Revenue Share (%), by Country 2024 & 2032
- Figure 6: Asia Pacific Soft Starter Industry Revenue (Million), by Country 2024 & 2032
- Figure 7: Asia Pacific Soft Starter Industry Revenue Share (%), by Country 2024 & 2032
- Figure 8: Latin America Soft Starter Industry Revenue (Million), by Country 2024 & 2032
- Figure 9: Latin America Soft Starter Industry Revenue Share (%), by Country 2024 & 2032
- Figure 10: Middle East and Africa Soft Starter Industry Revenue (Million), by Country 2024 & 2032
- Figure 11: Middle East and Africa Soft Starter Industry Revenue Share (%), by Country 2024 & 2032
- Figure 12: North America Soft Starter Industry Revenue (Million), by End-user Industry 2024 & 2032
- Figure 13: North America Soft Starter Industry Revenue Share (%), by End-user Industry 2024 & 2032
- Figure 14: North America Soft Starter Industry Revenue (Million), by Country 2024 & 2032
- Figure 15: North America Soft Starter Industry Revenue Share (%), by Country 2024 & 2032
- Figure 16: Europe Soft Starter Industry Revenue (Million), by End-user Industry 2024 & 2032
- Figure 17: Europe Soft Starter Industry Revenue Share (%), by End-user Industry 2024 & 2032
- Figure 18: Europe Soft Starter Industry Revenue (Million), by Country 2024 & 2032
- Figure 19: Europe Soft Starter Industry Revenue Share (%), by Country 2024 & 2032
- Figure 20: Asia Pacific Soft Starter Industry Revenue (Million), by End-user Industry 2024 & 2032
- Figure 21: Asia Pacific Soft Starter Industry Revenue Share (%), by End-user Industry 2024 & 2032
- Figure 22: Asia Pacific Soft Starter Industry Revenue (Million), by Country 2024 & 2032
- Figure 23: Asia Pacific Soft Starter Industry Revenue Share (%), by Country 2024 & 2032
- Figure 24: Latin America Soft Starter Industry Revenue (Million), by End-user Industry 2024 & 2032
- Figure 25: Latin America Soft Starter Industry Revenue Share (%), by End-user Industry 2024 & 2032
- Figure 26: Latin America Soft Starter Industry Revenue (Million), by Country 2024 & 2032
- Figure 27: Latin America Soft Starter Industry Revenue Share (%), by Country 2024 & 2032
- Figure 28: Middle East and Africa Soft Starter Industry Revenue (Million), by End-user Industry 2024 & 2032
- Figure 29: Middle East and Africa Soft Starter Industry Revenue Share (%), by End-user Industry 2024 & 2032
- Figure 30: Middle East and Africa Soft Starter Industry Revenue (Million), by Country 2024 & 2032
- Figure 31: Middle East and Africa Soft Starter Industry Revenue Share (%), by Country 2024 & 2032
List of Tables
- Table 1: Global Soft Starter Industry Revenue Million Forecast, by Region 2019 & 2032
- Table 2: Global Soft Starter Industry Revenue Million Forecast, by End-user Industry 2019 & 2032
- Table 3: Global Soft Starter Industry Revenue Million Forecast, by Region 2019 & 2032
- Table 4: Global Soft Starter Industry Revenue Million Forecast, by Country 2019 & 2032
- Table 5: Soft Starter Industry Revenue (Million) Forecast, by Application 2019 & 2032
- Table 6: Global Soft Starter Industry Revenue Million Forecast, by Country 2019 & 2032
- Table 7: Soft Starter Industry Revenue (Million) Forecast, by Application 2019 & 2032
- Table 8: Global Soft Starter Industry Revenue Million Forecast, by Country 2019 & 2032
- Table 9: Soft Starter Industry Revenue (Million) Forecast, by Application 2019 & 2032
- Table 10: Global Soft Starter Industry Revenue Million Forecast, by Country 2019 & 2032
- Table 11: Soft Starter Industry Revenue (Million) Forecast, by Application 2019 & 2032
- Table 12: Global Soft Starter Industry Revenue Million Forecast, by Country 2019 & 2032
- Table 13: Soft Starter Industry Revenue (Million) Forecast, by Application 2019 & 2032
- Table 14: Global Soft Starter Industry Revenue Million Forecast, by End-user Industry 2019 & 2032
- Table 15: Global Soft Starter Industry Revenue Million Forecast, by Country 2019 & 2032
- Table 16: Global Soft Starter Industry Revenue Million Forecast, by End-user Industry 2019 & 2032
- Table 17: Global Soft Starter Industry Revenue Million Forecast, by Country 2019 & 2032
- Table 18: Global Soft Starter Industry Revenue Million Forecast, by End-user Industry 2019 & 2032
- Table 19: Global Soft Starter Industry Revenue Million Forecast, by Country 2019 & 2032
- Table 20: Global Soft Starter Industry Revenue Million Forecast, by End-user Industry 2019 & 2032
- Table 21: Global Soft Starter Industry Revenue Million Forecast, by Country 2019 & 2032
- Table 22: Global Soft Starter Industry Revenue Million Forecast, by End-user Industry 2019 & 2032
- Table 23: Global Soft Starter Industry Revenue Million Forecast, by Country 2019 & 2032
Frequently Asked Questions
1. What is the projected Compound Annual Growth Rate (CAGR) of the Soft Starter Industry?
The projected CAGR is approximately 5.91%.
2. Which companies are prominent players in the Soft Starter Industry?
Key companies in the market include ABB Ltd (and GE Industrial), Fairford Electronics Inc (Motortronics UK Ltd), Danfoss Group, Toshiba International Corporation, Siemens AG, Schneider Electric SE, Eaton Corporation PLC, AuCom Electronics Ltd*List Not Exhaustive, Rockwell Automation Inc, IGEL Electric GmbH, CG Power and Industrial Solutions Ltd.
3. What are the main segments of the Soft Starter Industry?
The market segments include End-user Industry.
4. Can you provide details about the market size?
The market size is estimated to be USD XX Million as of 2022.
5. What are some drivers contributing to market growth?
Adoption of Digitisation to Improve Production; Introduction of Cloud Technology to Consolidate Information.
6. What are the notable trends driving market growth?
Oil and Gas Industry to Drive the Market Growth.
7. Are there any restraints impacting market growth?
High Investment and Running Costs Involved in Implementation and Upgrade of Manufacturing Execution Systems for Small-Scale Production; Lack of Awareness Regarding Benefits of MES Solutions Among SMEs.
8. Can you provide examples of recent developments in the market?
N/A
9. What pricing options are available for accessing the report?
Pricing options include single-user, multi-user, and enterprise licenses priced at USD 4750, USD 5250, and USD 8750 respectively.
10. Is the market size provided in terms of value or volume?
The market size is provided in terms of value, measured in Million.
11. Are there any specific market keywords associated with the report?
Yes, the market keyword associated with the report is "Soft Starter Industry," which aids in identifying and referencing the specific market segment covered.
12. How do I determine which pricing option suits my needs best?
The pricing options vary based on user requirements and access needs. Individual users may opt for single-user licenses, while businesses requiring broader access may choose multi-user or enterprise licenses for cost-effective access to the report.
13. Are there any additional resources or data provided in the Soft Starter Industry report?
While the report offers comprehensive insights, it's advisable to review the specific contents or supplementary materials provided to ascertain if additional resources or data are available.
14. How can I stay updated on further developments or reports in the Soft Starter Industry?
To stay informed about further developments, trends, and reports in the Soft Starter Industry, consider subscribing to industry newsletters, following relevant companies and organizations, or regularly checking reputable industry news sources and publications.
Methodology
Step 1 - Identification of Relevant Samples Size from Population Database


Step 2 - Approaches for Defining Global Market Size (Value, Volume* & Price*)

Note*: In applicable scenarios
Step 3 - Data Sources
Primary Research
- Web Analytics
- Survey Reports
- Research Institute
- Latest Research Reports
- Opinion Leaders
Secondary Research
- Annual Reports
- White Paper
- Latest Press Release
- Industry Association
- Paid Database
- Investor Presentations

Step 4 - Data Triangulation
Involves using different sources of information in order to increase the validity of a study
These sources are likely to be stakeholders in a program - participants, other researchers, program staff, other community members, and so on.
Then we put all data in single framework & apply various statistical tools to find out the dynamic on the market.
During the analysis stage, feedback from the stakeholder groups would be compared to determine areas of agreement as well as areas of divergence


