
Key Insights
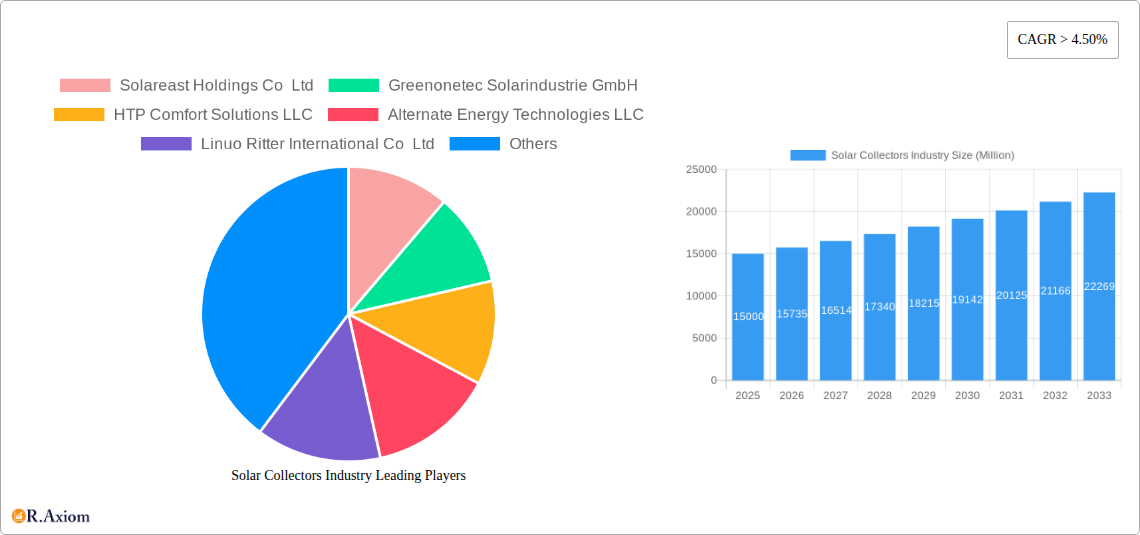
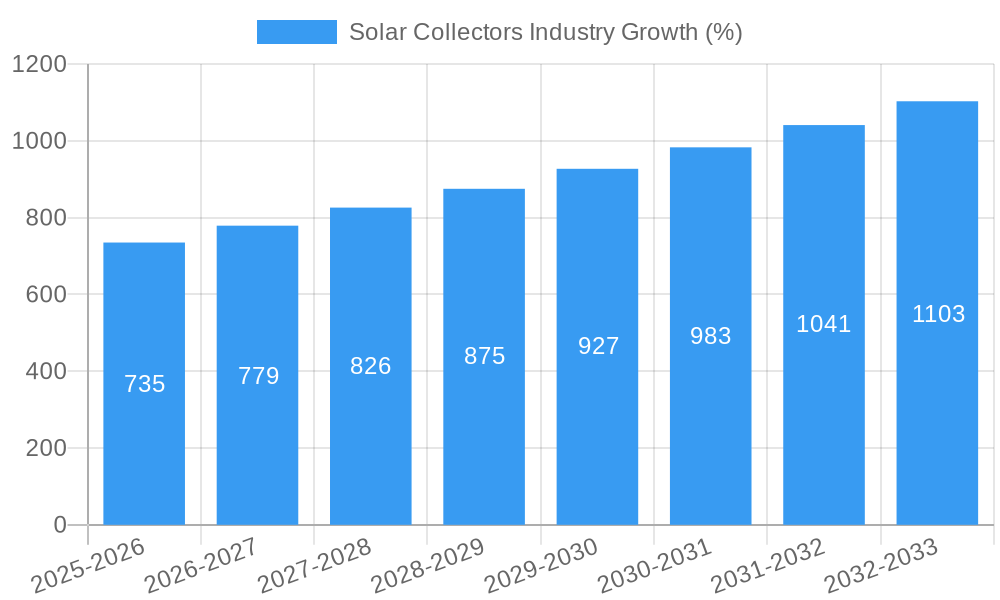
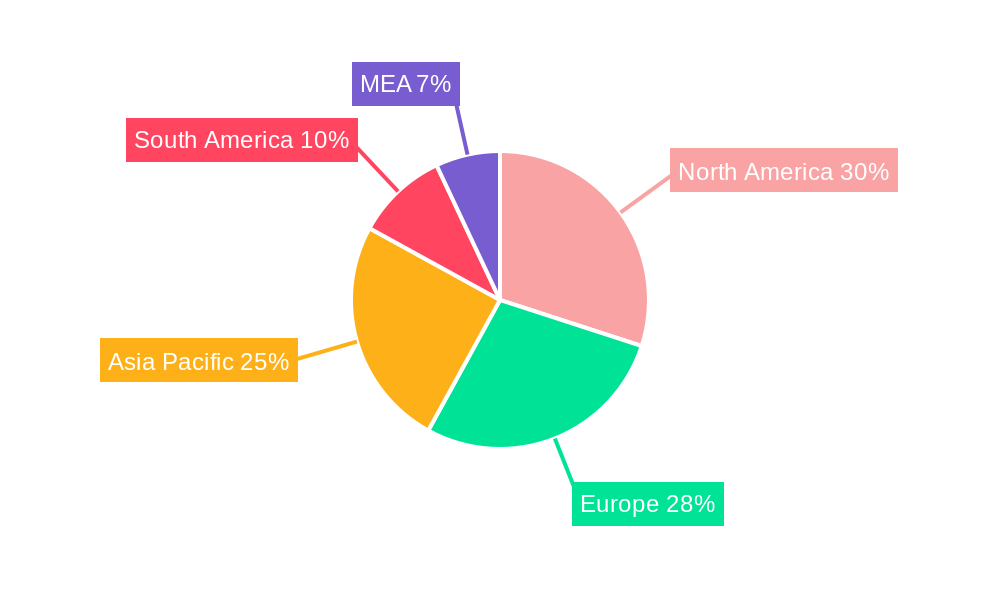
The global solar collector market is experiencing robust growth, projected to maintain a Compound Annual Growth Rate (CAGR) exceeding 4.50% from 2025 to 2033. This expansion is fueled by several key drivers. Increasing concerns about climate change and the urgent need for sustainable energy solutions are driving significant government investments and policy support for renewable energy technologies, including solar thermal systems. Furthermore, the declining cost of solar collectors, coupled with advancements in technology leading to improved efficiency and durability, is making them a more attractive and economically viable option for residential, commercial, and industrial applications. The growing demand for hot water and space heating in both developed and developing economies is further boosting market adoption. Market segmentation reveals a strong preference for glazed collectors due to their higher efficiency, although unglazed collectors maintain a significant market share, particularly in applications where cost is a primary consideration. The residential segment currently dominates the market, however, the commercial and industrial sectors are showing significant potential for growth, driven by large-scale energy needs and cost-saving opportunities. Geographic distribution shows strong growth across North America, Europe, and the Asia-Pacific region, with China and the United States representing key markets. However, emerging economies in South America and the Middle East and Africa are also exhibiting rising demand, presenting lucrative opportunities for market expansion in the coming years.
Despite the positive outlook, several restraining factors influence market growth. Initial high capital investment costs can deter some consumers and businesses. Intermittency of solar radiation, particularly in regions with less sunlight, poses a challenge. Furthermore, the reliance on certain raw materials for manufacturing and potential supply chain disruptions can affect production and market stability. However, ongoing innovation in solar collector technology, including the development of hybrid systems and advanced energy storage solutions, is mitigating some of these challenges. Companies like Solareast Holdings Co Ltd, Greenonetec Solarindustrie GmbH, and others are actively involved in pushing technological advancements and expanding market reach. The continued focus on sustainability, coupled with supportive government policies and technological innovation, is poised to drive sustained growth in the solar collector market throughout the forecast period.
Solar Collectors Industry: A Comprehensive Market Report (2019-2033)
This comprehensive report provides a detailed analysis of the global solar collectors industry, offering invaluable insights for stakeholders, investors, and industry professionals. Covering the period 2019-2033, with a focus on 2025, this report examines market trends, competitive dynamics, technological advancements, and future growth potential. The market size is projected to reach xx Million by 2033, exhibiting a CAGR of xx% during the forecast period (2025-2033).
Solar Collectors Industry Market Concentration & Innovation
The solar collectors market exhibits a moderately concentrated landscape, with key players like Solareast Holdings Co Ltd, Greenonetec Solarindustrie GmbH, HTP Comfort Solutions LLC, Alternate Energy Technologies LLC, Linuo Ritter International Co Ltd, Aalborg CSP AS, BTE solar Co Ltd, Photon Energy Systems Limited, Viessmann Manufacturing Company Inc, and Savosolar Oyj holding significant market share. However, the presence of numerous smaller players and emerging startups indicates a dynamic competitive environment. The collective market share of the top five companies is estimated at xx%, indicating moderate concentration. M&A activity in the sector has been relatively moderate in recent years, with deal values totaling approximately xx Million between 2019 and 2024. Innovation is primarily driven by improvements in collector efficiency, durability, and cost-effectiveness, along with the development of integrated solar thermal systems. Stringent environmental regulations and government incentives are further boosting innovation and market growth. Product substitutes, primarily conventional heating systems, face increasing competition due to the rising awareness of environmental sustainability and decreasing solar energy costs. End-user trends favor integrated solutions that offer both energy efficiency and aesthetic appeal, driving demand for sleek, customized systems for residential and commercial applications.
Solar Collectors Industry Industry Trends & Insights
The solar collectors market is experiencing robust growth, driven by increasing energy demands, rising energy prices, and growing environmental concerns. The global shift towards renewable energy sources is a major catalyst, with governments worldwide implementing supportive policies and incentives to promote solar energy adoption. Technological advancements, such as the development of high-efficiency collectors and improved thermal storage solutions, are enhancing the market attractiveness. Consumer preferences are shifting towards aesthetically pleasing, easy-to-install, and energy-efficient systems. Competitive dynamics are characterized by intense competition among established players and emerging companies, leading to price reductions and technological innovations. The market is witnessing a notable shift towards specialized applications, particularly in industrial processes requiring high-temperature heat. The CAGR for the period 2019-2024 is estimated at xx%, and market penetration in key regions is steadily increasing.
Dominant Markets & Segments in Solar Collectors Industry
- Dominant Region: Europe holds a dominant position in the solar collectors market, driven by strong government support, mature infrastructure, and high energy costs. China and other parts of Asia are also experiencing significant growth.
- Dominant Collector Type: Glazed collectors hold a larger market share compared to unglazed collectors due to higher efficiency and durability. However, unglazed collectors offer cost advantages, leading to their increased adoption in specific applications.
- Dominant Application: The commercial sector is currently the largest consumer of solar collectors, followed by the industrial and residential sectors. The industrial segment is experiencing rapid growth due to the rising demand for process heat in various manufacturing processes.
- Key Drivers:
- Europe: Stringent environmental regulations, supportive government policies, and high energy prices.
- China: Large-scale government investments, growing industrialization, and a focus on renewable energy targets.
- Residential: Increasing awareness of energy costs and environmental concerns; government incentives.
- Commercial: Growing energy demand, emphasis on corporate sustainability, and decreasing system costs.
- Industrial: Rising energy costs, process heat requirements in industries, and environmental regulations.
The dominance of these segments and regions is expected to continue through 2033, although the growth rates of individual segments may differ.
Solar Collectors Industry Product Developments
Recent product innovations focus on enhancing efficiency, durability, and aesthetics. Advanced materials, improved heat transfer designs, and integrated smart controls are key features. The development of hybrid systems combining solar thermal with photovoltaic technologies is gaining traction. These advancements cater to diverse market needs, improving system performance and expanding applications into new sectors.
Report Scope & Segmentation Analysis
This report segments the solar collectors market by collector type (glazed and unglazed) and application (residential, commercial, industrial). Each segment presents unique growth dynamics, market sizes, and competitive landscapes. Glazed collectors are projected to maintain a higher CAGR than unglazed collectors, primarily driven by performance advantages. The commercial segment is expected to show the fastest growth, followed by the industrial sector. Residential installations are experiencing steady growth, but are currently smaller in scale compared to commercial and industrial applications.
Key Drivers of Solar Collectors Industry Growth
The solar collectors industry's growth is primarily fueled by several factors: stringent environmental regulations promoting renewable energy adoption, escalating fossil fuel prices, and increasing energy demand globally. Government incentives, such as tax credits and subsidies, significantly boost market growth. Technological advancements continue to enhance efficiency and reduce costs, further driving market expansion.
Challenges in the Solar Collectors Industry Sector
Significant challenges exist, including the high initial investment costs for system installation, dependence on weather conditions, and competition from conventional heating systems. Supply chain disruptions and material cost fluctuations also pose significant challenges. Furthermore, the lack of standardized testing and certification protocols can hinder market growth and investor confidence.
Emerging Opportunities in Solar Collectors Industry
Significant opportunities exist in the development of innovative solar thermal technologies, such as concentrated solar power (CSP) systems for large-scale applications. Integration with smart grids and building management systems is also an emerging trend. Expanding into developing countries with high solar irradiation and limited grid infrastructure offers immense growth potential.
Leading Players in the Solar Collectors Industry Market
- Solareast Holdings Co Ltd
- Greenonetec Solarindustrie GmbH
- HTP Comfort Solutions LLC
- Alternate Energy Technologies LLC
- Linuo Ritter International Co Ltd
- Aalborg CSP AS
- BTE solar Co Ltd
- Photon Energy Systems Limited
- Viessmann Manufacturing Company Inc
- Savosolar Oyj
- List Not Exhaustive
Key Developments in Solar Collectors Industry Industry
- July 2021: Establishment of a Concentrated Solar Thermal (CST) based testing facility in Hyderabad, India, boosting the testing and development of solar thermal components. This development is expected to significantly influence the Indian solar market and potentially impact global technological advancements.
Strategic Outlook for Solar Collectors Industry Market
The solar collectors industry is poised for sustained growth, driven by increasing global energy demand, environmental concerns, and supportive government policies. Continued technological innovation, particularly in efficiency and cost reduction, will be crucial. The market will likely see an increased focus on large-scale applications, smart integration, and specialized industrial processes. Expansion into new markets and strategic partnerships will be vital for success in this dynamic industry.
Solar Collectors Industry Segmentation
-
1. Collector Type
- 1.1. Glazed Collector
- 1.2. Unglazed Collector
-
2. Application
- 2.1. Residential
- 2.2. Commercial
- 2.3. Industrial
Solar Collectors Industry Segmentation By Geography
- 1. North America
- 2. Europe
- 3. Asia Pacific
- 4. South America
- 5. Middle East and Africa
Solar Collectors Industry REPORT HIGHLIGHTS
| Aspects | Details |
|---|---|
| Study Period | 2019-2033 |
| Base Year | 2024 |
| Estimated Year | 2025 |
| Forecast Period | 2025-2033 |
| Historical Period | 2019-2024 |
| Growth Rate | CAGR of > 4.50% from 2019-2033 |
| Segmentation |
|
Table of Contents
- 1. Introduction
- 1.1. Research Scope
- 1.2. Market Segmentation
- 1.3. Research Methodology
- 1.4. Definitions and Assumptions
- 2. Executive Summary
- 2.1. Introduction
- 3. Market Dynamics
- 3.1. Introduction
- 3.2. Market Drivers
- 3.2.1. 4.; Demand for Clean Energy Sources4.; Supportive Government Policies
- 3.3. Market Restrains
- 3.3.1. 4.; Increasing Adoption of Other Alternative Clean Energy Sources
- 3.4. Market Trends
- 3.4.1. Residential Segment Expected to Dominate the Market
- 4. Market Factor Analysis
- 4.1. Porters Five Forces
- 4.2. Supply/Value Chain
- 4.3. PESTEL analysis
- 4.4. Market Entropy
- 4.5. Patent/Trademark Analysis
- 5. Global Solar Collectors Industry Analysis, Insights and Forecast, 2019-2031
- 5.1. Market Analysis, Insights and Forecast - by Collector Type
- 5.1.1. Glazed Collector
- 5.1.2. Unglazed Collector
- 5.2. Market Analysis, Insights and Forecast - by Application
- 5.2.1. Residential
- 5.2.2. Commercial
- 5.2.3. Industrial
- 5.3. Market Analysis, Insights and Forecast - by Region
- 5.3.1. North America
- 5.3.2. Europe
- 5.3.3. Asia Pacific
- 5.3.4. South America
- 5.3.5. Middle East and Africa
- 5.1. Market Analysis, Insights and Forecast - by Collector Type
- 6. North America Solar Collectors Industry Analysis, Insights and Forecast, 2019-2031
- 6.1. Market Analysis, Insights and Forecast - by Collector Type
- 6.1.1. Glazed Collector
- 6.1.2. Unglazed Collector
- 6.2. Market Analysis, Insights and Forecast - by Application
- 6.2.1. Residential
- 6.2.2. Commercial
- 6.2.3. Industrial
- 6.1. Market Analysis, Insights and Forecast - by Collector Type
- 7. Europe Solar Collectors Industry Analysis, Insights and Forecast, 2019-2031
- 7.1. Market Analysis, Insights and Forecast - by Collector Type
- 7.1.1. Glazed Collector
- 7.1.2. Unglazed Collector
- 7.2. Market Analysis, Insights and Forecast - by Application
- 7.2.1. Residential
- 7.2.2. Commercial
- 7.2.3. Industrial
- 7.1. Market Analysis, Insights and Forecast - by Collector Type
- 8. Asia Pacific Solar Collectors Industry Analysis, Insights and Forecast, 2019-2031
- 8.1. Market Analysis, Insights and Forecast - by Collector Type
- 8.1.1. Glazed Collector
- 8.1.2. Unglazed Collector
- 8.2. Market Analysis, Insights and Forecast - by Application
- 8.2.1. Residential
- 8.2.2. Commercial
- 8.2.3. Industrial
- 8.1. Market Analysis, Insights and Forecast - by Collector Type
- 9. South America Solar Collectors Industry Analysis, Insights and Forecast, 2019-2031
- 9.1. Market Analysis, Insights and Forecast - by Collector Type
- 9.1.1. Glazed Collector
- 9.1.2. Unglazed Collector
- 9.2. Market Analysis, Insights and Forecast - by Application
- 9.2.1. Residential
- 9.2.2. Commercial
- 9.2.3. Industrial
- 9.1. Market Analysis, Insights and Forecast - by Collector Type
- 10. Middle East and Africa Solar Collectors Industry Analysis, Insights and Forecast, 2019-2031
- 10.1. Market Analysis, Insights and Forecast - by Collector Type
- 10.1.1. Glazed Collector
- 10.1.2. Unglazed Collector
- 10.2. Market Analysis, Insights and Forecast - by Application
- 10.2.1. Residential
- 10.2.2. Commercial
- 10.2.3. Industrial
- 10.1. Market Analysis, Insights and Forecast - by Collector Type
- 11. North America Solar Collectors Industry Analysis, Insights and Forecast, 2019-2031
- 11.1. Market Analysis, Insights and Forecast - By Country/Sub-region
- 11.1.1 United States
- 11.1.2 Canada
- 11.1.3 Mexico
- 12. Europe Solar Collectors Industry Analysis, Insights and Forecast, 2019-2031
- 12.1. Market Analysis, Insights and Forecast - By Country/Sub-region
- 12.1.1 Germany
- 12.1.2 United Kingdom
- 12.1.3 France
- 12.1.4 Spain
- 12.1.5 Italy
- 12.1.6 Spain
- 12.1.7 Belgium
- 12.1.8 Netherland
- 12.1.9 Nordics
- 12.1.10 Rest of Europe
- 13. Asia Pacific Solar Collectors Industry Analysis, Insights and Forecast, 2019-2031
- 13.1. Market Analysis, Insights and Forecast - By Country/Sub-region
- 13.1.1 China
- 13.1.2 Japan
- 13.1.3 India
- 13.1.4 South Korea
- 13.1.5 Southeast Asia
- 13.1.6 Australia
- 13.1.7 Indonesia
- 13.1.8 Phillipes
- 13.1.9 Singapore
- 13.1.10 Thailandc
- 13.1.11 Rest of Asia Pacific
- 14. South America Solar Collectors Industry Analysis, Insights and Forecast, 2019-2031
- 14.1. Market Analysis, Insights and Forecast - By Country/Sub-region
- 14.1.1 Brazil
- 14.1.2 Argentina
- 14.1.3 Peru
- 14.1.4 Chile
- 14.1.5 Colombia
- 14.1.6 Ecuador
- 14.1.7 Venezuela
- 14.1.8 Rest of South America
- 15. North America Solar Collectors Industry Analysis, Insights and Forecast, 2019-2031
- 15.1. Market Analysis, Insights and Forecast - By Country/Sub-region
- 15.1.1 United States
- 15.1.2 Canada
- 15.1.3 Mexico
- 16. MEA Solar Collectors Industry Analysis, Insights and Forecast, 2019-2031
- 16.1. Market Analysis, Insights and Forecast - By Country/Sub-region
- 16.1.1 United Arab Emirates
- 16.1.2 Saudi Arabia
- 16.1.3 South Africa
- 16.1.4 Rest of Middle East and Africa
- 17. Competitive Analysis
- 17.1. Global Market Share Analysis 2024
- 17.2. Company Profiles
- 17.2.1 Solareast Holdings Co Ltd
- 17.2.1.1. Overview
- 17.2.1.2. Products
- 17.2.1.3. SWOT Analysis
- 17.2.1.4. Recent Developments
- 17.2.1.5. Financials (Based on Availability)
- 17.2.2 Greenonetec Solarindustrie GmbH
- 17.2.2.1. Overview
- 17.2.2.2. Products
- 17.2.2.3. SWOT Analysis
- 17.2.2.4. Recent Developments
- 17.2.2.5. Financials (Based on Availability)
- 17.2.3 HTP Comfort Solutions LLC
- 17.2.3.1. Overview
- 17.2.3.2. Products
- 17.2.3.3. SWOT Analysis
- 17.2.3.4. Recent Developments
- 17.2.3.5. Financials (Based on Availability)
- 17.2.4 Alternate Energy Technologies LLC
- 17.2.4.1. Overview
- 17.2.4.2. Products
- 17.2.4.3. SWOT Analysis
- 17.2.4.4. Recent Developments
- 17.2.4.5. Financials (Based on Availability)
- 17.2.5 Linuo Ritter International Co Ltd
- 17.2.5.1. Overview
- 17.2.5.2. Products
- 17.2.5.3. SWOT Analysis
- 17.2.5.4. Recent Developments
- 17.2.5.5. Financials (Based on Availability)
- 17.2.6 Aalborg CSP AS
- 17.2.6.1. Overview
- 17.2.6.2. Products
- 17.2.6.3. SWOT Analysis
- 17.2.6.4. Recent Developments
- 17.2.6.5. Financials (Based on Availability)
- 17.2.7 BTE solar Co Ltd
- 17.2.7.1. Overview
- 17.2.7.2. Products
- 17.2.7.3. SWOT Analysis
- 17.2.7.4. Recent Developments
- 17.2.7.5. Financials (Based on Availability)
- 17.2.8 Photon Energy Systems Limited
- 17.2.8.1. Overview
- 17.2.8.2. Products
- 17.2.8.3. SWOT Analysis
- 17.2.8.4. Recent Developments
- 17.2.8.5. Financials (Based on Availability)
- 17.2.9 Viessmann Manufacturing Company Inc
- 17.2.9.1. Overview
- 17.2.9.2. Products
- 17.2.9.3. SWOT Analysis
- 17.2.9.4. Recent Developments
- 17.2.9.5. Financials (Based on Availability)
- 17.2.10 Savosolar Oyj*List Not Exhaustive
- 17.2.10.1. Overview
- 17.2.10.2. Products
- 17.2.10.3. SWOT Analysis
- 17.2.10.4. Recent Developments
- 17.2.10.5. Financials (Based on Availability)
- 17.2.1 Solareast Holdings Co Ltd
List of Figures
- Figure 1: Global Solar Collectors Industry Revenue Breakdown (Million, %) by Region 2024 & 2032
- Figure 2: North America Solar Collectors Industry Revenue (Million), by Country 2024 & 2032
- Figure 3: North America Solar Collectors Industry Revenue Share (%), by Country 2024 & 2032
- Figure 4: Europe Solar Collectors Industry Revenue (Million), by Country 2024 & 2032
- Figure 5: Europe Solar Collectors Industry Revenue Share (%), by Country 2024 & 2032
- Figure 6: Asia Pacific Solar Collectors Industry Revenue (Million), by Country 2024 & 2032
- Figure 7: Asia Pacific Solar Collectors Industry Revenue Share (%), by Country 2024 & 2032
- Figure 8: South America Solar Collectors Industry Revenue (Million), by Country 2024 & 2032
- Figure 9: South America Solar Collectors Industry Revenue Share (%), by Country 2024 & 2032
- Figure 10: North America Solar Collectors Industry Revenue (Million), by Country 2024 & 2032
- Figure 11: North America Solar Collectors Industry Revenue Share (%), by Country 2024 & 2032
- Figure 12: MEA Solar Collectors Industry Revenue (Million), by Country 2024 & 2032
- Figure 13: MEA Solar Collectors Industry Revenue Share (%), by Country 2024 & 2032
- Figure 14: North America Solar Collectors Industry Revenue (Million), by Collector Type 2024 & 2032
- Figure 15: North America Solar Collectors Industry Revenue Share (%), by Collector Type 2024 & 2032
- Figure 16: North America Solar Collectors Industry Revenue (Million), by Application 2024 & 2032
- Figure 17: North America Solar Collectors Industry Revenue Share (%), by Application 2024 & 2032
- Figure 18: North America Solar Collectors Industry Revenue (Million), by Country 2024 & 2032
- Figure 19: North America Solar Collectors Industry Revenue Share (%), by Country 2024 & 2032
- Figure 20: Europe Solar Collectors Industry Revenue (Million), by Collector Type 2024 & 2032
- Figure 21: Europe Solar Collectors Industry Revenue Share (%), by Collector Type 2024 & 2032
- Figure 22: Europe Solar Collectors Industry Revenue (Million), by Application 2024 & 2032
- Figure 23: Europe Solar Collectors Industry Revenue Share (%), by Application 2024 & 2032
- Figure 24: Europe Solar Collectors Industry Revenue (Million), by Country 2024 & 2032
- Figure 25: Europe Solar Collectors Industry Revenue Share (%), by Country 2024 & 2032
- Figure 26: Asia Pacific Solar Collectors Industry Revenue (Million), by Collector Type 2024 & 2032
- Figure 27: Asia Pacific Solar Collectors Industry Revenue Share (%), by Collector Type 2024 & 2032
- Figure 28: Asia Pacific Solar Collectors Industry Revenue (Million), by Application 2024 & 2032
- Figure 29: Asia Pacific Solar Collectors Industry Revenue Share (%), by Application 2024 & 2032
- Figure 30: Asia Pacific Solar Collectors Industry Revenue (Million), by Country 2024 & 2032
- Figure 31: Asia Pacific Solar Collectors Industry Revenue Share (%), by Country 2024 & 2032
- Figure 32: South America Solar Collectors Industry Revenue (Million), by Collector Type 2024 & 2032
- Figure 33: South America Solar Collectors Industry Revenue Share (%), by Collector Type 2024 & 2032
- Figure 34: South America Solar Collectors Industry Revenue (Million), by Application 2024 & 2032
- Figure 35: South America Solar Collectors Industry Revenue Share (%), by Application 2024 & 2032
- Figure 36: South America Solar Collectors Industry Revenue (Million), by Country 2024 & 2032
- Figure 37: South America Solar Collectors Industry Revenue Share (%), by Country 2024 & 2032
- Figure 38: Middle East and Africa Solar Collectors Industry Revenue (Million), by Collector Type 2024 & 2032
- Figure 39: Middle East and Africa Solar Collectors Industry Revenue Share (%), by Collector Type 2024 & 2032
- Figure 40: Middle East and Africa Solar Collectors Industry Revenue (Million), by Application 2024 & 2032
- Figure 41: Middle East and Africa Solar Collectors Industry Revenue Share (%), by Application 2024 & 2032
- Figure 42: Middle East and Africa Solar Collectors Industry Revenue (Million), by Country 2024 & 2032
- Figure 43: Middle East and Africa Solar Collectors Industry Revenue Share (%), by Country 2024 & 2032
List of Tables
- Table 1: Global Solar Collectors Industry Revenue Million Forecast, by Region 2019 & 2032
- Table 2: Global Solar Collectors Industry Revenue Million Forecast, by Collector Type 2019 & 2032
- Table 3: Global Solar Collectors Industry Revenue Million Forecast, by Application 2019 & 2032
- Table 4: Global Solar Collectors Industry Revenue Million Forecast, by Region 2019 & 2032
- Table 5: Global Solar Collectors Industry Revenue Million Forecast, by Country 2019 & 2032
- Table 6: United States Solar Collectors Industry Revenue (Million) Forecast, by Application 2019 & 2032
- Table 7: Canada Solar Collectors Industry Revenue (Million) Forecast, by Application 2019 & 2032
- Table 8: Mexico Solar Collectors Industry Revenue (Million) Forecast, by Application 2019 & 2032
- Table 9: Global Solar Collectors Industry Revenue Million Forecast, by Country 2019 & 2032
- Table 10: Germany Solar Collectors Industry Revenue (Million) Forecast, by Application 2019 & 2032
- Table 11: United Kingdom Solar Collectors Industry Revenue (Million) Forecast, by Application 2019 & 2032
- Table 12: France Solar Collectors Industry Revenue (Million) Forecast, by Application 2019 & 2032
- Table 13: Spain Solar Collectors Industry Revenue (Million) Forecast, by Application 2019 & 2032
- Table 14: Italy Solar Collectors Industry Revenue (Million) Forecast, by Application 2019 & 2032
- Table 15: Spain Solar Collectors Industry Revenue (Million) Forecast, by Application 2019 & 2032
- Table 16: Belgium Solar Collectors Industry Revenue (Million) Forecast, by Application 2019 & 2032
- Table 17: Netherland Solar Collectors Industry Revenue (Million) Forecast, by Application 2019 & 2032
- Table 18: Nordics Solar Collectors Industry Revenue (Million) Forecast, by Application 2019 & 2032
- Table 19: Rest of Europe Solar Collectors Industry Revenue (Million) Forecast, by Application 2019 & 2032
- Table 20: Global Solar Collectors Industry Revenue Million Forecast, by Country 2019 & 2032
- Table 21: China Solar Collectors Industry Revenue (Million) Forecast, by Application 2019 & 2032
- Table 22: Japan Solar Collectors Industry Revenue (Million) Forecast, by Application 2019 & 2032
- Table 23: India Solar Collectors Industry Revenue (Million) Forecast, by Application 2019 & 2032
- Table 24: South Korea Solar Collectors Industry Revenue (Million) Forecast, by Application 2019 & 2032
- Table 25: Southeast Asia Solar Collectors Industry Revenue (Million) Forecast, by Application 2019 & 2032
- Table 26: Australia Solar Collectors Industry Revenue (Million) Forecast, by Application 2019 & 2032
- Table 27: Indonesia Solar Collectors Industry Revenue (Million) Forecast, by Application 2019 & 2032
- Table 28: Phillipes Solar Collectors Industry Revenue (Million) Forecast, by Application 2019 & 2032
- Table 29: Singapore Solar Collectors Industry Revenue (Million) Forecast, by Application 2019 & 2032
- Table 30: Thailandc Solar Collectors Industry Revenue (Million) Forecast, by Application 2019 & 2032
- Table 31: Rest of Asia Pacific Solar Collectors Industry Revenue (Million) Forecast, by Application 2019 & 2032
- Table 32: Global Solar Collectors Industry Revenue Million Forecast, by Country 2019 & 2032
- Table 33: Brazil Solar Collectors Industry Revenue (Million) Forecast, by Application 2019 & 2032
- Table 34: Argentina Solar Collectors Industry Revenue (Million) Forecast, by Application 2019 & 2032
- Table 35: Peru Solar Collectors Industry Revenue (Million) Forecast, by Application 2019 & 2032
- Table 36: Chile Solar Collectors Industry Revenue (Million) Forecast, by Application 2019 & 2032
- Table 37: Colombia Solar Collectors Industry Revenue (Million) Forecast, by Application 2019 & 2032
- Table 38: Ecuador Solar Collectors Industry Revenue (Million) Forecast, by Application 2019 & 2032
- Table 39: Venezuela Solar Collectors Industry Revenue (Million) Forecast, by Application 2019 & 2032
- Table 40: Rest of South America Solar Collectors Industry Revenue (Million) Forecast, by Application 2019 & 2032
- Table 41: Global Solar Collectors Industry Revenue Million Forecast, by Country 2019 & 2032
- Table 42: United States Solar Collectors Industry Revenue (Million) Forecast, by Application 2019 & 2032
- Table 43: Canada Solar Collectors Industry Revenue (Million) Forecast, by Application 2019 & 2032
- Table 44: Mexico Solar Collectors Industry Revenue (Million) Forecast, by Application 2019 & 2032
- Table 45: Global Solar Collectors Industry Revenue Million Forecast, by Country 2019 & 2032
- Table 46: United Arab Emirates Solar Collectors Industry Revenue (Million) Forecast, by Application 2019 & 2032
- Table 47: Saudi Arabia Solar Collectors Industry Revenue (Million) Forecast, by Application 2019 & 2032
- Table 48: South Africa Solar Collectors Industry Revenue (Million) Forecast, by Application 2019 & 2032
- Table 49: Rest of Middle East and Africa Solar Collectors Industry Revenue (Million) Forecast, by Application 2019 & 2032
- Table 50: Global Solar Collectors Industry Revenue Million Forecast, by Collector Type 2019 & 2032
- Table 51: Global Solar Collectors Industry Revenue Million Forecast, by Application 2019 & 2032
- Table 52: Global Solar Collectors Industry Revenue Million Forecast, by Country 2019 & 2032
- Table 53: Global Solar Collectors Industry Revenue Million Forecast, by Collector Type 2019 & 2032
- Table 54: Global Solar Collectors Industry Revenue Million Forecast, by Application 2019 & 2032
- Table 55: Global Solar Collectors Industry Revenue Million Forecast, by Country 2019 & 2032
- Table 56: Global Solar Collectors Industry Revenue Million Forecast, by Collector Type 2019 & 2032
- Table 57: Global Solar Collectors Industry Revenue Million Forecast, by Application 2019 & 2032
- Table 58: Global Solar Collectors Industry Revenue Million Forecast, by Country 2019 & 2032
- Table 59: Global Solar Collectors Industry Revenue Million Forecast, by Collector Type 2019 & 2032
- Table 60: Global Solar Collectors Industry Revenue Million Forecast, by Application 2019 & 2032
- Table 61: Global Solar Collectors Industry Revenue Million Forecast, by Country 2019 & 2032
- Table 62: Global Solar Collectors Industry Revenue Million Forecast, by Collector Type 2019 & 2032
- Table 63: Global Solar Collectors Industry Revenue Million Forecast, by Application 2019 & 2032
- Table 64: Global Solar Collectors Industry Revenue Million Forecast, by Country 2019 & 2032
Frequently Asked Questions
1. What is the projected Compound Annual Growth Rate (CAGR) of the Solar Collectors Industry?
The projected CAGR is approximately > 4.50%.
2. Which companies are prominent players in the Solar Collectors Industry?
Key companies in the market include Solareast Holdings Co Ltd, Greenonetec Solarindustrie GmbH, HTP Comfort Solutions LLC, Alternate Energy Technologies LLC, Linuo Ritter International Co Ltd, Aalborg CSP AS, BTE solar Co Ltd, Photon Energy Systems Limited, Viessmann Manufacturing Company Inc, Savosolar Oyj*List Not Exhaustive.
3. What are the main segments of the Solar Collectors Industry?
The market segments include Collector Type, Application.
4. Can you provide details about the market size?
The market size is estimated to be USD XX Million as of 2022.
5. What are some drivers contributing to market growth?
4.; Demand for Clean Energy Sources4.; Supportive Government Policies.
6. What are the notable trends driving market growth?
Residential Segment Expected to Dominate the Market.
7. Are there any restraints impacting market growth?
4.; Increasing Adoption of Other Alternative Clean Energy Sources.
8. Can you provide examples of recent developments in the market?
In July 2021, a Concentrated Solar Thermal (CST) based testing facility was established in Hyderabad to help India's growing solar sector to test the capabilities and performance of solar thermal components such as solar receiver tubes, heat transfer fluids, and concentrating mirrors.
9. What pricing options are available for accessing the report?
Pricing options include single-user, multi-user, and enterprise licenses priced at USD 4750, USD 5250, and USD 8750 respectively.
10. Is the market size provided in terms of value or volume?
The market size is provided in terms of value, measured in Million.
11. Are there any specific market keywords associated with the report?
Yes, the market keyword associated with the report is "Solar Collectors Industry," which aids in identifying and referencing the specific market segment covered.
12. How do I determine which pricing option suits my needs best?
The pricing options vary based on user requirements and access needs. Individual users may opt for single-user licenses, while businesses requiring broader access may choose multi-user or enterprise licenses for cost-effective access to the report.
13. Are there any additional resources or data provided in the Solar Collectors Industry report?
While the report offers comprehensive insights, it's advisable to review the specific contents or supplementary materials provided to ascertain if additional resources or data are available.
14. How can I stay updated on further developments or reports in the Solar Collectors Industry?
To stay informed about further developments, trends, and reports in the Solar Collectors Industry, consider subscribing to industry newsletters, following relevant companies and organizations, or regularly checking reputable industry news sources and publications.
Methodology
Step 1 - Identification of Relevant Samples Size from Population Database


Step 2 - Approaches for Defining Global Market Size (Value, Volume* & Price*)

Note*: In applicable scenarios
Step 3 - Data Sources
Primary Research
- Web Analytics
- Survey Reports
- Research Institute
- Latest Research Reports
- Opinion Leaders
Secondary Research
- Annual Reports
- White Paper
- Latest Press Release
- Industry Association
- Paid Database
- Investor Presentations

Step 4 - Data Triangulation
Involves using different sources of information in order to increase the validity of a study
These sources are likely to be stakeholders in a program - participants, other researchers, program staff, other community members, and so on.
Then we put all data in single framework & apply various statistical tools to find out the dynamic on the market.
During the analysis stage, feedback from the stakeholder groups would be compared to determine areas of agreement as well as areas of divergence


