
Key Insights
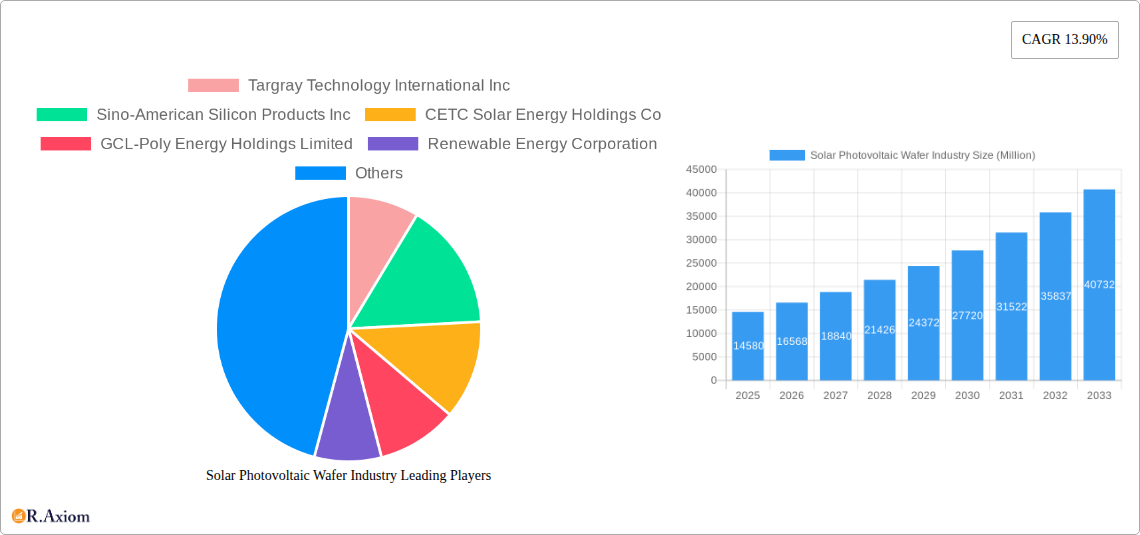
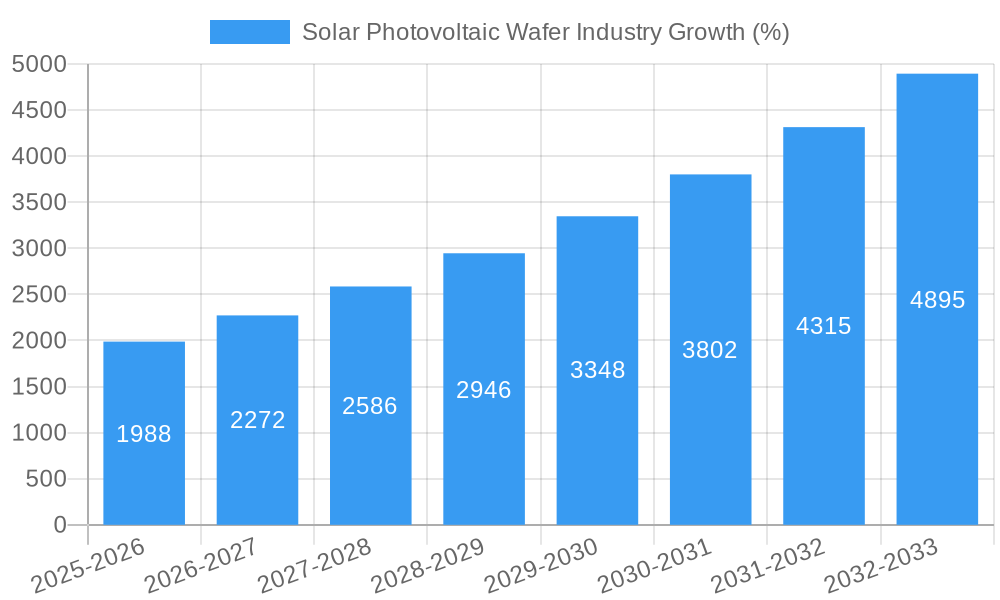
The global solar photovoltaic (PV) wafer market is experiencing robust growth, projected to reach $14.58 billion in 2025 and exhibiting a Compound Annual Growth Rate (CAGR) of 13.90% from 2025 to 2033. This expansion is fueled by several key factors. Increasing global energy demand coupled with rising concerns about climate change and the urgent need for renewable energy sources are driving significant investments in solar PV technology. Government incentives, including subsidies and tax breaks for solar energy adoption, are further bolstering market growth across various regions. Technological advancements resulting in higher efficiency and lower production costs of monocrystalline wafers are also contributing to market expansion. The shift towards larger-scale solar power plants and the increasing integration of solar PV into residential and commercial buildings are key trends shaping the market landscape. While challenges such as fluctuating raw material prices and potential supply chain disruptions exist, the long-term outlook for the solar PV wafer market remains extremely positive, driven by strong policy support and growing consumer demand for sustainable energy solutions.
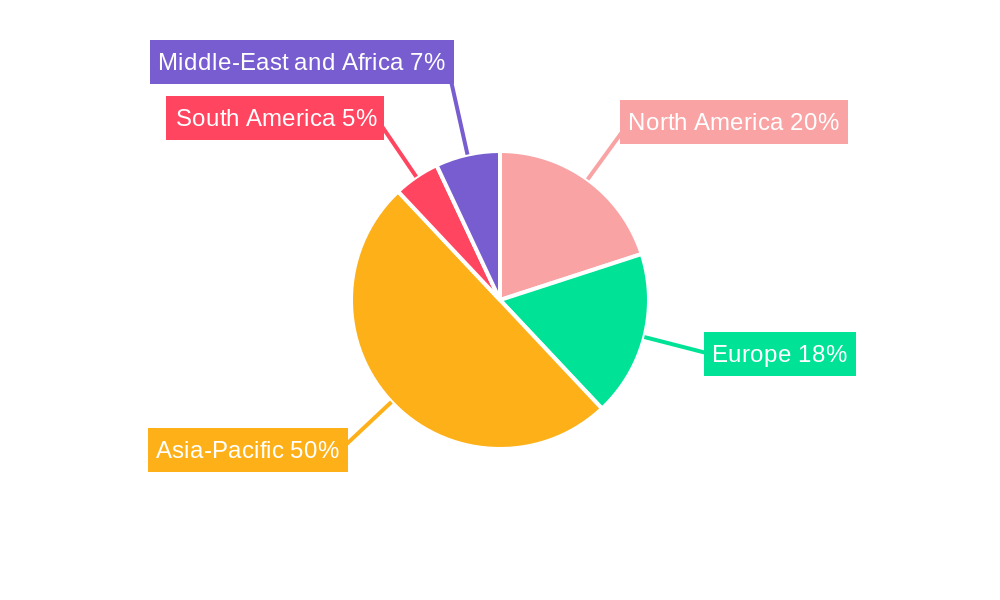
The market segmentation reveals a diverse landscape. Monocrystalline wafers currently dominate the type segment due to their superior efficiency compared to polycrystalline wafers, although the latter retains a significant market share due to its lower cost. Geographically, Asia-Pacific, particularly China, is the leading market, driven by massive solar energy deployments and a robust manufacturing base. North America and Europe also represent substantial markets with considerable growth potential, fueled by supportive government policies and a rising awareness of environmental sustainability. Key players in the market include Targray Technology International Inc, Sino-American Silicon Products Inc, CETC Solar Energy Holdings Co, GCL-Poly Energy Holdings Limited, Renewable Energy Corporation, Jinko Solar Holding Co Ltd, JA Solar Holdings Co Ltd, and LONGi Green Energy Technology Co Ltd, each contributing to the innovation and supply chain dynamics of this rapidly evolving sector. Competitive landscape analysis indicates a trend toward consolidation and strategic partnerships to secure raw materials and expand market reach.
Solar Photovoltaic Wafer Industry: A Comprehensive Market Report (2019-2033)
This comprehensive report provides an in-depth analysis of the global solar photovoltaic (PV) wafer industry, covering the period from 2019 to 2033. It examines market dynamics, competitive landscapes, technological advancements, and future growth prospects. The report utilizes data from 2019-2024 (historical period), with 2025 serving as the base and estimated year, and forecasts extending to 2033. Key players such as Targray Technology International Inc, Sino-American Silicon Products Inc, CETC Solar Energy Holdings Co, GCL-Poly Energy Holdings Limited, Renewable Energy Corporation, Jinko Solar Holding Co Ltd, JA Solar Holdings Co Ltd, and LONGi Green Energy Technology Co Ltd are profiled, providing valuable insights for industry stakeholders.
Solar Photovoltaic Wafer Industry Market Concentration & Innovation
The solar PV wafer market is characterized by a moderately concentrated landscape with a few dominant players controlling a significant market share. However, the industry is witnessing increasing innovation, particularly in areas like monocrystalline wafer technology and improved production efficiency. Regulatory frameworks, including government incentives and carbon emission reduction targets, are major drivers of market growth. Product substitution, primarily from advancements in thin-film solar technology, poses a moderate threat. End-user trends favor higher-efficiency wafers, pushing manufacturers to constantly innovate. M&A activities are observed, although deal values vary significantly; for example, the recent USD 32 million investment in NexdWafe GmbH is a clear indication of growing interest in green manufacturing processes. Market share data for individual companies (xx% for each) is available in the full report. Analysis of M&A activities includes specific deal values from 2019 to 2024, revealing an increasing trend (xx Million USD total deal value in 2024).
Solar Photovoltaic Wafer Industry Industry Trends & Insights
The global solar PV wafer market is experiencing robust growth, driven primarily by the increasing demand for renewable energy sources and supportive government policies worldwide. The Compound Annual Growth Rate (CAGR) from 2025 to 2033 is projected at xx%. Technological disruptions, such as the continuous improvement in monocrystalline wafer efficiency and the emergence of novel manufacturing processes (e.g., NexdWafe's green manufacturing method), are reshaping the industry landscape. Consumer preferences are shifting towards higher efficiency and cost-effective solutions. The competitive dynamics are characterized by price competition, technological advancements, and strategic partnerships. Market penetration of monocrystalline wafers is increasing steadily, reaching xx% in 2024 and projected to reach xx% by 2033.
Dominant Markets & Segments in Solar Photovoltaic Wafer Industry
Asia-Pacific dominates the global solar PV wafer market, accounting for the largest market share in 2024 (xx%). This dominance is driven by several factors:
- High demand for renewable energy: Governments in countries such as China and India have implemented supportive policies to boost renewable energy adoption.
- Established manufacturing base: Asia-Pacific has a large and well-established solar manufacturing sector, with significant production capacity.
- Favorable economic conditions: Lower production costs and favorable investment climates attract solar manufacturers.
While Asia-Pacific holds the leading position, other regions are experiencing notable growth, especially North America driven by increasing government investments and incentives, and Europe, influenced by robust renewable energy targets. In terms of wafer types, monocrystalline wafers hold a significant majority of the market share, with a projected market size of xx Million by 2033, owing to their superior efficiency. Detailed country-wise market size and growth projections for all regions (North America, Europe, Asia-Pacific, South America, Middle East and Africa) are included in the full report.
Solar Photovoltaic Wafer Industry Product Developments
Recent product innovations focus on improving wafer efficiency, reducing production costs, and enhancing sustainability. The shift towards monocrystalline wafers is a significant trend, reflecting higher conversion efficiency. Manufacturers are also focusing on developing innovative manufacturing processes, reducing energy consumption and material waste, and enhancing the environmental footprint. The market is witnessing the emergence of high-efficiency, large-size wafers to further improve the energy output of solar panels. These developments offer competitive advantages based on cost and performance.
Report Scope & Segmentation Analysis
This report segments the solar PV wafer market based on geography (North America, Europe, Asia-Pacific, South America, Middle East and Africa), wafer type (monocrystalline, polycrystalline), and specific regional breakdowns (e.g., Rest of North America, Rest of Europe). Each segment is analyzed individually, providing insights into growth projections, market size, and competitive dynamics. For instance, the monocrystalline wafer segment is expected to witness robust growth due to increasing efficiency, while the Asia-Pacific region maintains its dominance driven by robust demand and production capacity. Specific market size projections for each segment are detailed in the full report.
Key Drivers of Solar Photovoltaic Wafer Industry Growth
Several factors are driving the growth of the solar PV wafer industry:
- Increasing global demand for renewable energy: This is fueled by concerns about climate change and the need for sustainable energy sources.
- Government policies and incentives: Many countries are promoting solar energy adoption through subsidies, tax breaks, and renewable energy mandates.
- Technological advancements: Continuous improvements in wafer efficiency and manufacturing processes are making solar energy more cost-competitive.
- Falling prices: The cost of solar PV systems has significantly decreased over the years, making them more accessible to consumers.
Challenges in the Solar Photovoltaic Wafer Industry Sector
The solar PV wafer industry faces several challenges:
- Supply chain disruptions: Geopolitical factors and unforeseen events can disrupt the supply of raw materials, impacting production.
- Price volatility: Fluctuations in raw material prices, particularly silicon, can impact profitability.
- Competition: The market is increasingly competitive, with manufacturers constantly striving for cost reductions and efficiency improvements.
- Environmental concerns: The manufacturing process of silicon wafers involves significant energy and resource consumption, and thus maintaining a robust environmental footprint is a major challenge.
Emerging Opportunities in Solar Photovoltaic Wafer Industry
Emerging opportunities exist in several areas:
- New markets: Developing countries present significant growth potential for solar energy adoption.
- Technological innovations: Research and development efforts focused on advanced materials and manufacturing techniques can yield significant improvements in efficiency and cost reduction.
- Energy storage solutions: Integrating solar PV systems with energy storage technologies can further enhance the reliability and value proposition of solar power.
Leading Players in the Solar Photovoltaic Wafer Industry Market
- Targray Technology International Inc
- Sino-American Silicon Products Inc
- CETC Solar Energy Holdings Co
- GCL-Poly Energy Holdings Limited
- Renewable Energy Corporation
- Jinko Solar Holding Co Ltd
- JA Solar Holdings Co Ltd
- LONGi Green Energy Technology Co Ltd
Key Developments in Solar Photovoltaic Wafer Industry Industry
- June 2023: NexdWafe GmbH secured a USD 32 million contract to build a green solar wafer production facility in Germany. This demonstrates growing interest in sustainable manufacturing practices and potentially shifts market dynamics towards greener production methods.
- June 2023: CubicPV received USD 103 million in equity financing to expand its US silicon wafer production base. This signifies a significant investment in domestic US production capacity, potentially impacting the global market share distribution.
Strategic Outlook for Solar Photovoltaic Wafer Industry Market
The future of the solar PV wafer industry is bright, driven by the continued growth in renewable energy adoption, technological advancements, and favorable government policies. Opportunities exist in expanding into new markets, developing innovative products, and improving production efficiency and sustainability. The market is poised for further consolidation through M&A activities. Companies investing in green technologies and R&D will likely gain a significant competitive advantage, further shaping the market landscape in the years to come. The overall market is projected to experience significant growth, reaching xx Million USD in revenue by 2033.
Solar Photovoltaic Wafer Industry Segmentation
-
1. Type
- 1.1. Monocrystalline Wafer
- 1.2. Polycrystalline Wafer
-
2. Geogrpahy
-
2.1. North America
- 2.1.1. United States
- 2.1.2. Canada
- 2.1.3. Rest of North America
-
2.2. Europe
- 2.2.1. Germany
- 2.2.2. France
- 2.2.3. United Kingdom
- 2.2.4. Italy
- 2.2.5. Spain
- 2.2.6. NORDIC
- 2.2.7. Turkey
- 2.2.8. Russia
- 2.2.9. Rest of Europe
-
2.3. Asia-Pacific
- 2.3.1. China
- 2.3.2. India
- 2.3.3. Australia
- 2.3.4. Japan
- 2.3.5. Malaysia
- 2.3.6. Vietnam
- 2.3.7. Thailand
- 2.3.8. Indonesia
- 2.3.9. Rest of Asia-Pacific
-
2.4. South America
- 2.4.1. Brazil
- 2.4.2. Argentina
- 2.4.3. Chile
- 2.4.4. Colombia
- 2.4.5. Rest of South America
-
2.5. Middle-East and Africa
- 2.5.1. United Arab Emirates
- 2.5.2. Saudi Arabia
- 2.5.3. South Africa
- 2.5.4. Qatar
- 2.5.5. Nigeria
- 2.5.6. Egypt
-
2.1. North America
- 3. Market Player Ranking
Solar Photovoltaic Wafer Industry Segmentation By Geography
-
1. North America
- 1.1. United States
- 1.2. Canada
- 1.3. Mexico
-
2. South America
- 2.1. Brazil
- 2.2. Argentina
- 2.3. Rest of South America
-
3. Europe
- 3.1. United Kingdom
- 3.2. Germany
- 3.3. France
- 3.4. Italy
- 3.5. Spain
- 3.6. Russia
- 3.7. Benelux
- 3.8. Nordics
- 3.9. Rest of Europe
-
4. Middle East & Africa
- 4.1. Turkey
- 4.2. Israel
- 4.3. GCC
- 4.4. North Africa
- 4.5. South Africa
- 4.6. Rest of Middle East & Africa
-
5. Asia Pacific
- 5.1. China
- 5.2. India
- 5.3. Japan
- 5.4. South Korea
- 5.5. ASEAN
- 5.6. Oceania
- 5.7. Rest of Asia Pacific
Solar Photovoltaic Wafer Industry REPORT HIGHLIGHTS
| Aspects | Details |
|---|---|
| Study Period | 2019-2033 |
| Base Year | 2024 |
| Estimated Year | 2025 |
| Forecast Period | 2025-2033 |
| Historical Period | 2019-2024 |
| Growth Rate | CAGR of 13.90% from 2019-2033 |
| Segmentation |
|
Table of Contents
- 1. Introduction
- 1.1. Research Scope
- 1.2. Market Segmentation
- 1.3. Research Methodology
- 1.4. Definitions and Assumptions
- 2. Executive Summary
- 2.1. Introduction
- 3. Market Dynamics
- 3.1. Introduction
- 3.2. Market Drivers
- 3.2.1. 4.; Increasing Demand for Renewable Energy4.; Supportive Government Policies
- 3.3. Market Restrains
- 3.3.1. 4.; High Cost Compared to Alternatives like Thin Films
- 3.4. Market Trends
- 3.4.1. Monocrystalline Solar Photovoltaic Wafer is Expected to Dominate the Market
- 4. Market Factor Analysis
- 4.1. Porters Five Forces
- 4.2. Supply/Value Chain
- 4.3. PESTEL analysis
- 4.4. Market Entropy
- 4.5. Patent/Trademark Analysis
- 5. Global Solar Photovoltaic Wafer Industry Analysis, Insights and Forecast, 2019-2031
- 5.1. Market Analysis, Insights and Forecast - by Type
- 5.1.1. Monocrystalline Wafer
- 5.1.2. Polycrystalline Wafer
- 5.2. Market Analysis, Insights and Forecast - by Geogrpahy
- 5.2.1. North America
- 5.2.1.1. United States
- 5.2.1.2. Canada
- 5.2.1.3. Rest of North America
- 5.2.2. Europe
- 5.2.2.1. Germany
- 5.2.2.2. France
- 5.2.2.3. United Kingdom
- 5.2.2.4. Italy
- 5.2.2.5. Spain
- 5.2.2.6. NORDIC
- 5.2.2.7. Turkey
- 5.2.2.8. Russia
- 5.2.2.9. Rest of Europe
- 5.2.3. Asia-Pacific
- 5.2.3.1. China
- 5.2.3.2. India
- 5.2.3.3. Australia
- 5.2.3.4. Japan
- 5.2.3.5. Malaysia
- 5.2.3.6. Vietnam
- 5.2.3.7. Thailand
- 5.2.3.8. Indonesia
- 5.2.3.9. Rest of Asia-Pacific
- 5.2.4. South America
- 5.2.4.1. Brazil
- 5.2.4.2. Argentina
- 5.2.4.3. Chile
- 5.2.4.4. Colombia
- 5.2.4.5. Rest of South America
- 5.2.5. Middle-East and Africa
- 5.2.5.1. United Arab Emirates
- 5.2.5.2. Saudi Arabia
- 5.2.5.3. South Africa
- 5.2.5.4. Qatar
- 5.2.5.5. Nigeria
- 5.2.5.6. Egypt
- 5.2.1. North America
- 5.3. Market Analysis, Insights and Forecast - by Market Player Ranking
- 5.4. Market Analysis, Insights and Forecast - by Region
- 5.4.1. North America
- 5.4.2. South America
- 5.4.3. Europe
- 5.4.4. Middle East & Africa
- 5.4.5. Asia Pacific
- 5.1. Market Analysis, Insights and Forecast - by Type
- 6. North America Solar Photovoltaic Wafer Industry Analysis, Insights and Forecast, 2019-2031
- 6.1. Market Analysis, Insights and Forecast - by Type
- 6.1.1. Monocrystalline Wafer
- 6.1.2. Polycrystalline Wafer
- 6.2. Market Analysis, Insights and Forecast - by Geogrpahy
- 6.2.1. North America
- 6.2.1.1. United States
- 6.2.1.2. Canada
- 6.2.1.3. Rest of North America
- 6.2.2. Europe
- 6.2.2.1. Germany
- 6.2.2.2. France
- 6.2.2.3. United Kingdom
- 6.2.2.4. Italy
- 6.2.2.5. Spain
- 6.2.2.6. NORDIC
- 6.2.2.7. Turkey
- 6.2.2.8. Russia
- 6.2.2.9. Rest of Europe
- 6.2.3. Asia-Pacific
- 6.2.3.1. China
- 6.2.3.2. India
- 6.2.3.3. Australia
- 6.2.3.4. Japan
- 6.2.3.5. Malaysia
- 6.2.3.6. Vietnam
- 6.2.3.7. Thailand
- 6.2.3.8. Indonesia
- 6.2.3.9. Rest of Asia-Pacific
- 6.2.4. South America
- 6.2.4.1. Brazil
- 6.2.4.2. Argentina
- 6.2.4.3. Chile
- 6.2.4.4. Colombia
- 6.2.4.5. Rest of South America
- 6.2.5. Middle-East and Africa
- 6.2.5.1. United Arab Emirates
- 6.2.5.2. Saudi Arabia
- 6.2.5.3. South Africa
- 6.2.5.4. Qatar
- 6.2.5.5. Nigeria
- 6.2.5.6. Egypt
- 6.2.1. North America
- 6.3. Market Analysis, Insights and Forecast - by Market Player Ranking
- 6.1. Market Analysis, Insights and Forecast - by Type
- 7. South America Solar Photovoltaic Wafer Industry Analysis, Insights and Forecast, 2019-2031
- 7.1. Market Analysis, Insights and Forecast - by Type
- 7.1.1. Monocrystalline Wafer
- 7.1.2. Polycrystalline Wafer
- 7.2. Market Analysis, Insights and Forecast - by Geogrpahy
- 7.2.1. North America
- 7.2.1.1. United States
- 7.2.1.2. Canada
- 7.2.1.3. Rest of North America
- 7.2.2. Europe
- 7.2.2.1. Germany
- 7.2.2.2. France
- 7.2.2.3. United Kingdom
- 7.2.2.4. Italy
- 7.2.2.5. Spain
- 7.2.2.6. NORDIC
- 7.2.2.7. Turkey
- 7.2.2.8. Russia
- 7.2.2.9. Rest of Europe
- 7.2.3. Asia-Pacific
- 7.2.3.1. China
- 7.2.3.2. India
- 7.2.3.3. Australia
- 7.2.3.4. Japan
- 7.2.3.5. Malaysia
- 7.2.3.6. Vietnam
- 7.2.3.7. Thailand
- 7.2.3.8. Indonesia
- 7.2.3.9. Rest of Asia-Pacific
- 7.2.4. South America
- 7.2.4.1. Brazil
- 7.2.4.2. Argentina
- 7.2.4.3. Chile
- 7.2.4.4. Colombia
- 7.2.4.5. Rest of South America
- 7.2.5. Middle-East and Africa
- 7.2.5.1. United Arab Emirates
- 7.2.5.2. Saudi Arabia
- 7.2.5.3. South Africa
- 7.2.5.4. Qatar
- 7.2.5.5. Nigeria
- 7.2.5.6. Egypt
- 7.2.1. North America
- 7.3. Market Analysis, Insights and Forecast - by Market Player Ranking
- 7.1. Market Analysis, Insights and Forecast - by Type
- 8. Europe Solar Photovoltaic Wafer Industry Analysis, Insights and Forecast, 2019-2031
- 8.1. Market Analysis, Insights and Forecast - by Type
- 8.1.1. Monocrystalline Wafer
- 8.1.2. Polycrystalline Wafer
- 8.2. Market Analysis, Insights and Forecast - by Geogrpahy
- 8.2.1. North America
- 8.2.1.1. United States
- 8.2.1.2. Canada
- 8.2.1.3. Rest of North America
- 8.2.2. Europe
- 8.2.2.1. Germany
- 8.2.2.2. France
- 8.2.2.3. United Kingdom
- 8.2.2.4. Italy
- 8.2.2.5. Spain
- 8.2.2.6. NORDIC
- 8.2.2.7. Turkey
- 8.2.2.8. Russia
- 8.2.2.9. Rest of Europe
- 8.2.3. Asia-Pacific
- 8.2.3.1. China
- 8.2.3.2. India
- 8.2.3.3. Australia
- 8.2.3.4. Japan
- 8.2.3.5. Malaysia
- 8.2.3.6. Vietnam
- 8.2.3.7. Thailand
- 8.2.3.8. Indonesia
- 8.2.3.9. Rest of Asia-Pacific
- 8.2.4. South America
- 8.2.4.1. Brazil
- 8.2.4.2. Argentina
- 8.2.4.3. Chile
- 8.2.4.4. Colombia
- 8.2.4.5. Rest of South America
- 8.2.5. Middle-East and Africa
- 8.2.5.1. United Arab Emirates
- 8.2.5.2. Saudi Arabia
- 8.2.5.3. South Africa
- 8.2.5.4. Qatar
- 8.2.5.5. Nigeria
- 8.2.5.6. Egypt
- 8.2.1. North America
- 8.3. Market Analysis, Insights and Forecast - by Market Player Ranking
- 8.1. Market Analysis, Insights and Forecast - by Type
- 9. Middle East & Africa Solar Photovoltaic Wafer Industry Analysis, Insights and Forecast, 2019-2031
- 9.1. Market Analysis, Insights and Forecast - by Type
- 9.1.1. Monocrystalline Wafer
- 9.1.2. Polycrystalline Wafer
- 9.2. Market Analysis, Insights and Forecast - by Geogrpahy
- 9.2.1. North America
- 9.2.1.1. United States
- 9.2.1.2. Canada
- 9.2.1.3. Rest of North America
- 9.2.2. Europe
- 9.2.2.1. Germany
- 9.2.2.2. France
- 9.2.2.3. United Kingdom
- 9.2.2.4. Italy
- 9.2.2.5. Spain
- 9.2.2.6. NORDIC
- 9.2.2.7. Turkey
- 9.2.2.8. Russia
- 9.2.2.9. Rest of Europe
- 9.2.3. Asia-Pacific
- 9.2.3.1. China
- 9.2.3.2. India
- 9.2.3.3. Australia
- 9.2.3.4. Japan
- 9.2.3.5. Malaysia
- 9.2.3.6. Vietnam
- 9.2.3.7. Thailand
- 9.2.3.8. Indonesia
- 9.2.3.9. Rest of Asia-Pacific
- 9.2.4. South America
- 9.2.4.1. Brazil
- 9.2.4.2. Argentina
- 9.2.4.3. Chile
- 9.2.4.4. Colombia
- 9.2.4.5. Rest of South America
- 9.2.5. Middle-East and Africa
- 9.2.5.1. United Arab Emirates
- 9.2.5.2. Saudi Arabia
- 9.2.5.3. South Africa
- 9.2.5.4. Qatar
- 9.2.5.5. Nigeria
- 9.2.5.6. Egypt
- 9.2.1. North America
- 9.3. Market Analysis, Insights and Forecast - by Market Player Ranking
- 9.1. Market Analysis, Insights and Forecast - by Type
- 10. Asia Pacific Solar Photovoltaic Wafer Industry Analysis, Insights and Forecast, 2019-2031
- 10.1. Market Analysis, Insights and Forecast - by Type
- 10.1.1. Monocrystalline Wafer
- 10.1.2. Polycrystalline Wafer
- 10.2. Market Analysis, Insights and Forecast - by Geogrpahy
- 10.2.1. North America
- 10.2.1.1. United States
- 10.2.1.2. Canada
- 10.2.1.3. Rest of North America
- 10.2.2. Europe
- 10.2.2.1. Germany
- 10.2.2.2. France
- 10.2.2.3. United Kingdom
- 10.2.2.4. Italy
- 10.2.2.5. Spain
- 10.2.2.6. NORDIC
- 10.2.2.7. Turkey
- 10.2.2.8. Russia
- 10.2.2.9. Rest of Europe
- 10.2.3. Asia-Pacific
- 10.2.3.1. China
- 10.2.3.2. India
- 10.2.3.3. Australia
- 10.2.3.4. Japan
- 10.2.3.5. Malaysia
- 10.2.3.6. Vietnam
- 10.2.3.7. Thailand
- 10.2.3.8. Indonesia
- 10.2.3.9. Rest of Asia-Pacific
- 10.2.4. South America
- 10.2.4.1. Brazil
- 10.2.4.2. Argentina
- 10.2.4.3. Chile
- 10.2.4.4. Colombia
- 10.2.4.5. Rest of South America
- 10.2.5. Middle-East and Africa
- 10.2.5.1. United Arab Emirates
- 10.2.5.2. Saudi Arabia
- 10.2.5.3. South Africa
- 10.2.5.4. Qatar
- 10.2.5.5. Nigeria
- 10.2.5.6. Egypt
- 10.2.1. North America
- 10.3. Market Analysis, Insights and Forecast - by Market Player Ranking
- 10.1. Market Analysis, Insights and Forecast - by Type
- 11. North America Solar Photovoltaic Wafer Industry Analysis, Insights and Forecast, 2019-2031
- 11.1. Market Analysis, Insights and Forecast - By Country/Sub-region
- 11.1.1 United States
- 11.1.2 Canada
- 11.1.3 Mexico
- 12. Europe Solar Photovoltaic Wafer Industry Analysis, Insights and Forecast, 2019-2031
- 12.1. Market Analysis, Insights and Forecast - By Country/Sub-region
- 12.1.1 Germany
- 12.1.2 United Kingdom
- 12.1.3 France
- 12.1.4 Spain
- 12.1.5 Italy
- 12.1.6 Spain
- 12.1.7 Belgium
- 12.1.8 Netherland
- 12.1.9 Nordics
- 12.1.10 Rest of Europe
- 13. Asia Pacific Solar Photovoltaic Wafer Industry Analysis, Insights and Forecast, 2019-2031
- 13.1. Market Analysis, Insights and Forecast - By Country/Sub-region
- 13.1.1 China
- 13.1.2 Japan
- 13.1.3 India
- 13.1.4 South Korea
- 13.1.5 Southeast Asia
- 13.1.6 Australia
- 13.1.7 Indonesia
- 13.1.8 Phillipes
- 13.1.9 Singapore
- 13.1.10 Thailandc
- 13.1.11 Rest of Asia Pacific
- 14. South America Solar Photovoltaic Wafer Industry Analysis, Insights and Forecast, 2019-2031
- 14.1. Market Analysis, Insights and Forecast - By Country/Sub-region
- 14.1.1 Brazil
- 14.1.2 Argentina
- 14.1.3 Peru
- 14.1.4 Chile
- 14.1.5 Colombia
- 14.1.6 Ecuador
- 14.1.7 Venezuela
- 14.1.8 Rest of South America
- 15. MEA Solar Photovoltaic Wafer Industry Analysis, Insights and Forecast, 2019-2031
- 15.1. Market Analysis, Insights and Forecast - By Country/Sub-region
- 15.1.1 United Arab Emirates
- 15.1.2 Saudi Arabia
- 15.1.3 South Africa
- 15.1.4 Rest of Middle East and Africa
- 16. Competitive Analysis
- 16.1. Global Market Share Analysis 2024
- 16.2. Company Profiles
- 16.2.1 Targray Technology International Inc
- 16.2.1.1. Overview
- 16.2.1.2. Products
- 16.2.1.3. SWOT Analysis
- 16.2.1.4. Recent Developments
- 16.2.1.5. Financials (Based on Availability)
- 16.2.2 Sino-American Silicon Products Inc
- 16.2.2.1. Overview
- 16.2.2.2. Products
- 16.2.2.3. SWOT Analysis
- 16.2.2.4. Recent Developments
- 16.2.2.5. Financials (Based on Availability)
- 16.2.3 CETC Solar Energy Holdings Co
- 16.2.3.1. Overview
- 16.2.3.2. Products
- 16.2.3.3. SWOT Analysis
- 16.2.3.4. Recent Developments
- 16.2.3.5. Financials (Based on Availability)
- 16.2.4 GCL-Poly Energy Holdings Limited
- 16.2.4.1. Overview
- 16.2.4.2. Products
- 16.2.4.3. SWOT Analysis
- 16.2.4.4. Recent Developments
- 16.2.4.5. Financials (Based on Availability)
- 16.2.5 Renewable Energy Corporation
- 16.2.5.1. Overview
- 16.2.5.2. Products
- 16.2.5.3. SWOT Analysis
- 16.2.5.4. Recent Developments
- 16.2.5.5. Financials (Based on Availability)
- 16.2.6 Jinko Solar Holding Co Ltd
- 16.2.6.1. Overview
- 16.2.6.2. Products
- 16.2.6.3. SWOT Analysis
- 16.2.6.4. Recent Developments
- 16.2.6.5. Financials (Based on Availability)
- 16.2.7 JA Solar Holdings Co Ltd
- 16.2.7.1. Overview
- 16.2.7.2. Products
- 16.2.7.3. SWOT Analysis
- 16.2.7.4. Recent Developments
- 16.2.7.5. Financials (Based on Availability)
- 16.2.8 LONGi Green Energy Technology Co Ltd
- 16.2.8.1. Overview
- 16.2.8.2. Products
- 16.2.8.3. SWOT Analysis
- 16.2.8.4. Recent Developments
- 16.2.8.5. Financials (Based on Availability)
- 16.2.1 Targray Technology International Inc
List of Figures
- Figure 1: Global Solar Photovoltaic Wafer Industry Revenue Breakdown (Million, %) by Region 2024 & 2032
- Figure 2: North America Solar Photovoltaic Wafer Industry Revenue (Million), by Country 2024 & 2032
- Figure 3: North America Solar Photovoltaic Wafer Industry Revenue Share (%), by Country 2024 & 2032
- Figure 4: Europe Solar Photovoltaic Wafer Industry Revenue (Million), by Country 2024 & 2032
- Figure 5: Europe Solar Photovoltaic Wafer Industry Revenue Share (%), by Country 2024 & 2032
- Figure 6: Asia Pacific Solar Photovoltaic Wafer Industry Revenue (Million), by Country 2024 & 2032
- Figure 7: Asia Pacific Solar Photovoltaic Wafer Industry Revenue Share (%), by Country 2024 & 2032
- Figure 8: South America Solar Photovoltaic Wafer Industry Revenue (Million), by Country 2024 & 2032
- Figure 9: South America Solar Photovoltaic Wafer Industry Revenue Share (%), by Country 2024 & 2032
- Figure 10: MEA Solar Photovoltaic Wafer Industry Revenue (Million), by Country 2024 & 2032
- Figure 11: MEA Solar Photovoltaic Wafer Industry Revenue Share (%), by Country 2024 & 2032
- Figure 12: North America Solar Photovoltaic Wafer Industry Revenue (Million), by Type 2024 & 2032
- Figure 13: North America Solar Photovoltaic Wafer Industry Revenue Share (%), by Type 2024 & 2032
- Figure 14: North America Solar Photovoltaic Wafer Industry Revenue (Million), by Geogrpahy 2024 & 2032
- Figure 15: North America Solar Photovoltaic Wafer Industry Revenue Share (%), by Geogrpahy 2024 & 2032
- Figure 16: North America Solar Photovoltaic Wafer Industry Revenue (Million), by Market Player Ranking 2024 & 2032
- Figure 17: North America Solar Photovoltaic Wafer Industry Revenue Share (%), by Market Player Ranking 2024 & 2032
- Figure 18: North America Solar Photovoltaic Wafer Industry Revenue (Million), by Country 2024 & 2032
- Figure 19: North America Solar Photovoltaic Wafer Industry Revenue Share (%), by Country 2024 & 2032
- Figure 20: South America Solar Photovoltaic Wafer Industry Revenue (Million), by Type 2024 & 2032
- Figure 21: South America Solar Photovoltaic Wafer Industry Revenue Share (%), by Type 2024 & 2032
- Figure 22: South America Solar Photovoltaic Wafer Industry Revenue (Million), by Geogrpahy 2024 & 2032
- Figure 23: South America Solar Photovoltaic Wafer Industry Revenue Share (%), by Geogrpahy 2024 & 2032
- Figure 24: South America Solar Photovoltaic Wafer Industry Revenue (Million), by Market Player Ranking 2024 & 2032
- Figure 25: South America Solar Photovoltaic Wafer Industry Revenue Share (%), by Market Player Ranking 2024 & 2032
- Figure 26: South America Solar Photovoltaic Wafer Industry Revenue (Million), by Country 2024 & 2032
- Figure 27: South America Solar Photovoltaic Wafer Industry Revenue Share (%), by Country 2024 & 2032
- Figure 28: Europe Solar Photovoltaic Wafer Industry Revenue (Million), by Type 2024 & 2032
- Figure 29: Europe Solar Photovoltaic Wafer Industry Revenue Share (%), by Type 2024 & 2032
- Figure 30: Europe Solar Photovoltaic Wafer Industry Revenue (Million), by Geogrpahy 2024 & 2032
- Figure 31: Europe Solar Photovoltaic Wafer Industry Revenue Share (%), by Geogrpahy 2024 & 2032
- Figure 32: Europe Solar Photovoltaic Wafer Industry Revenue (Million), by Market Player Ranking 2024 & 2032
- Figure 33: Europe Solar Photovoltaic Wafer Industry Revenue Share (%), by Market Player Ranking 2024 & 2032
- Figure 34: Europe Solar Photovoltaic Wafer Industry Revenue (Million), by Country 2024 & 2032
- Figure 35: Europe Solar Photovoltaic Wafer Industry Revenue Share (%), by Country 2024 & 2032
- Figure 36: Middle East & Africa Solar Photovoltaic Wafer Industry Revenue (Million), by Type 2024 & 2032
- Figure 37: Middle East & Africa Solar Photovoltaic Wafer Industry Revenue Share (%), by Type 2024 & 2032
- Figure 38: Middle East & Africa Solar Photovoltaic Wafer Industry Revenue (Million), by Geogrpahy 2024 & 2032
- Figure 39: Middle East & Africa Solar Photovoltaic Wafer Industry Revenue Share (%), by Geogrpahy 2024 & 2032
- Figure 40: Middle East & Africa Solar Photovoltaic Wafer Industry Revenue (Million), by Market Player Ranking 2024 & 2032
- Figure 41: Middle East & Africa Solar Photovoltaic Wafer Industry Revenue Share (%), by Market Player Ranking 2024 & 2032
- Figure 42: Middle East & Africa Solar Photovoltaic Wafer Industry Revenue (Million), by Country 2024 & 2032
- Figure 43: Middle East & Africa Solar Photovoltaic Wafer Industry Revenue Share (%), by Country 2024 & 2032
- Figure 44: Asia Pacific Solar Photovoltaic Wafer Industry Revenue (Million), by Type 2024 & 2032
- Figure 45: Asia Pacific Solar Photovoltaic Wafer Industry Revenue Share (%), by Type 2024 & 2032
- Figure 46: Asia Pacific Solar Photovoltaic Wafer Industry Revenue (Million), by Geogrpahy 2024 & 2032
- Figure 47: Asia Pacific Solar Photovoltaic Wafer Industry Revenue Share (%), by Geogrpahy 2024 & 2032
- Figure 48: Asia Pacific Solar Photovoltaic Wafer Industry Revenue (Million), by Market Player Ranking 2024 & 2032
- Figure 49: Asia Pacific Solar Photovoltaic Wafer Industry Revenue Share (%), by Market Player Ranking 2024 & 2032
- Figure 50: Asia Pacific Solar Photovoltaic Wafer Industry Revenue (Million), by Country 2024 & 2032
- Figure 51: Asia Pacific Solar Photovoltaic Wafer Industry Revenue Share (%), by Country 2024 & 2032
List of Tables
- Table 1: Global Solar Photovoltaic Wafer Industry Revenue Million Forecast, by Region 2019 & 2032
- Table 2: Global Solar Photovoltaic Wafer Industry Revenue Million Forecast, by Type 2019 & 2032
- Table 3: Global Solar Photovoltaic Wafer Industry Revenue Million Forecast, by Geogrpahy 2019 & 2032
- Table 4: Global Solar Photovoltaic Wafer Industry Revenue Million Forecast, by Market Player Ranking 2019 & 2032
- Table 5: Global Solar Photovoltaic Wafer Industry Revenue Million Forecast, by Region 2019 & 2032
- Table 6: Global Solar Photovoltaic Wafer Industry Revenue Million Forecast, by Country 2019 & 2032
- Table 7: United States Solar Photovoltaic Wafer Industry Revenue (Million) Forecast, by Application 2019 & 2032
- Table 8: Canada Solar Photovoltaic Wafer Industry Revenue (Million) Forecast, by Application 2019 & 2032
- Table 9: Mexico Solar Photovoltaic Wafer Industry Revenue (Million) Forecast, by Application 2019 & 2032
- Table 10: Global Solar Photovoltaic Wafer Industry Revenue Million Forecast, by Country 2019 & 2032
- Table 11: Germany Solar Photovoltaic Wafer Industry Revenue (Million) Forecast, by Application 2019 & 2032
- Table 12: United Kingdom Solar Photovoltaic Wafer Industry Revenue (Million) Forecast, by Application 2019 & 2032
- Table 13: France Solar Photovoltaic Wafer Industry Revenue (Million) Forecast, by Application 2019 & 2032
- Table 14: Spain Solar Photovoltaic Wafer Industry Revenue (Million) Forecast, by Application 2019 & 2032
- Table 15: Italy Solar Photovoltaic Wafer Industry Revenue (Million) Forecast, by Application 2019 & 2032
- Table 16: Spain Solar Photovoltaic Wafer Industry Revenue (Million) Forecast, by Application 2019 & 2032
- Table 17: Belgium Solar Photovoltaic Wafer Industry Revenue (Million) Forecast, by Application 2019 & 2032
- Table 18: Netherland Solar Photovoltaic Wafer Industry Revenue (Million) Forecast, by Application 2019 & 2032
- Table 19: Nordics Solar Photovoltaic Wafer Industry Revenue (Million) Forecast, by Application 2019 & 2032
- Table 20: Rest of Europe Solar Photovoltaic Wafer Industry Revenue (Million) Forecast, by Application 2019 & 2032
- Table 21: Global Solar Photovoltaic Wafer Industry Revenue Million Forecast, by Country 2019 & 2032
- Table 22: China Solar Photovoltaic Wafer Industry Revenue (Million) Forecast, by Application 2019 & 2032
- Table 23: Japan Solar Photovoltaic Wafer Industry Revenue (Million) Forecast, by Application 2019 & 2032
- Table 24: India Solar Photovoltaic Wafer Industry Revenue (Million) Forecast, by Application 2019 & 2032
- Table 25: South Korea Solar Photovoltaic Wafer Industry Revenue (Million) Forecast, by Application 2019 & 2032
- Table 26: Southeast Asia Solar Photovoltaic Wafer Industry Revenue (Million) Forecast, by Application 2019 & 2032
- Table 27: Australia Solar Photovoltaic Wafer Industry Revenue (Million) Forecast, by Application 2019 & 2032
- Table 28: Indonesia Solar Photovoltaic Wafer Industry Revenue (Million) Forecast, by Application 2019 & 2032
- Table 29: Phillipes Solar Photovoltaic Wafer Industry Revenue (Million) Forecast, by Application 2019 & 2032
- Table 30: Singapore Solar Photovoltaic Wafer Industry Revenue (Million) Forecast, by Application 2019 & 2032
- Table 31: Thailandc Solar Photovoltaic Wafer Industry Revenue (Million) Forecast, by Application 2019 & 2032
- Table 32: Rest of Asia Pacific Solar Photovoltaic Wafer Industry Revenue (Million) Forecast, by Application 2019 & 2032
- Table 33: Global Solar Photovoltaic Wafer Industry Revenue Million Forecast, by Country 2019 & 2032
- Table 34: Brazil Solar Photovoltaic Wafer Industry Revenue (Million) Forecast, by Application 2019 & 2032
- Table 35: Argentina Solar Photovoltaic Wafer Industry Revenue (Million) Forecast, by Application 2019 & 2032
- Table 36: Peru Solar Photovoltaic Wafer Industry Revenue (Million) Forecast, by Application 2019 & 2032
- Table 37: Chile Solar Photovoltaic Wafer Industry Revenue (Million) Forecast, by Application 2019 & 2032
- Table 38: Colombia Solar Photovoltaic Wafer Industry Revenue (Million) Forecast, by Application 2019 & 2032
- Table 39: Ecuador Solar Photovoltaic Wafer Industry Revenue (Million) Forecast, by Application 2019 & 2032
- Table 40: Venezuela Solar Photovoltaic Wafer Industry Revenue (Million) Forecast, by Application 2019 & 2032
- Table 41: Rest of South America Solar Photovoltaic Wafer Industry Revenue (Million) Forecast, by Application 2019 & 2032
- Table 42: Global Solar Photovoltaic Wafer Industry Revenue Million Forecast, by Country 2019 & 2032
- Table 43: United Arab Emirates Solar Photovoltaic Wafer Industry Revenue (Million) Forecast, by Application 2019 & 2032
- Table 44: Saudi Arabia Solar Photovoltaic Wafer Industry Revenue (Million) Forecast, by Application 2019 & 2032
- Table 45: South Africa Solar Photovoltaic Wafer Industry Revenue (Million) Forecast, by Application 2019 & 2032
- Table 46: Rest of Middle East and Africa Solar Photovoltaic Wafer Industry Revenue (Million) Forecast, by Application 2019 & 2032
- Table 47: Global Solar Photovoltaic Wafer Industry Revenue Million Forecast, by Type 2019 & 2032
- Table 48: Global Solar Photovoltaic Wafer Industry Revenue Million Forecast, by Geogrpahy 2019 & 2032
- Table 49: Global Solar Photovoltaic Wafer Industry Revenue Million Forecast, by Market Player Ranking 2019 & 2032
- Table 50: Global Solar Photovoltaic Wafer Industry Revenue Million Forecast, by Country 2019 & 2032
- Table 51: United States Solar Photovoltaic Wafer Industry Revenue (Million) Forecast, by Application 2019 & 2032
- Table 52: Canada Solar Photovoltaic Wafer Industry Revenue (Million) Forecast, by Application 2019 & 2032
- Table 53: Mexico Solar Photovoltaic Wafer Industry Revenue (Million) Forecast, by Application 2019 & 2032
- Table 54: Global Solar Photovoltaic Wafer Industry Revenue Million Forecast, by Type 2019 & 2032
- Table 55: Global Solar Photovoltaic Wafer Industry Revenue Million Forecast, by Geogrpahy 2019 & 2032
- Table 56: Global Solar Photovoltaic Wafer Industry Revenue Million Forecast, by Market Player Ranking 2019 & 2032
- Table 57: Global Solar Photovoltaic Wafer Industry Revenue Million Forecast, by Country 2019 & 2032
- Table 58: Brazil Solar Photovoltaic Wafer Industry Revenue (Million) Forecast, by Application 2019 & 2032
- Table 59: Argentina Solar Photovoltaic Wafer Industry Revenue (Million) Forecast, by Application 2019 & 2032
- Table 60: Rest of South America Solar Photovoltaic Wafer Industry Revenue (Million) Forecast, by Application 2019 & 2032
- Table 61: Global Solar Photovoltaic Wafer Industry Revenue Million Forecast, by Type 2019 & 2032
- Table 62: Global Solar Photovoltaic Wafer Industry Revenue Million Forecast, by Geogrpahy 2019 & 2032
- Table 63: Global Solar Photovoltaic Wafer Industry Revenue Million Forecast, by Market Player Ranking 2019 & 2032
- Table 64: Global Solar Photovoltaic Wafer Industry Revenue Million Forecast, by Country 2019 & 2032
- Table 65: United Kingdom Solar Photovoltaic Wafer Industry Revenue (Million) Forecast, by Application 2019 & 2032
- Table 66: Germany Solar Photovoltaic Wafer Industry Revenue (Million) Forecast, by Application 2019 & 2032
- Table 67: France Solar Photovoltaic Wafer Industry Revenue (Million) Forecast, by Application 2019 & 2032
- Table 68: Italy Solar Photovoltaic Wafer Industry Revenue (Million) Forecast, by Application 2019 & 2032
- Table 69: Spain Solar Photovoltaic Wafer Industry Revenue (Million) Forecast, by Application 2019 & 2032
- Table 70: Russia Solar Photovoltaic Wafer Industry Revenue (Million) Forecast, by Application 2019 & 2032
- Table 71: Benelux Solar Photovoltaic Wafer Industry Revenue (Million) Forecast, by Application 2019 & 2032
- Table 72: Nordics Solar Photovoltaic Wafer Industry Revenue (Million) Forecast, by Application 2019 & 2032
- Table 73: Rest of Europe Solar Photovoltaic Wafer Industry Revenue (Million) Forecast, by Application 2019 & 2032
- Table 74: Global Solar Photovoltaic Wafer Industry Revenue Million Forecast, by Type 2019 & 2032
- Table 75: Global Solar Photovoltaic Wafer Industry Revenue Million Forecast, by Geogrpahy 2019 & 2032
- Table 76: Global Solar Photovoltaic Wafer Industry Revenue Million Forecast, by Market Player Ranking 2019 & 2032
- Table 77: Global Solar Photovoltaic Wafer Industry Revenue Million Forecast, by Country 2019 & 2032
- Table 78: Turkey Solar Photovoltaic Wafer Industry Revenue (Million) Forecast, by Application 2019 & 2032
- Table 79: Israel Solar Photovoltaic Wafer Industry Revenue (Million) Forecast, by Application 2019 & 2032
- Table 80: GCC Solar Photovoltaic Wafer Industry Revenue (Million) Forecast, by Application 2019 & 2032
- Table 81: North Africa Solar Photovoltaic Wafer Industry Revenue (Million) Forecast, by Application 2019 & 2032
- Table 82: South Africa Solar Photovoltaic Wafer Industry Revenue (Million) Forecast, by Application 2019 & 2032
- Table 83: Rest of Middle East & Africa Solar Photovoltaic Wafer Industry Revenue (Million) Forecast, by Application 2019 & 2032
- Table 84: Global Solar Photovoltaic Wafer Industry Revenue Million Forecast, by Type 2019 & 2032
- Table 85: Global Solar Photovoltaic Wafer Industry Revenue Million Forecast, by Geogrpahy 2019 & 2032
- Table 86: Global Solar Photovoltaic Wafer Industry Revenue Million Forecast, by Market Player Ranking 2019 & 2032
- Table 87: Global Solar Photovoltaic Wafer Industry Revenue Million Forecast, by Country 2019 & 2032
- Table 88: China Solar Photovoltaic Wafer Industry Revenue (Million) Forecast, by Application 2019 & 2032
- Table 89: India Solar Photovoltaic Wafer Industry Revenue (Million) Forecast, by Application 2019 & 2032
- Table 90: Japan Solar Photovoltaic Wafer Industry Revenue (Million) Forecast, by Application 2019 & 2032
- Table 91: South Korea Solar Photovoltaic Wafer Industry Revenue (Million) Forecast, by Application 2019 & 2032
- Table 92: ASEAN Solar Photovoltaic Wafer Industry Revenue (Million) Forecast, by Application 2019 & 2032
- Table 93: Oceania Solar Photovoltaic Wafer Industry Revenue (Million) Forecast, by Application 2019 & 2032
- Table 94: Rest of Asia Pacific Solar Photovoltaic Wafer Industry Revenue (Million) Forecast, by Application 2019 & 2032
Frequently Asked Questions
1. What is the projected Compound Annual Growth Rate (CAGR) of the Solar Photovoltaic Wafer Industry?
The projected CAGR is approximately 13.90%.
2. Which companies are prominent players in the Solar Photovoltaic Wafer Industry?
Key companies in the market include Targray Technology International Inc, Sino-American Silicon Products Inc, CETC Solar Energy Holdings Co, GCL-Poly Energy Holdings Limited, Renewable Energy Corporation, Jinko Solar Holding Co Ltd, JA Solar Holdings Co Ltd, LONGi Green Energy Technology Co Ltd.
3. What are the main segments of the Solar Photovoltaic Wafer Industry?
The market segments include Type, Geogrpahy, Market Player Ranking.
4. Can you provide details about the market size?
The market size is estimated to be USD 14.58 Million as of 2022.
5. What are some drivers contributing to market growth?
4.; Increasing Demand for Renewable Energy4.; Supportive Government Policies.
6. What are the notable trends driving market growth?
Monocrystalline Solar Photovoltaic Wafer is Expected to Dominate the Market.
7. Are there any restraints impacting market growth?
4.; High Cost Compared to Alternatives like Thin Films.
8. Can you provide examples of recent developments in the market?
In June 2023, Solar Wafer manufacturer NexdWafe GmbH secured USD 32 million contract from a group of investors including Reliance New Energy to accelerate the construction of its first commercial scla green solar wafers production facility in Germany Bitterfield.
9. What pricing options are available for accessing the report?
Pricing options include single-user, multi-user, and enterprise licenses priced at USD 4750, USD 5250, and USD 8750 respectively.
10. Is the market size provided in terms of value or volume?
The market size is provided in terms of value, measured in Million.
11. Are there any specific market keywords associated with the report?
Yes, the market keyword associated with the report is "Solar Photovoltaic Wafer Industry," which aids in identifying and referencing the specific market segment covered.
12. How do I determine which pricing option suits my needs best?
The pricing options vary based on user requirements and access needs. Individual users may opt for single-user licenses, while businesses requiring broader access may choose multi-user or enterprise licenses for cost-effective access to the report.
13. Are there any additional resources or data provided in the Solar Photovoltaic Wafer Industry report?
While the report offers comprehensive insights, it's advisable to review the specific contents or supplementary materials provided to ascertain if additional resources or data are available.
14. How can I stay updated on further developments or reports in the Solar Photovoltaic Wafer Industry?
To stay informed about further developments, trends, and reports in the Solar Photovoltaic Wafer Industry, consider subscribing to industry newsletters, following relevant companies and organizations, or regularly checking reputable industry news sources and publications.
Methodology
Step 1 - Identification of Relevant Samples Size from Population Database


Step 2 - Approaches for Defining Global Market Size (Value, Volume* & Price*)

Note*: In applicable scenarios
Step 3 - Data Sources
Primary Research
- Web Analytics
- Survey Reports
- Research Institute
- Latest Research Reports
- Opinion Leaders
Secondary Research
- Annual Reports
- White Paper
- Latest Press Release
- Industry Association
- Paid Database
- Investor Presentations

Step 4 - Data Triangulation
Involves using different sources of information in order to increase the validity of a study
These sources are likely to be stakeholders in a program - participants, other researchers, program staff, other community members, and so on.
Then we put all data in single framework & apply various statistical tools to find out the dynamic on the market.
During the analysis stage, feedback from the stakeholder groups would be compared to determine areas of agreement as well as areas of divergence


