
Key Insights
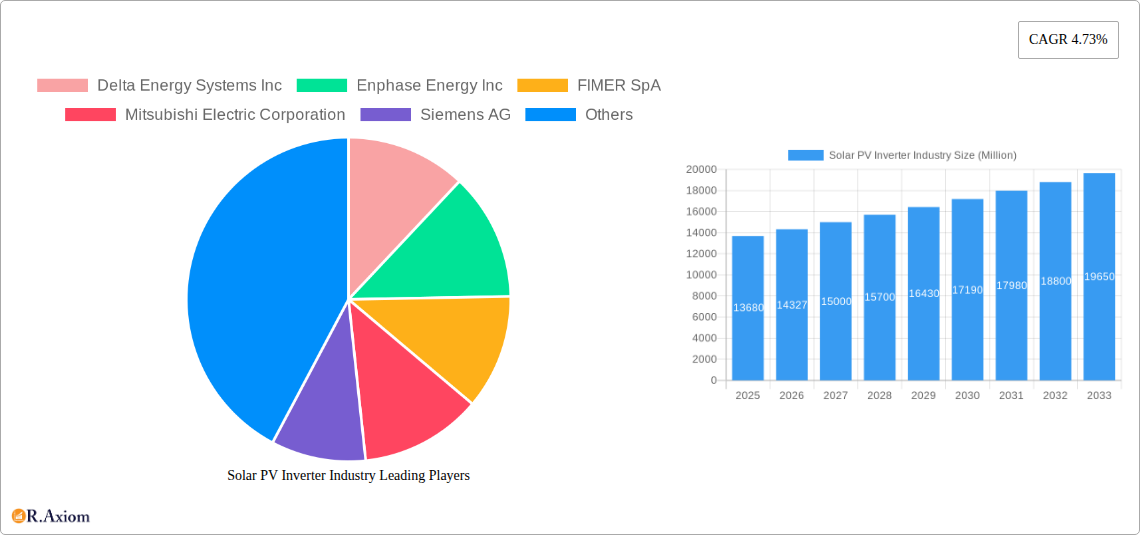
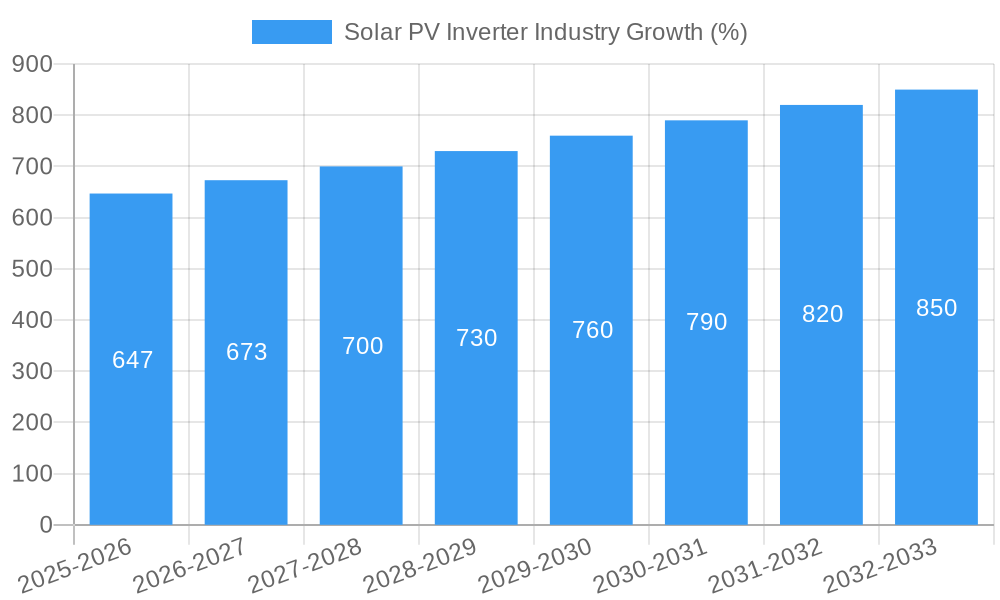
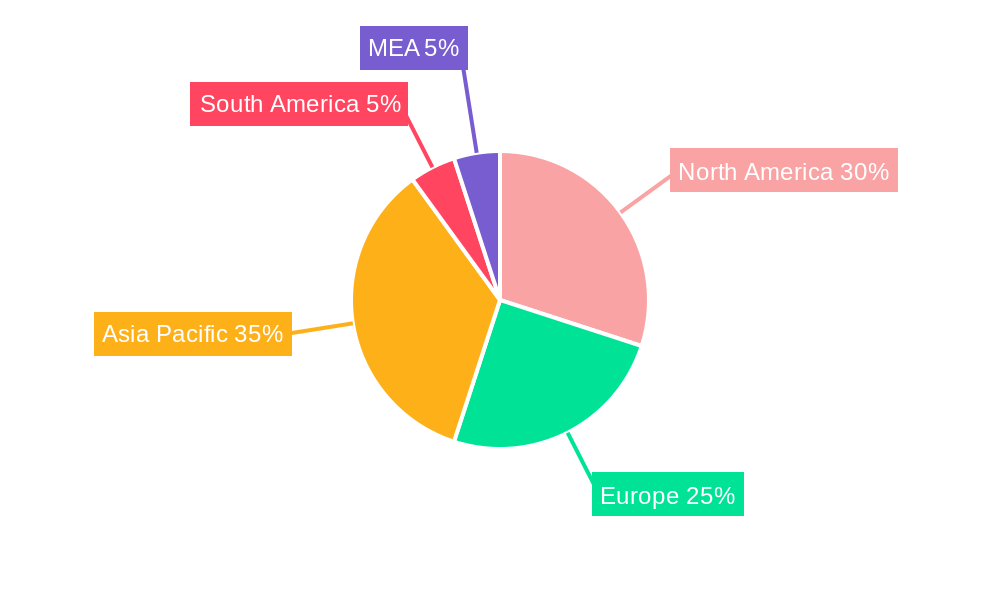
The global solar PV inverter market, valued at $13.68 billion in 2025, is projected to experience robust growth, driven by the increasing adoption of solar photovoltaic (PV) systems worldwide. A compound annual growth rate (CAGR) of 4.73% from 2025 to 2033 indicates a significant expansion, fueled by several key factors. The rising demand for renewable energy sources to combat climate change and achieve sustainability goals is a primary driver. Government incentives, supportive policies, and decreasing solar panel costs are further accelerating market growth. Technological advancements, leading to higher efficiency, improved reliability, and enhanced functionalities in inverters, are also contributing factors. The market is segmented by inverter type (central, string, micro) and application (residential, commercial & industrial, utility-scale), with string inverters currently dominating due to their cost-effectiveness and ease of installation. However, the microinverter segment is expected to witness significant growth due to its superior performance and monitoring capabilities. Geographically, North America, Europe, and Asia-Pacific are major markets, with China and the United States leading in demand. Continued growth in these regions, coupled with emerging markets in South America and the Middle East & Africa, will fuel the overall market expansion.
The competitive landscape is characterized by the presence of both established players and emerging companies. Key players such as Delta Energy Systems, Enphase Energy, SMA Solar Technology, and Huawei Technologies are actively engaged in product innovation, strategic partnerships, and market expansion initiatives. The increasing competition is likely to result in further technological advancements and price reductions, making solar PV systems more accessible to a wider range of consumers. However, potential restraints include the fluctuating prices of raw materials, grid infrastructure limitations in some regions, and concerns regarding the long-term reliability of inverters. Despite these challenges, the long-term outlook for the solar PV inverter market remains positive, driven by the global shift towards clean energy solutions.
This in-depth report provides a comprehensive analysis of the global solar PV inverter industry, offering invaluable insights for stakeholders across the value chain. With a detailed examination of market dynamics, competitive landscapes, and future projections, this report is essential for strategic decision-making. The study period covers 2019-2033, with 2025 as the base and estimated year. The forecast period is 2025-2033, and the historical period is 2019-2024. Expected market value projections are in Millions (USD).
Solar PV Inverter Industry Market Concentration & Innovation
This section analyzes the competitive landscape of the solar PV inverter industry, examining market concentration, innovation drivers, regulatory frameworks, and merger and acquisition (M&A) activities. The report assesses the market share of key players including Delta Energy Systems Inc, Enphase Energy Inc, FIMER SpA, Mitsubishi Electric Corporation, Siemens AG, Schneider Electric SE, Omron Corporation, Huawei Technologies Co Ltd, SolarEdge Technologies Inc, General Electric Company, and SMA Solar Technology AG. While the industry is characterized by a relatively high level of competition, several players hold significant market share. The report quantifies this concentration using metrics such as the Herfindahl-Hirschman Index (HHI) and market share distribution across top players. Innovation drivers include advancements in power electronics, the increasing adoption of smart inverters with advanced monitoring capabilities, and the integration of energy storage systems. Stringent regulatory frameworks concerning grid connection standards and safety regulations also influence market dynamics. The impact of product substitutes, such as microgrids and alternative energy solutions, is also assessed. Finally, an analysis of recent M&A activities, including deal values and their impact on market consolidation, is presented.
Solar PV Inverter Industry Industry Trends & Insights
This section delves into the key trends shaping the solar PV inverter market, including growth drivers, technological disruptions, consumer preferences, and competitive dynamics. The report projects a Compound Annual Growth Rate (CAGR) of xx% during the forecast period (2025-2033), driven by factors such as increasing renewable energy adoption, government incentives for solar power, and declining inverter costs. Technological advancements like the development of higher-efficiency inverters, advanced power electronics, and improved grid integration capabilities are significantly influencing the market. Consumer preferences are shifting towards smart inverters with advanced monitoring and control features, leading to increasing market penetration of these products. The report analyzes competitive strategies employed by key players, focusing on factors such as product differentiation, pricing strategies, and market expansion initiatives. The market penetration rate for various inverter types (central, string, micro) is analyzed, illustrating the shift in market preference.
Dominant Markets & Segments in Solar PV Inverter Industry
This section identifies the leading regions, countries, and segments within the solar PV inverter market. The analysis is categorized by inverter type (central, string, micro) and application (residential, commercial & industrial, utility-scale).
By Inverter Type: The report assesses the market share and growth prospects of central, string, and micro inverters. String inverters are currently dominating the market due to their cost-effectiveness and suitability for various applications. However, the growth of micro-inverters is expected to accelerate, driven by their advantages in performance, safety, and modularity.
By Application: The utility-scale segment is projected to witness significant growth, driven by the large-scale deployment of solar power plants globally. However, the residential and commercial & industrial segments also present considerable opportunities, fueled by increasing rooftop solar installations and government initiatives.
Key Drivers of Segment Dominance:
- Economic policies: Subsidies and tax incentives for solar installations are vital for market growth.
- Infrastructure development: Investments in grid infrastructure and smart grids support higher adoption rates.
- Technological advancements: Innovations in inverter technology improve efficiency and lower costs.
- Regulatory frameworks: Supportive government regulations and streamlined permitting processes ease the deployment of solar PV systems.
The report provides a detailed analysis of the dominant regions and countries, highlighting factors influencing their leadership positions.
Solar PV Inverter Industry Product Developments
Recent product innovations have focused on increasing efficiency, enhancing grid integration capabilities, and adding advanced monitoring features. The market is witnessing a shift towards higher power inverters, optimized for large-scale solar farms, and smart inverters, capable of integrating energy storage systems and providing grid services. The competitive advantage lies in offering inverters with superior efficiency, reliability, and advanced features that cater to the specific needs of the end users. Manufacturers are focusing on optimizing their product portfolios to serve various segments, including residential, commercial and industrial, and utility-scale applications.
Report Scope & Segmentation Analysis
This report segments the solar PV inverter market by inverter type (central, string, micro-inverters) and application (residential, commercial & industrial, utility-scale). Each segment is thoroughly analyzed, providing detailed market size estimations, growth projections, and competitive dynamics.
By Inverter Type:
- Central Inverters: This segment is expected to exhibit xx Million USD in market size by 2033, primarily driven by large-scale solar projects.
- String Inverters: This segment is predicted to reach xx Million USD by 2033, dominating the market due to cost-effectiveness and scalability.
- Micro Inverters: The micro-inverter market is projected to grow to xx Million USD by 2033, driven by enhanced safety and performance features.
By Application:
- Residential: The residential segment is expected to reach xx Million USD by 2033, driven by increasing home solar installations.
- Commercial & Industrial: This segment is projected to grow to xx Million USD by 2033, fuelled by industrial energy needs.
- Utility-Scale: The utility-scale segment is forecast to reach xx Million USD by 2033, benefiting from substantial solar power plant deployments.
Key Drivers of Solar PV Inverter Industry Growth
The growth of the solar PV inverter industry is fueled by several key factors. Firstly, the increasing global demand for renewable energy is a significant driver. Government policies and incentives for renewable energy adoption, including subsidies, tax breaks, and feed-in tariffs, are further boosting the market. Technological advancements resulting in higher efficiency, lower costs, and improved features in inverters are also propelling growth. Finally, the decreasing cost of solar panels and the rising awareness about environmental sustainability are enhancing market expansion.
Challenges in the Solar PV Inverter Industry Sector
The solar PV inverter industry faces several challenges. Supply chain disruptions can lead to material shortages and delays, impacting production and delivery times. Furthermore, intense competition from numerous players can lead to price wars and reduced profitability. Stringent regulatory requirements concerning safety, grid compliance, and environmental standards can impose added costs and complexities for manufacturers.
Emerging Opportunities in Solar PV Inverter Industry
Emerging opportunities exist in the integration of solar inverters with energy storage systems (ESS). This integration will offer enhanced grid stability and support for decentralized energy generation. The increasing demand for smart inverters with advanced monitoring and control features, especially in residential and commercial applications, represents a significant growth area. Furthermore, expansion into new markets with high solar irradiance and favorable policies offers substantial potential.
Leading Players in the Solar PV Inverter Industry Market
- Delta Energy Systems Inc
- Enphase Energy Inc
- FIMER SpA
- Mitsubishi Electric Corporation
- Siemens AG
- Schneider Electric SE
- Omron Corporation
- Huawei Technologies Co Ltd
- SolarEdge Technologies Inc
- General Electric Company
- SMA Solar Technology AG
Key Developments in Solar PV Inverter Industry Industry
- April 2022: SMA Solar Technology AG launched a new line of four inverters (12kW, 15kW, 20kW, and 25kW) for rooftop PV systems up to 135kW. This expands their product portfolio for the residential and commercial segments.
- May 2022: FIMER SpA supplied 1 MVA inverters to an 18MWh battery energy storage project in Gujarat, India, showcasing their capabilities in large-scale solar-plus-storage projects and expanding their presence in emerging markets.
Strategic Outlook for Solar PV Inverter Industry Market
The solar PV inverter market is poised for continued growth, driven by the increasing adoption of renewable energy globally. The focus on higher efficiency, enhanced grid integration, and smart inverter functionalities will shape future market trends. Expansion into emerging markets and strategic partnerships will be crucial for players to maintain a competitive edge. The integration of energy storage solutions with inverters represents a significant growth opportunity. The market outlook is positive, with significant potential for expansion in both developed and developing economies.
Solar PV Inverter Industry Segmentation
-
1. Inverter Type
- 1.1. Central Inverters
- 1.2. String Inverters
- 1.3. Micro Inverters
-
2. Application
- 2.1. Residential
- 2.2. Commercial and Industrial
- 2.3. Utility-scale
Solar PV Inverter Industry Segmentation By Geography
- 1. North America
- 2. Europe
- 3. Asia Pacific
- 4. South America
- 5. Middle East and Africa
Solar PV Inverter Industry REPORT HIGHLIGHTS
| Aspects | Details |
|---|---|
| Study Period | 2019-2033 |
| Base Year | 2024 |
| Estimated Year | 2025 |
| Forecast Period | 2025-2033 |
| Historical Period | 2019-2024 |
| Growth Rate | CAGR of 4.73% from 2019-2033 |
| Segmentation |
|
Table of Contents
- 1. Introduction
- 1.1. Research Scope
- 1.2. Market Segmentation
- 1.3. Research Methodology
- 1.4. Definitions and Assumptions
- 2. Executive Summary
- 2.1. Introduction
- 3. Market Dynamics
- 3.1. Introduction
- 3.2. Market Drivers
- 3.2.1. 4.; Supportive Government Initiatives4.; Investment in Electrification Using Solar Energy
- 3.3. Market Restrains
- 3.3.1 4.; Lack of General Awareness
- 3.3.2 Infrastructure Development Costs
- 3.3.3 and Recent Subsidy Cuts on Solar Panels
- 3.4. Market Trends
- 3.4.1. Central Inverters Segment Expected to Dominate the Market
- 4. Market Factor Analysis
- 4.1. Porters Five Forces
- 4.2. Supply/Value Chain
- 4.3. PESTEL analysis
- 4.4. Market Entropy
- 4.5. Patent/Trademark Analysis
- 5. Global Solar PV Inverter Industry Analysis, Insights and Forecast, 2019-2031
- 5.1. Market Analysis, Insights and Forecast - by Inverter Type
- 5.1.1. Central Inverters
- 5.1.2. String Inverters
- 5.1.3. Micro Inverters
- 5.2. Market Analysis, Insights and Forecast - by Application
- 5.2.1. Residential
- 5.2.2. Commercial and Industrial
- 5.2.3. Utility-scale
- 5.3. Market Analysis, Insights and Forecast - by Region
- 5.3.1. North America
- 5.3.2. Europe
- 5.3.3. Asia Pacific
- 5.3.4. South America
- 5.3.5. Middle East and Africa
- 5.1. Market Analysis, Insights and Forecast - by Inverter Type
- 6. North America Solar PV Inverter Industry Analysis, Insights and Forecast, 2019-2031
- 6.1. Market Analysis, Insights and Forecast - by Inverter Type
- 6.1.1. Central Inverters
- 6.1.2. String Inverters
- 6.1.3. Micro Inverters
- 6.2. Market Analysis, Insights and Forecast - by Application
- 6.2.1. Residential
- 6.2.2. Commercial and Industrial
- 6.2.3. Utility-scale
- 6.1. Market Analysis, Insights and Forecast - by Inverter Type
- 7. Europe Solar PV Inverter Industry Analysis, Insights and Forecast, 2019-2031
- 7.1. Market Analysis, Insights and Forecast - by Inverter Type
- 7.1.1. Central Inverters
- 7.1.2. String Inverters
- 7.1.3. Micro Inverters
- 7.2. Market Analysis, Insights and Forecast - by Application
- 7.2.1. Residential
- 7.2.2. Commercial and Industrial
- 7.2.3. Utility-scale
- 7.1. Market Analysis, Insights and Forecast - by Inverter Type
- 8. Asia Pacific Solar PV Inverter Industry Analysis, Insights and Forecast, 2019-2031
- 8.1. Market Analysis, Insights and Forecast - by Inverter Type
- 8.1.1. Central Inverters
- 8.1.2. String Inverters
- 8.1.3. Micro Inverters
- 8.2. Market Analysis, Insights and Forecast - by Application
- 8.2.1. Residential
- 8.2.2. Commercial and Industrial
- 8.2.3. Utility-scale
- 8.1. Market Analysis, Insights and Forecast - by Inverter Type
- 9. South America Solar PV Inverter Industry Analysis, Insights and Forecast, 2019-2031
- 9.1. Market Analysis, Insights and Forecast - by Inverter Type
- 9.1.1. Central Inverters
- 9.1.2. String Inverters
- 9.1.3. Micro Inverters
- 9.2. Market Analysis, Insights and Forecast - by Application
- 9.2.1. Residential
- 9.2.2. Commercial and Industrial
- 9.2.3. Utility-scale
- 9.1. Market Analysis, Insights and Forecast - by Inverter Type
- 10. Middle East and Africa Solar PV Inverter Industry Analysis, Insights and Forecast, 2019-2031
- 10.1. Market Analysis, Insights and Forecast - by Inverter Type
- 10.1.1. Central Inverters
- 10.1.2. String Inverters
- 10.1.3. Micro Inverters
- 10.2. Market Analysis, Insights and Forecast - by Application
- 10.2.1. Residential
- 10.2.2. Commercial and Industrial
- 10.2.3. Utility-scale
- 10.1. Market Analysis, Insights and Forecast - by Inverter Type
- 11. North America Solar PV Inverter Industry Analysis, Insights and Forecast, 2019-2031
- 11.1. Market Analysis, Insights and Forecast - By Country/Sub-region
- 11.1.1 United States
- 11.1.2 Canada
- 11.1.3 Mexico
- 12. Europe Solar PV Inverter Industry Analysis, Insights and Forecast, 2019-2031
- 12.1. Market Analysis, Insights and Forecast - By Country/Sub-region
- 12.1.1 Germany
- 12.1.2 United Kingdom
- 12.1.3 France
- 12.1.4 Spain
- 12.1.5 Italy
- 12.1.6 Spain
- 12.1.7 Belgium
- 12.1.8 Netherland
- 12.1.9 Nordics
- 12.1.10 Rest of Europe
- 13. Asia Pacific Solar PV Inverter Industry Analysis, Insights and Forecast, 2019-2031
- 13.1. Market Analysis, Insights and Forecast - By Country/Sub-region
- 13.1.1 China
- 13.1.2 Japan
- 13.1.3 India
- 13.1.4 South Korea
- 13.1.5 Southeast Asia
- 13.1.6 Australia
- 13.1.7 Indonesia
- 13.1.8 Phillipes
- 13.1.9 Singapore
- 13.1.10 Thailandc
- 13.1.11 Rest of Asia Pacific
- 14. South America Solar PV Inverter Industry Analysis, Insights and Forecast, 2019-2031
- 14.1. Market Analysis, Insights and Forecast - By Country/Sub-region
- 14.1.1 Brazil
- 14.1.2 Argentina
- 14.1.3 Peru
- 14.1.4 Chile
- 14.1.5 Colombia
- 14.1.6 Ecuador
- 14.1.7 Venezuela
- 14.1.8 Rest of South America
- 15. North America Solar PV Inverter Industry Analysis, Insights and Forecast, 2019-2031
- 15.1. Market Analysis, Insights and Forecast - By Country/Sub-region
- 15.1.1 United States
- 15.1.2 Canada
- 15.1.3 Mexico
- 16. MEA Solar PV Inverter Industry Analysis, Insights and Forecast, 2019-2031
- 16.1. Market Analysis, Insights and Forecast - By Country/Sub-region
- 16.1.1 United Arab Emirates
- 16.1.2 Saudi Arabia
- 16.1.3 South Africa
- 16.1.4 Rest of Middle East and Africa
- 17. Competitive Analysis
- 17.1. Global Market Share Analysis 2024
- 17.2. Company Profiles
- 17.2.1 Delta Energy Systems Inc
- 17.2.1.1. Overview
- 17.2.1.2. Products
- 17.2.1.3. SWOT Analysis
- 17.2.1.4. Recent Developments
- 17.2.1.5. Financials (Based on Availability)
- 17.2.2 Enphase Energy Inc
- 17.2.2.1. Overview
- 17.2.2.2. Products
- 17.2.2.3. SWOT Analysis
- 17.2.2.4. Recent Developments
- 17.2.2.5. Financials (Based on Availability)
- 17.2.3 FIMER SpA
- 17.2.3.1. Overview
- 17.2.3.2. Products
- 17.2.3.3. SWOT Analysis
- 17.2.3.4. Recent Developments
- 17.2.3.5. Financials (Based on Availability)
- 17.2.4 Mitsubishi Electric Corporation
- 17.2.4.1. Overview
- 17.2.4.2. Products
- 17.2.4.3. SWOT Analysis
- 17.2.4.4. Recent Developments
- 17.2.4.5. Financials (Based on Availability)
- 17.2.5 Siemens AG
- 17.2.5.1. Overview
- 17.2.5.2. Products
- 17.2.5.3. SWOT Analysis
- 17.2.5.4. Recent Developments
- 17.2.5.5. Financials (Based on Availability)
- 17.2.6 Schneider Electric SE
- 17.2.6.1. Overview
- 17.2.6.2. Products
- 17.2.6.3. SWOT Analysis
- 17.2.6.4. Recent Developments
- 17.2.6.5. Financials (Based on Availability)
- 17.2.7 Omron Corporation
- 17.2.7.1. Overview
- 17.2.7.2. Products
- 17.2.7.3. SWOT Analysis
- 17.2.7.4. Recent Developments
- 17.2.7.5. Financials (Based on Availability)
- 17.2.8 Huawei Technologies Co Ltd*List Not Exhaustive
- 17.2.8.1. Overview
- 17.2.8.2. Products
- 17.2.8.3. SWOT Analysis
- 17.2.8.4. Recent Developments
- 17.2.8.5. Financials (Based on Availability)
- 17.2.9 SolarEdge Technologies Inc
- 17.2.9.1. Overview
- 17.2.9.2. Products
- 17.2.9.3. SWOT Analysis
- 17.2.9.4. Recent Developments
- 17.2.9.5. Financials (Based on Availability)
- 17.2.10 General Electric Company
- 17.2.10.1. Overview
- 17.2.10.2. Products
- 17.2.10.3. SWOT Analysis
- 17.2.10.4. Recent Developments
- 17.2.10.5. Financials (Based on Availability)
- 17.2.11 SMA Solar Technology AG
- 17.2.11.1. Overview
- 17.2.11.2. Products
- 17.2.11.3. SWOT Analysis
- 17.2.11.4. Recent Developments
- 17.2.11.5. Financials (Based on Availability)
- 17.2.1 Delta Energy Systems Inc
List of Figures
- Figure 1: Global Solar PV Inverter Industry Revenue Breakdown (Million, %) by Region 2024 & 2032
- Figure 2: Global Solar PV Inverter Industry Volume Breakdown (K Unit, %) by Region 2024 & 2032
- Figure 3: North America Solar PV Inverter Industry Revenue (Million), by Country 2024 & 2032
- Figure 4: North America Solar PV Inverter Industry Volume (K Unit), by Country 2024 & 2032
- Figure 5: North America Solar PV Inverter Industry Revenue Share (%), by Country 2024 & 2032
- Figure 6: North America Solar PV Inverter Industry Volume Share (%), by Country 2024 & 2032
- Figure 7: Europe Solar PV Inverter Industry Revenue (Million), by Country 2024 & 2032
- Figure 8: Europe Solar PV Inverter Industry Volume (K Unit), by Country 2024 & 2032
- Figure 9: Europe Solar PV Inverter Industry Revenue Share (%), by Country 2024 & 2032
- Figure 10: Europe Solar PV Inverter Industry Volume Share (%), by Country 2024 & 2032
- Figure 11: Asia Pacific Solar PV Inverter Industry Revenue (Million), by Country 2024 & 2032
- Figure 12: Asia Pacific Solar PV Inverter Industry Volume (K Unit), by Country 2024 & 2032
- Figure 13: Asia Pacific Solar PV Inverter Industry Revenue Share (%), by Country 2024 & 2032
- Figure 14: Asia Pacific Solar PV Inverter Industry Volume Share (%), by Country 2024 & 2032
- Figure 15: South America Solar PV Inverter Industry Revenue (Million), by Country 2024 & 2032
- Figure 16: South America Solar PV Inverter Industry Volume (K Unit), by Country 2024 & 2032
- Figure 17: South America Solar PV Inverter Industry Revenue Share (%), by Country 2024 & 2032
- Figure 18: South America Solar PV Inverter Industry Volume Share (%), by Country 2024 & 2032
- Figure 19: North America Solar PV Inverter Industry Revenue (Million), by Country 2024 & 2032
- Figure 20: North America Solar PV Inverter Industry Volume (K Unit), by Country 2024 & 2032
- Figure 21: North America Solar PV Inverter Industry Revenue Share (%), by Country 2024 & 2032
- Figure 22: North America Solar PV Inverter Industry Volume Share (%), by Country 2024 & 2032
- Figure 23: MEA Solar PV Inverter Industry Revenue (Million), by Country 2024 & 2032
- Figure 24: MEA Solar PV Inverter Industry Volume (K Unit), by Country 2024 & 2032
- Figure 25: MEA Solar PV Inverter Industry Revenue Share (%), by Country 2024 & 2032
- Figure 26: MEA Solar PV Inverter Industry Volume Share (%), by Country 2024 & 2032
- Figure 27: North America Solar PV Inverter Industry Revenue (Million), by Inverter Type 2024 & 2032
- Figure 28: North America Solar PV Inverter Industry Volume (K Unit), by Inverter Type 2024 & 2032
- Figure 29: North America Solar PV Inverter Industry Revenue Share (%), by Inverter Type 2024 & 2032
- Figure 30: North America Solar PV Inverter Industry Volume Share (%), by Inverter Type 2024 & 2032
- Figure 31: North America Solar PV Inverter Industry Revenue (Million), by Application 2024 & 2032
- Figure 32: North America Solar PV Inverter Industry Volume (K Unit), by Application 2024 & 2032
- Figure 33: North America Solar PV Inverter Industry Revenue Share (%), by Application 2024 & 2032
- Figure 34: North America Solar PV Inverter Industry Volume Share (%), by Application 2024 & 2032
- Figure 35: North America Solar PV Inverter Industry Revenue (Million), by Country 2024 & 2032
- Figure 36: North America Solar PV Inverter Industry Volume (K Unit), by Country 2024 & 2032
- Figure 37: North America Solar PV Inverter Industry Revenue Share (%), by Country 2024 & 2032
- Figure 38: North America Solar PV Inverter Industry Volume Share (%), by Country 2024 & 2032
- Figure 39: Europe Solar PV Inverter Industry Revenue (Million), by Inverter Type 2024 & 2032
- Figure 40: Europe Solar PV Inverter Industry Volume (K Unit), by Inverter Type 2024 & 2032
- Figure 41: Europe Solar PV Inverter Industry Revenue Share (%), by Inverter Type 2024 & 2032
- Figure 42: Europe Solar PV Inverter Industry Volume Share (%), by Inverter Type 2024 & 2032
- Figure 43: Europe Solar PV Inverter Industry Revenue (Million), by Application 2024 & 2032
- Figure 44: Europe Solar PV Inverter Industry Volume (K Unit), by Application 2024 & 2032
- Figure 45: Europe Solar PV Inverter Industry Revenue Share (%), by Application 2024 & 2032
- Figure 46: Europe Solar PV Inverter Industry Volume Share (%), by Application 2024 & 2032
- Figure 47: Europe Solar PV Inverter Industry Revenue (Million), by Country 2024 & 2032
- Figure 48: Europe Solar PV Inverter Industry Volume (K Unit), by Country 2024 & 2032
- Figure 49: Europe Solar PV Inverter Industry Revenue Share (%), by Country 2024 & 2032
- Figure 50: Europe Solar PV Inverter Industry Volume Share (%), by Country 2024 & 2032
- Figure 51: Asia Pacific Solar PV Inverter Industry Revenue (Million), by Inverter Type 2024 & 2032
- Figure 52: Asia Pacific Solar PV Inverter Industry Volume (K Unit), by Inverter Type 2024 & 2032
- Figure 53: Asia Pacific Solar PV Inverter Industry Revenue Share (%), by Inverter Type 2024 & 2032
- Figure 54: Asia Pacific Solar PV Inverter Industry Volume Share (%), by Inverter Type 2024 & 2032
- Figure 55: Asia Pacific Solar PV Inverter Industry Revenue (Million), by Application 2024 & 2032
- Figure 56: Asia Pacific Solar PV Inverter Industry Volume (K Unit), by Application 2024 & 2032
- Figure 57: Asia Pacific Solar PV Inverter Industry Revenue Share (%), by Application 2024 & 2032
- Figure 58: Asia Pacific Solar PV Inverter Industry Volume Share (%), by Application 2024 & 2032
- Figure 59: Asia Pacific Solar PV Inverter Industry Revenue (Million), by Country 2024 & 2032
- Figure 60: Asia Pacific Solar PV Inverter Industry Volume (K Unit), by Country 2024 & 2032
- Figure 61: Asia Pacific Solar PV Inverter Industry Revenue Share (%), by Country 2024 & 2032
- Figure 62: Asia Pacific Solar PV Inverter Industry Volume Share (%), by Country 2024 & 2032
- Figure 63: South America Solar PV Inverter Industry Revenue (Million), by Inverter Type 2024 & 2032
- Figure 64: South America Solar PV Inverter Industry Volume (K Unit), by Inverter Type 2024 & 2032
- Figure 65: South America Solar PV Inverter Industry Revenue Share (%), by Inverter Type 2024 & 2032
- Figure 66: South America Solar PV Inverter Industry Volume Share (%), by Inverter Type 2024 & 2032
- Figure 67: South America Solar PV Inverter Industry Revenue (Million), by Application 2024 & 2032
- Figure 68: South America Solar PV Inverter Industry Volume (K Unit), by Application 2024 & 2032
- Figure 69: South America Solar PV Inverter Industry Revenue Share (%), by Application 2024 & 2032
- Figure 70: South America Solar PV Inverter Industry Volume Share (%), by Application 2024 & 2032
- Figure 71: South America Solar PV Inverter Industry Revenue (Million), by Country 2024 & 2032
- Figure 72: South America Solar PV Inverter Industry Volume (K Unit), by Country 2024 & 2032
- Figure 73: South America Solar PV Inverter Industry Revenue Share (%), by Country 2024 & 2032
- Figure 74: South America Solar PV Inverter Industry Volume Share (%), by Country 2024 & 2032
- Figure 75: Middle East and Africa Solar PV Inverter Industry Revenue (Million), by Inverter Type 2024 & 2032
- Figure 76: Middle East and Africa Solar PV Inverter Industry Volume (K Unit), by Inverter Type 2024 & 2032
- Figure 77: Middle East and Africa Solar PV Inverter Industry Revenue Share (%), by Inverter Type 2024 & 2032
- Figure 78: Middle East and Africa Solar PV Inverter Industry Volume Share (%), by Inverter Type 2024 & 2032
- Figure 79: Middle East and Africa Solar PV Inverter Industry Revenue (Million), by Application 2024 & 2032
- Figure 80: Middle East and Africa Solar PV Inverter Industry Volume (K Unit), by Application 2024 & 2032
- Figure 81: Middle East and Africa Solar PV Inverter Industry Revenue Share (%), by Application 2024 & 2032
- Figure 82: Middle East and Africa Solar PV Inverter Industry Volume Share (%), by Application 2024 & 2032
- Figure 83: Middle East and Africa Solar PV Inverter Industry Revenue (Million), by Country 2024 & 2032
- Figure 84: Middle East and Africa Solar PV Inverter Industry Volume (K Unit), by Country 2024 & 2032
- Figure 85: Middle East and Africa Solar PV Inverter Industry Revenue Share (%), by Country 2024 & 2032
- Figure 86: Middle East and Africa Solar PV Inverter Industry Volume Share (%), by Country 2024 & 2032
List of Tables
- Table 1: Global Solar PV Inverter Industry Revenue Million Forecast, by Region 2019 & 2032
- Table 2: Global Solar PV Inverter Industry Volume K Unit Forecast, by Region 2019 & 2032
- Table 3: Global Solar PV Inverter Industry Revenue Million Forecast, by Inverter Type 2019 & 2032
- Table 4: Global Solar PV Inverter Industry Volume K Unit Forecast, by Inverter Type 2019 & 2032
- Table 5: Global Solar PV Inverter Industry Revenue Million Forecast, by Application 2019 & 2032
- Table 6: Global Solar PV Inverter Industry Volume K Unit Forecast, by Application 2019 & 2032
- Table 7: Global Solar PV Inverter Industry Revenue Million Forecast, by Region 2019 & 2032
- Table 8: Global Solar PV Inverter Industry Volume K Unit Forecast, by Region 2019 & 2032
- Table 9: Global Solar PV Inverter Industry Revenue Million Forecast, by Country 2019 & 2032
- Table 10: Global Solar PV Inverter Industry Volume K Unit Forecast, by Country 2019 & 2032
- Table 11: United States Solar PV Inverter Industry Revenue (Million) Forecast, by Application 2019 & 2032
- Table 12: United States Solar PV Inverter Industry Volume (K Unit) Forecast, by Application 2019 & 2032
- Table 13: Canada Solar PV Inverter Industry Revenue (Million) Forecast, by Application 2019 & 2032
- Table 14: Canada Solar PV Inverter Industry Volume (K Unit) Forecast, by Application 2019 & 2032
- Table 15: Mexico Solar PV Inverter Industry Revenue (Million) Forecast, by Application 2019 & 2032
- Table 16: Mexico Solar PV Inverter Industry Volume (K Unit) Forecast, by Application 2019 & 2032
- Table 17: Global Solar PV Inverter Industry Revenue Million Forecast, by Country 2019 & 2032
- Table 18: Global Solar PV Inverter Industry Volume K Unit Forecast, by Country 2019 & 2032
- Table 19: Germany Solar PV Inverter Industry Revenue (Million) Forecast, by Application 2019 & 2032
- Table 20: Germany Solar PV Inverter Industry Volume (K Unit) Forecast, by Application 2019 & 2032
- Table 21: United Kingdom Solar PV Inverter Industry Revenue (Million) Forecast, by Application 2019 & 2032
- Table 22: United Kingdom Solar PV Inverter Industry Volume (K Unit) Forecast, by Application 2019 & 2032
- Table 23: France Solar PV Inverter Industry Revenue (Million) Forecast, by Application 2019 & 2032
- Table 24: France Solar PV Inverter Industry Volume (K Unit) Forecast, by Application 2019 & 2032
- Table 25: Spain Solar PV Inverter Industry Revenue (Million) Forecast, by Application 2019 & 2032
- Table 26: Spain Solar PV Inverter Industry Volume (K Unit) Forecast, by Application 2019 & 2032
- Table 27: Italy Solar PV Inverter Industry Revenue (Million) Forecast, by Application 2019 & 2032
- Table 28: Italy Solar PV Inverter Industry Volume (K Unit) Forecast, by Application 2019 & 2032
- Table 29: Spain Solar PV Inverter Industry Revenue (Million) Forecast, by Application 2019 & 2032
- Table 30: Spain Solar PV Inverter Industry Volume (K Unit) Forecast, by Application 2019 & 2032
- Table 31: Belgium Solar PV Inverter Industry Revenue (Million) Forecast, by Application 2019 & 2032
- Table 32: Belgium Solar PV Inverter Industry Volume (K Unit) Forecast, by Application 2019 & 2032
- Table 33: Netherland Solar PV Inverter Industry Revenue (Million) Forecast, by Application 2019 & 2032
- Table 34: Netherland Solar PV Inverter Industry Volume (K Unit) Forecast, by Application 2019 & 2032
- Table 35: Nordics Solar PV Inverter Industry Revenue (Million) Forecast, by Application 2019 & 2032
- Table 36: Nordics Solar PV Inverter Industry Volume (K Unit) Forecast, by Application 2019 & 2032
- Table 37: Rest of Europe Solar PV Inverter Industry Revenue (Million) Forecast, by Application 2019 & 2032
- Table 38: Rest of Europe Solar PV Inverter Industry Volume (K Unit) Forecast, by Application 2019 & 2032
- Table 39: Global Solar PV Inverter Industry Revenue Million Forecast, by Country 2019 & 2032
- Table 40: Global Solar PV Inverter Industry Volume K Unit Forecast, by Country 2019 & 2032
- Table 41: China Solar PV Inverter Industry Revenue (Million) Forecast, by Application 2019 & 2032
- Table 42: China Solar PV Inverter Industry Volume (K Unit) Forecast, by Application 2019 & 2032
- Table 43: Japan Solar PV Inverter Industry Revenue (Million) Forecast, by Application 2019 & 2032
- Table 44: Japan Solar PV Inverter Industry Volume (K Unit) Forecast, by Application 2019 & 2032
- Table 45: India Solar PV Inverter Industry Revenue (Million) Forecast, by Application 2019 & 2032
- Table 46: India Solar PV Inverter Industry Volume (K Unit) Forecast, by Application 2019 & 2032
- Table 47: South Korea Solar PV Inverter Industry Revenue (Million) Forecast, by Application 2019 & 2032
- Table 48: South Korea Solar PV Inverter Industry Volume (K Unit) Forecast, by Application 2019 & 2032
- Table 49: Southeast Asia Solar PV Inverter Industry Revenue (Million) Forecast, by Application 2019 & 2032
- Table 50: Southeast Asia Solar PV Inverter Industry Volume (K Unit) Forecast, by Application 2019 & 2032
- Table 51: Australia Solar PV Inverter Industry Revenue (Million) Forecast, by Application 2019 & 2032
- Table 52: Australia Solar PV Inverter Industry Volume (K Unit) Forecast, by Application 2019 & 2032
- Table 53: Indonesia Solar PV Inverter Industry Revenue (Million) Forecast, by Application 2019 & 2032
- Table 54: Indonesia Solar PV Inverter Industry Volume (K Unit) Forecast, by Application 2019 & 2032
- Table 55: Phillipes Solar PV Inverter Industry Revenue (Million) Forecast, by Application 2019 & 2032
- Table 56: Phillipes Solar PV Inverter Industry Volume (K Unit) Forecast, by Application 2019 & 2032
- Table 57: Singapore Solar PV Inverter Industry Revenue (Million) Forecast, by Application 2019 & 2032
- Table 58: Singapore Solar PV Inverter Industry Volume (K Unit) Forecast, by Application 2019 & 2032
- Table 59: Thailandc Solar PV Inverter Industry Revenue (Million) Forecast, by Application 2019 & 2032
- Table 60: Thailandc Solar PV Inverter Industry Volume (K Unit) Forecast, by Application 2019 & 2032
- Table 61: Rest of Asia Pacific Solar PV Inverter Industry Revenue (Million) Forecast, by Application 2019 & 2032
- Table 62: Rest of Asia Pacific Solar PV Inverter Industry Volume (K Unit) Forecast, by Application 2019 & 2032
- Table 63: Global Solar PV Inverter Industry Revenue Million Forecast, by Country 2019 & 2032
- Table 64: Global Solar PV Inverter Industry Volume K Unit Forecast, by Country 2019 & 2032
- Table 65: Brazil Solar PV Inverter Industry Revenue (Million) Forecast, by Application 2019 & 2032
- Table 66: Brazil Solar PV Inverter Industry Volume (K Unit) Forecast, by Application 2019 & 2032
- Table 67: Argentina Solar PV Inverter Industry Revenue (Million) Forecast, by Application 2019 & 2032
- Table 68: Argentina Solar PV Inverter Industry Volume (K Unit) Forecast, by Application 2019 & 2032
- Table 69: Peru Solar PV Inverter Industry Revenue (Million) Forecast, by Application 2019 & 2032
- Table 70: Peru Solar PV Inverter Industry Volume (K Unit) Forecast, by Application 2019 & 2032
- Table 71: Chile Solar PV Inverter Industry Revenue (Million) Forecast, by Application 2019 & 2032
- Table 72: Chile Solar PV Inverter Industry Volume (K Unit) Forecast, by Application 2019 & 2032
- Table 73: Colombia Solar PV Inverter Industry Revenue (Million) Forecast, by Application 2019 & 2032
- Table 74: Colombia Solar PV Inverter Industry Volume (K Unit) Forecast, by Application 2019 & 2032
- Table 75: Ecuador Solar PV Inverter Industry Revenue (Million) Forecast, by Application 2019 & 2032
- Table 76: Ecuador Solar PV Inverter Industry Volume (K Unit) Forecast, by Application 2019 & 2032
- Table 77: Venezuela Solar PV Inverter Industry Revenue (Million) Forecast, by Application 2019 & 2032
- Table 78: Venezuela Solar PV Inverter Industry Volume (K Unit) Forecast, by Application 2019 & 2032
- Table 79: Rest of South America Solar PV Inverter Industry Revenue (Million) Forecast, by Application 2019 & 2032
- Table 80: Rest of South America Solar PV Inverter Industry Volume (K Unit) Forecast, by Application 2019 & 2032
- Table 81: Global Solar PV Inverter Industry Revenue Million Forecast, by Country 2019 & 2032
- Table 82: Global Solar PV Inverter Industry Volume K Unit Forecast, by Country 2019 & 2032
- Table 83: United States Solar PV Inverter Industry Revenue (Million) Forecast, by Application 2019 & 2032
- Table 84: United States Solar PV Inverter Industry Volume (K Unit) Forecast, by Application 2019 & 2032
- Table 85: Canada Solar PV Inverter Industry Revenue (Million) Forecast, by Application 2019 & 2032
- Table 86: Canada Solar PV Inverter Industry Volume (K Unit) Forecast, by Application 2019 & 2032
- Table 87: Mexico Solar PV Inverter Industry Revenue (Million) Forecast, by Application 2019 & 2032
- Table 88: Mexico Solar PV Inverter Industry Volume (K Unit) Forecast, by Application 2019 & 2032
- Table 89: Global Solar PV Inverter Industry Revenue Million Forecast, by Country 2019 & 2032
- Table 90: Global Solar PV Inverter Industry Volume K Unit Forecast, by Country 2019 & 2032
- Table 91: United Arab Emirates Solar PV Inverter Industry Revenue (Million) Forecast, by Application 2019 & 2032
- Table 92: United Arab Emirates Solar PV Inverter Industry Volume (K Unit) Forecast, by Application 2019 & 2032
- Table 93: Saudi Arabia Solar PV Inverter Industry Revenue (Million) Forecast, by Application 2019 & 2032
- Table 94: Saudi Arabia Solar PV Inverter Industry Volume (K Unit) Forecast, by Application 2019 & 2032
- Table 95: South Africa Solar PV Inverter Industry Revenue (Million) Forecast, by Application 2019 & 2032
- Table 96: South Africa Solar PV Inverter Industry Volume (K Unit) Forecast, by Application 2019 & 2032
- Table 97: Rest of Middle East and Africa Solar PV Inverter Industry Revenue (Million) Forecast, by Application 2019 & 2032
- Table 98: Rest of Middle East and Africa Solar PV Inverter Industry Volume (K Unit) Forecast, by Application 2019 & 2032
- Table 99: Global Solar PV Inverter Industry Revenue Million Forecast, by Inverter Type 2019 & 2032
- Table 100: Global Solar PV Inverter Industry Volume K Unit Forecast, by Inverter Type 2019 & 2032
- Table 101: Global Solar PV Inverter Industry Revenue Million Forecast, by Application 2019 & 2032
- Table 102: Global Solar PV Inverter Industry Volume K Unit Forecast, by Application 2019 & 2032
- Table 103: Global Solar PV Inverter Industry Revenue Million Forecast, by Country 2019 & 2032
- Table 104: Global Solar PV Inverter Industry Volume K Unit Forecast, by Country 2019 & 2032
- Table 105: Global Solar PV Inverter Industry Revenue Million Forecast, by Inverter Type 2019 & 2032
- Table 106: Global Solar PV Inverter Industry Volume K Unit Forecast, by Inverter Type 2019 & 2032
- Table 107: Global Solar PV Inverter Industry Revenue Million Forecast, by Application 2019 & 2032
- Table 108: Global Solar PV Inverter Industry Volume K Unit Forecast, by Application 2019 & 2032
- Table 109: Global Solar PV Inverter Industry Revenue Million Forecast, by Country 2019 & 2032
- Table 110: Global Solar PV Inverter Industry Volume K Unit Forecast, by Country 2019 & 2032
- Table 111: Global Solar PV Inverter Industry Revenue Million Forecast, by Inverter Type 2019 & 2032
- Table 112: Global Solar PV Inverter Industry Volume K Unit Forecast, by Inverter Type 2019 & 2032
- Table 113: Global Solar PV Inverter Industry Revenue Million Forecast, by Application 2019 & 2032
- Table 114: Global Solar PV Inverter Industry Volume K Unit Forecast, by Application 2019 & 2032
- Table 115: Global Solar PV Inverter Industry Revenue Million Forecast, by Country 2019 & 2032
- Table 116: Global Solar PV Inverter Industry Volume K Unit Forecast, by Country 2019 & 2032
- Table 117: Global Solar PV Inverter Industry Revenue Million Forecast, by Inverter Type 2019 & 2032
- Table 118: Global Solar PV Inverter Industry Volume K Unit Forecast, by Inverter Type 2019 & 2032
- Table 119: Global Solar PV Inverter Industry Revenue Million Forecast, by Application 2019 & 2032
- Table 120: Global Solar PV Inverter Industry Volume K Unit Forecast, by Application 2019 & 2032
- Table 121: Global Solar PV Inverter Industry Revenue Million Forecast, by Country 2019 & 2032
- Table 122: Global Solar PV Inverter Industry Volume K Unit Forecast, by Country 2019 & 2032
- Table 123: Global Solar PV Inverter Industry Revenue Million Forecast, by Inverter Type 2019 & 2032
- Table 124: Global Solar PV Inverter Industry Volume K Unit Forecast, by Inverter Type 2019 & 2032
- Table 125: Global Solar PV Inverter Industry Revenue Million Forecast, by Application 2019 & 2032
- Table 126: Global Solar PV Inverter Industry Volume K Unit Forecast, by Application 2019 & 2032
- Table 127: Global Solar PV Inverter Industry Revenue Million Forecast, by Country 2019 & 2032
- Table 128: Global Solar PV Inverter Industry Volume K Unit Forecast, by Country 2019 & 2032
Frequently Asked Questions
1. What is the projected Compound Annual Growth Rate (CAGR) of the Solar PV Inverter Industry?
The projected CAGR is approximately 4.73%.
2. Which companies are prominent players in the Solar PV Inverter Industry?
Key companies in the market include Delta Energy Systems Inc, Enphase Energy Inc, FIMER SpA, Mitsubishi Electric Corporation, Siemens AG, Schneider Electric SE, Omron Corporation, Huawei Technologies Co Ltd*List Not Exhaustive, SolarEdge Technologies Inc, General Electric Company, SMA Solar Technology AG.
3. What are the main segments of the Solar PV Inverter Industry?
The market segments include Inverter Type, Application.
4. Can you provide details about the market size?
The market size is estimated to be USD 13.68 Million as of 2022.
5. What are some drivers contributing to market growth?
4.; Supportive Government Initiatives4.; Investment in Electrification Using Solar Energy.
6. What are the notable trends driving market growth?
Central Inverters Segment Expected to Dominate the Market.
7. Are there any restraints impacting market growth?
4.; Lack of General Awareness. Infrastructure Development Costs. and Recent Subsidy Cuts on Solar Panels.
8. Can you provide examples of recent developments in the market?
In April 2022, SMA Solar Technology AG, a German inverter manufacturer, launched a new line of four inverters with power ratings of 12kW, 15kW, 20kW, and 25kW for use in rooftop PV systems up to 135kW in size.
9. What pricing options are available for accessing the report?
Pricing options include single-user, multi-user, and enterprise licenses priced at USD 4750, USD 5250, and USD 8750 respectively.
10. Is the market size provided in terms of value or volume?
The market size is provided in terms of value, measured in Million and volume, measured in K Unit.
11. Are there any specific market keywords associated with the report?
Yes, the market keyword associated with the report is "Solar PV Inverter Industry," which aids in identifying and referencing the specific market segment covered.
12. How do I determine which pricing option suits my needs best?
The pricing options vary based on user requirements and access needs. Individual users may opt for single-user licenses, while businesses requiring broader access may choose multi-user or enterprise licenses for cost-effective access to the report.
13. Are there any additional resources or data provided in the Solar PV Inverter Industry report?
While the report offers comprehensive insights, it's advisable to review the specific contents or supplementary materials provided to ascertain if additional resources or data are available.
14. How can I stay updated on further developments or reports in the Solar PV Inverter Industry?
To stay informed about further developments, trends, and reports in the Solar PV Inverter Industry, consider subscribing to industry newsletters, following relevant companies and organizations, or regularly checking reputable industry news sources and publications.
Methodology
Step 1 - Identification of Relevant Samples Size from Population Database


Step 2 - Approaches for Defining Global Market Size (Value, Volume* & Price*)

Note*: In applicable scenarios
Step 3 - Data Sources
Primary Research
- Web Analytics
- Survey Reports
- Research Institute
- Latest Research Reports
- Opinion Leaders
Secondary Research
- Annual Reports
- White Paper
- Latest Press Release
- Industry Association
- Paid Database
- Investor Presentations

Step 4 - Data Triangulation
Involves using different sources of information in order to increase the validity of a study
These sources are likely to be stakeholders in a program - participants, other researchers, program staff, other community members, and so on.
Then we put all data in single framework & apply various statistical tools to find out the dynamic on the market.
During the analysis stage, feedback from the stakeholder groups would be compared to determine areas of agreement as well as areas of divergence


