
Key Insights
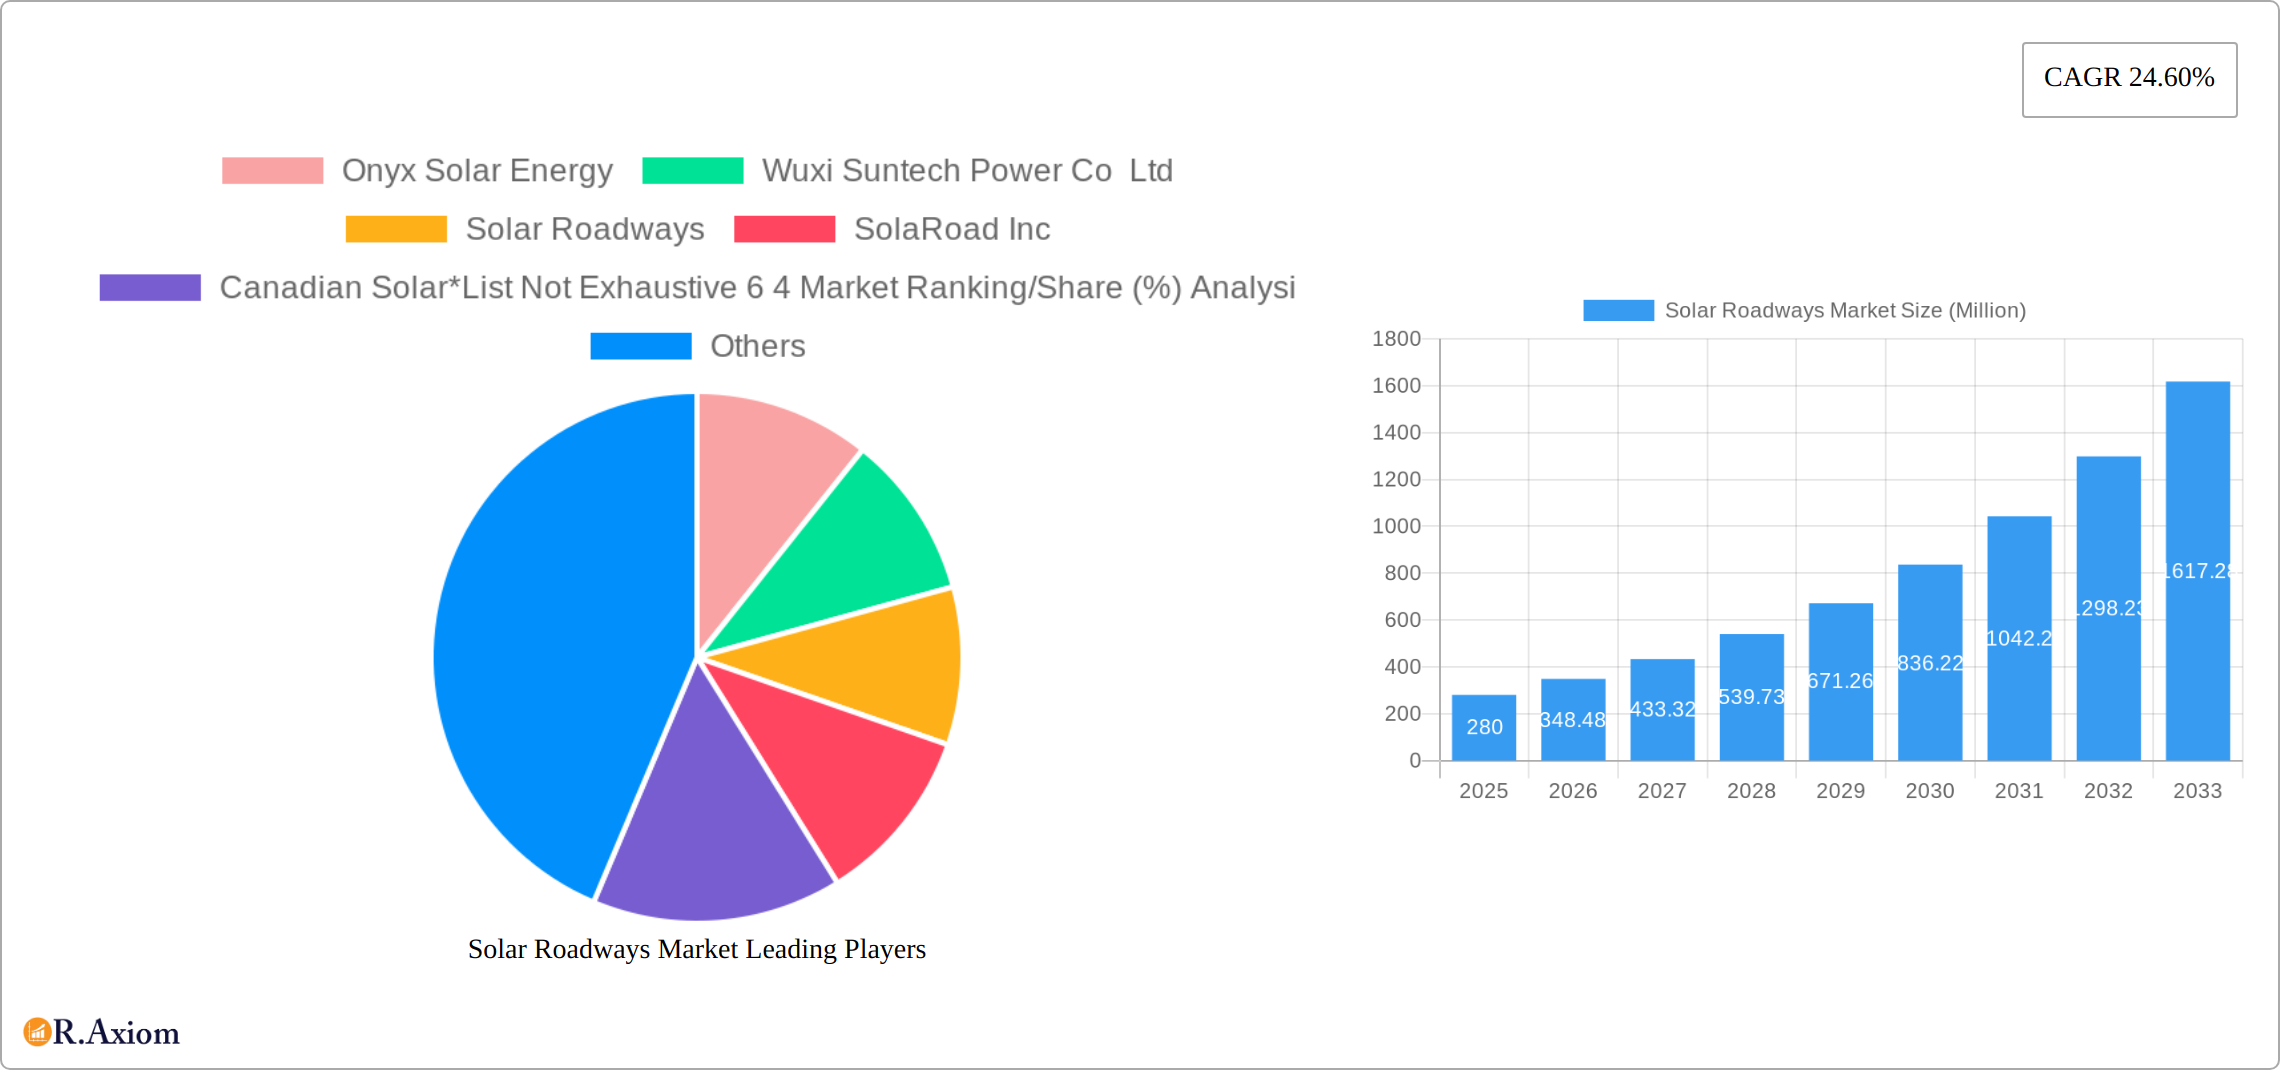
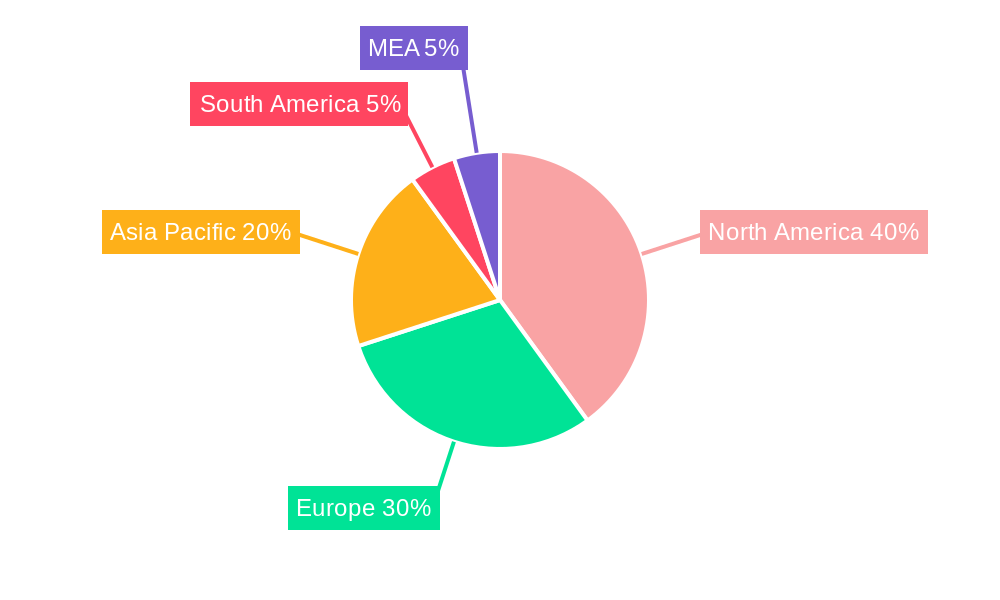
The solar roadways market, currently valued at $280 million in 2025, is experiencing robust growth, projected to expand at a compound annual growth rate (CAGR) of 24.60% from 2025 to 2033. This significant expansion is driven by several key factors. Increasing concerns about climate change and the urgent need for renewable energy sources are fueling government initiatives and private investments in sustainable infrastructure projects. Furthermore, technological advancements in photovoltaic (PV) cell efficiency and durability are making solar roadways a more cost-effective and practical solution compared to traditional asphalt. The rising adoption of electric vehicles (EVs) also contributes to the market's growth, as solar roadways can provide a convenient and sustainable charging infrastructure. Market segmentation reveals strong demand across various applications, including driveways and parking lots, with monocrystalline and polycrystalline silicon being the dominant materials. North America, particularly the United States, currently holds a significant market share, driven by supportive government policies and technological innovation. However, Europe and Asia-Pacific are also exhibiting strong growth potential due to increasing investments in renewable energy infrastructure and rising awareness of environmental sustainability. The market faces challenges, such as high initial installation costs and potential maintenance complexities, which could limit broader adoption in the short term. However, ongoing technological improvements and economies of scale are expected to mitigate these concerns in the coming years. Key players like Onyx Solar Energy, Wuxi Suntech Power Co Ltd, and Solar Roadways are actively contributing to market growth through innovation and expansion.
The competitive landscape is characterized by both established solar energy companies diversifying into the solar roadways sector and specialized startups focusing solely on this niche market. Ongoing research and development efforts are focused on improving the efficiency and longevity of solar cells embedded in roadways, reducing installation costs, and developing innovative solutions to address durability concerns. The market's future growth trajectory will be significantly influenced by government regulations, technological advancements, and the overall acceptance of solar roadways as a viable and cost-effective renewable energy solution. The long-term outlook remains positive, with significant potential for growth in emerging markets and expanding applications beyond driveways and parking lots to encompass highways and other transportation infrastructure.
Solar Roadways Market: A Comprehensive Report (2019-2033)
This detailed report provides a comprehensive analysis of the Solar Roadways market, encompassing market size, growth projections, key players, and emerging trends from 2019 to 2033. The study period covers historical data (2019-2024), the base year (2025), and the forecast period (2025-2033). This in-depth analysis is crucial for stakeholders seeking to understand the market dynamics and make informed strategic decisions. The report utilizes data-driven insights and expert opinions to offer actionable intelligence.
Solar Roadways Market Concentration & Innovation
The Solar Roadways market exhibits a moderately concentrated landscape, with a few key players holding significant market share. However, the market is witnessing increased innovation and entry of new players, driven by advancements in solar cell technology and growing government support for renewable energy initiatives. Market share analysis reveals that the top 6 players account for approximately 64% of the global market in 2025, with this number expected to fluctuate slightly in the forecast period. M&A activity remains modest, with deal values averaging xx Million in the last five years, indicating a focus on organic growth through product innovation and market expansion.
- Key Innovation Drivers: Advancements in flexible solar cells, improved durability and efficiency, and integration with smart city infrastructure are driving innovation.
- Regulatory Frameworks: Government policies supporting renewable energy, incentives for solar infrastructure development, and evolving building codes significantly influence market growth.
- Product Substitutes: Traditional asphalt and concrete remain major substitutes, but their environmental impact is driving a shift towards solar roadways.
- End-User Trends: Increased demand from urban areas, growing awareness of sustainability, and the need for decentralized energy generation fuel market growth.
- M&A Activities: Consolidation is expected to increase as larger companies seek to expand their product portfolios and market reach.
Solar Roadways Market Industry Trends & Insights
The Solar Roadways market is poised for substantial growth, fueled by escalating energy demands, heightened environmental concerns, and proactive government initiatives promoting sustainable infrastructure. This market is experiencing robust expansion, projected to achieve a Compound Annual Growth Rate (CAGR) of xx% throughout the forecast period (2025-2033). While current market penetration remains relatively low, estimated at xx% in 2025, significant increases are anticipated as technology matures and production costs decrease. Key technological advancements, such as the development of more efficient and durable solar cells, are accelerating market adoption. A burgeoning consumer preference for eco-friendly and cost-effective solutions further contributes to this growth trajectory. The competitive landscape is dynamic, featuring both established industry leaders and innovative new entrants, fostering increased competition and driving continuous innovation.
Dominant Markets & Segments in Solar Roadways Market
The North American region is currently the dominant market for Solar Roadways, driven by favorable government policies and a strong focus on sustainable infrastructure development. Within this region, the United States holds the largest market share. In terms of materials, Monocrystalline Silicon dominates, due to its higher efficiency, while Polycrystalline Silicon offers a more cost-effective alternative. For applications, parking lots currently represent the largest segment, followed by driveways. This is expected to remain the case until the cost of flexible solar cells used in road surfaces is significantly lowered.
- Key Drivers for North American Dominance:
- Strong government support and funding for renewable energy projects.
- Higher awareness among consumers regarding environmental sustainability.
- Robust private sector investment in innovative solar technologies.
- Materials Segment Analysis: Monocrystalline Silicon offers superior efficiency but higher costs, leading to the dominance of Polycrystalline Silicon in the cost-sensitive market segment.
- Applications Segment Analysis: Parking lots offer larger, consistent surface areas for solar panel deployment, leading to high adoption rates compared to driveways, which have various constraints in terms of size and design.
Solar Roadways Market Product Developments
Recent product innovations focus on increasing the efficiency, durability, and aesthetic appeal of solar roadways. This includes the development of flexible and transparent solar panels that can be integrated seamlessly into road surfaces without compromising structural integrity or driver visibility. These advancements are improving market fit by addressing key concerns around cost, durability, and visual impact, thus opening up vast new applications beyond parking lots and driveways.
Report Scope & Segmentation Analysis
This report segments the Solar Roadways market based on materials (Monocrystalline Silicon and Polycrystalline Silicon) and applications (Driveways and Parking Lots). Market size projections for each segment are provided, along with an analysis of competitive dynamics. The Monocrystalline Silicon segment is expected to experience higher growth due to its superior efficiency, although the Polycrystalline Silicon segment is expected to continue maintaining a strong share given its lower cost. The Parking Lots application segment is projected to lead due to its larger and more consistent potential for surface area coverage.
Key Drivers of Solar Roadways Market Growth
Several factors contribute to the growth of the Solar Roadways market. These include advancements in solar cell technology leading to higher efficiency and lower costs; increasing government incentives and regulations promoting renewable energy; rising environmental awareness among consumers; and the need for decentralized energy generation and reduced carbon footprint.
Challenges in the Solar Roadways Market Sector
The Solar Roadways market faces challenges such as high initial investment costs, concerns about durability and maintenance, the need for specialized installation techniques, and potential issues with efficiency and energy yield under various weather conditions. Supply chain disruptions and competition from traditional road materials also present obstacles. These factors collectively impact market growth and adoption rates.
Emerging Opportunities in Solar Roadways Market
Exciting opportunities abound within the Solar Roadways market. These include seamless integration with smart city infrastructure, the expansion of applications into underserved rural areas and developing nations, and diversification into other transportation infrastructure projects, such as dedicated bicycle paths and pedestrian walkways. Advancements in flexible solar technology are poised to unlock a wider range of innovative applications and significantly expand market potential.
Leading Players in the Solar Roadways Market
- Onyx Solar Energy
- Wuxi Suntech Power Co Ltd
- Solar Roadways
- SolaRoad Inc
- Canadian Solar
- Wattway
- Colas Group
- PLATIO Solar
Key Developments in Solar Roadways Market Industry
- May 2023: The Dutch province of North Brabant launched an ambitious pilot project: a 500-meter solar cycle path near Wagenberg. This initiative aims to rigorously assess the long-term durability and energy generation capacity of solar panels embedded in bicycle paths. The data collected will be invaluable in informing the design and implementation of future large-scale deployments. This project underscores the growing interest in exploring the diverse and expanding applications of solar roadways beyond traditional road networks.
- [Add other key developments here with dates and brief descriptions. For example, new product launches, partnerships, or significant investments.]
Strategic Outlook for Solar Roadways Market
The Solar Roadways market presents significant growth potential. Continued technological advancements, supportive government policies, and rising environmental consciousness will drive market expansion. Companies focusing on innovation, cost reduction, and strategic partnerships are well-positioned to capitalize on the emerging opportunities in this rapidly growing sector. The market is predicted to exceed xx Million by 2033.
Solar Roadways Market Segmentation
-
1. Materials
- 1.1. Monocrystalline Silicon
- 1.2. Polycrystalline Silicon
-
2. Applications
- 2.1. Driveways
- 2.2. Parking Lots
Solar Roadways Market Segmentation By Geography
-
1. North America
- 1.1. United States
- 1.2. Canada
- 1.3. Rest of North America
-
2. Europe
- 2.1. Germany
- 2.2. France
- 2.3. United Kingdom
- 2.4. Italy
- 2.5. Spain
- 2.6. NORDIC
- 2.7. Turkey
- 2.8. Russia
- 2.9. Rest of Europe
-
3. Asia Pacific
- 3.1. China
- 3.2. India
- 3.3. Japan
- 3.4. Malaysia
- 3.5. Thailand
- 3.6. Indonesia
- 3.7. Vietnam
- 3.8. Rest of Asia Pacific
-
4. Middle East and Africa
- 4.1. Saudi Arabia
- 4.2. United Arab Emirates
- 4.3. South Africa
- 4.4. Qatar
- 4.5. Egypt
- 4.6. Nigeria
- 4.7. Rest of Middle East and Africa
-
5. South America
- 5.1. Brazil
- 5.2. Argentina
- 5.3. Colombia
- 5.4. Rest of South America
Solar Roadways Market REPORT HIGHLIGHTS
| Aspects | Details |
|---|---|
| Study Period | 2019-2033 |
| Base Year | 2024 |
| Estimated Year | 2025 |
| Forecast Period | 2025-2033 |
| Historical Period | 2019-2024 |
| Growth Rate | CAGR of 24.60% from 2019-2033 |
| Segmentation |
|
Table of Contents
- 1. Introduction
- 1.1. Research Scope
- 1.2. Market Segmentation
- 1.3. Research Methodology
- 1.4. Definitions and Assumptions
- 2. Executive Summary
- 2.1. Introduction
- 3. Market Dynamics
- 3.1. Introduction
- 3.2. Market Drivers
- 3.2.1. 4.; Growing Adoption of Renewable Energy4.; Efforts in Sustainable Infrastructure to Reduce Carbon Footprints
- 3.3. Market Restrains
- 3.3.1. 4.; High Initial Cost Associated With Developing the Infrastructure
- 3.4. Market Trends
- 3.4.1. The Driveways Segment is Expected to Witness Significant Growth
- 4. Market Factor Analysis
- 4.1. Porters Five Forces
- 4.2. Supply/Value Chain
- 4.3. PESTEL analysis
- 4.4. Market Entropy
- 4.5. Patent/Trademark Analysis
- 5. Global Solar Roadways Market Analysis, Insights and Forecast, 2019-2031
- 5.1. Market Analysis, Insights and Forecast - by Materials
- 5.1.1. Monocrystalline Silicon
- 5.1.2. Polycrystalline Silicon
- 5.2. Market Analysis, Insights and Forecast - by Applications
- 5.2.1. Driveways
- 5.2.2. Parking Lots
- 5.3. Market Analysis, Insights and Forecast - by Region
- 5.3.1. North America
- 5.3.2. Europe
- 5.3.3. Asia Pacific
- 5.3.4. Middle East and Africa
- 5.3.5. South America
- 5.1. Market Analysis, Insights and Forecast - by Materials
- 6. North America Solar Roadways Market Analysis, Insights and Forecast, 2019-2031
- 6.1. Market Analysis, Insights and Forecast - by Materials
- 6.1.1. Monocrystalline Silicon
- 6.1.2. Polycrystalline Silicon
- 6.2. Market Analysis, Insights and Forecast - by Applications
- 6.2.1. Driveways
- 6.2.2. Parking Lots
- 6.1. Market Analysis, Insights and Forecast - by Materials
- 7. Europe Solar Roadways Market Analysis, Insights and Forecast, 2019-2031
- 7.1. Market Analysis, Insights and Forecast - by Materials
- 7.1.1. Monocrystalline Silicon
- 7.1.2. Polycrystalline Silicon
- 7.2. Market Analysis, Insights and Forecast - by Applications
- 7.2.1. Driveways
- 7.2.2. Parking Lots
- 7.1. Market Analysis, Insights and Forecast - by Materials
- 8. Asia Pacific Solar Roadways Market Analysis, Insights and Forecast, 2019-2031
- 8.1. Market Analysis, Insights and Forecast - by Materials
- 8.1.1. Monocrystalline Silicon
- 8.1.2. Polycrystalline Silicon
- 8.2. Market Analysis, Insights and Forecast - by Applications
- 8.2.1. Driveways
- 8.2.2. Parking Lots
- 8.1. Market Analysis, Insights and Forecast - by Materials
- 9. Middle East and Africa Solar Roadways Market Analysis, Insights and Forecast, 2019-2031
- 9.1. Market Analysis, Insights and Forecast - by Materials
- 9.1.1. Monocrystalline Silicon
- 9.1.2. Polycrystalline Silicon
- 9.2. Market Analysis, Insights and Forecast - by Applications
- 9.2.1. Driveways
- 9.2.2. Parking Lots
- 9.1. Market Analysis, Insights and Forecast - by Materials
- 10. South America Solar Roadways Market Analysis, Insights and Forecast, 2019-2031
- 10.1. Market Analysis, Insights and Forecast - by Materials
- 10.1.1. Monocrystalline Silicon
- 10.1.2. Polycrystalline Silicon
- 10.2. Market Analysis, Insights and Forecast - by Applications
- 10.2.1. Driveways
- 10.2.2. Parking Lots
- 10.1. Market Analysis, Insights and Forecast - by Materials
- 11. North America Solar Roadways Market Analysis, Insights and Forecast, 2019-2031
- 11.1. Market Analysis, Insights and Forecast - By Country/Sub-region
- 11.1.1 United States
- 11.1.2 Canada
- 11.1.3 Mexico
- 12. Europe Solar Roadways Market Analysis, Insights and Forecast, 2019-2031
- 12.1. Market Analysis, Insights and Forecast - By Country/Sub-region
- 12.1.1 Germany
- 12.1.2 United Kingdom
- 12.1.3 France
- 12.1.4 Spain
- 12.1.5 Italy
- 12.1.6 Spain
- 12.1.7 Belgium
- 12.1.8 Netherland
- 12.1.9 Nordics
- 12.1.10 Rest of Europe
- 13. Asia Pacific Solar Roadways Market Analysis, Insights and Forecast, 2019-2031
- 13.1. Market Analysis, Insights and Forecast - By Country/Sub-region
- 13.1.1 China
- 13.1.2 Japan
- 13.1.3 India
- 13.1.4 South Korea
- 13.1.5 Southeast Asia
- 13.1.6 Australia
- 13.1.7 Indonesia
- 13.1.8 Phillipes
- 13.1.9 Singapore
- 13.1.10 Thailandc
- 13.1.11 Rest of Asia Pacific
- 14. South America Solar Roadways Market Analysis, Insights and Forecast, 2019-2031
- 14.1. Market Analysis, Insights and Forecast - By Country/Sub-region
- 14.1.1 Brazil
- 14.1.2 Argentina
- 14.1.3 Peru
- 14.1.4 Chile
- 14.1.5 Colombia
- 14.1.6 Ecuador
- 14.1.7 Venezuela
- 14.1.8 Rest of South America
- 15. North America Solar Roadways Market Analysis, Insights and Forecast, 2019-2031
- 15.1. Market Analysis, Insights and Forecast - By Country/Sub-region
- 15.1.1 United States
- 15.1.2 Canada
- 15.1.3 Mexico
- 16. MEA Solar Roadways Market Analysis, Insights and Forecast, 2019-2031
- 16.1. Market Analysis, Insights and Forecast - By Country/Sub-region
- 16.1.1 United Arab Emirates
- 16.1.2 Saudi Arabia
- 16.1.3 South Africa
- 16.1.4 Rest of Middle East and Africa
- 17. Competitive Analysis
- 17.1. Global Market Share Analysis 2024
- 17.2. Company Profiles
- 17.2.1 Onyx Solar Energy
- 17.2.1.1. Overview
- 17.2.1.2. Products
- 17.2.1.3. SWOT Analysis
- 17.2.1.4. Recent Developments
- 17.2.1.5. Financials (Based on Availability)
- 17.2.2 Wuxi Suntech Power Co Ltd
- 17.2.2.1. Overview
- 17.2.2.2. Products
- 17.2.2.3. SWOT Analysis
- 17.2.2.4. Recent Developments
- 17.2.2.5. Financials (Based on Availability)
- 17.2.3 Solar Roadways
- 17.2.3.1. Overview
- 17.2.3.2. Products
- 17.2.3.3. SWOT Analysis
- 17.2.3.4. Recent Developments
- 17.2.3.5. Financials (Based on Availability)
- 17.2.4 SolaRoad Inc
- 17.2.4.1. Overview
- 17.2.4.2. Products
- 17.2.4.3. SWOT Analysis
- 17.2.4.4. Recent Developments
- 17.2.4.5. Financials (Based on Availability)
- 17.2.5 Canadian Solar*List Not Exhaustive 6 4 Market Ranking/Share (%) Analysi
- 17.2.5.1. Overview
- 17.2.5.2. Products
- 17.2.5.3. SWOT Analysis
- 17.2.5.4. Recent Developments
- 17.2.5.5. Financials (Based on Availability)
- 17.2.6 Wattway
- 17.2.6.1. Overview
- 17.2.6.2. Products
- 17.2.6.3. SWOT Analysis
- 17.2.6.4. Recent Developments
- 17.2.6.5. Financials (Based on Availability)
- 17.2.7 Colas Group
- 17.2.7.1. Overview
- 17.2.7.2. Products
- 17.2.7.3. SWOT Analysis
- 17.2.7.4. Recent Developments
- 17.2.7.5. Financials (Based on Availability)
- 17.2.8 PLATIO Solar
- 17.2.8.1. Overview
- 17.2.8.2. Products
- 17.2.8.3. SWOT Analysis
- 17.2.8.4. Recent Developments
- 17.2.8.5. Financials (Based on Availability)
- 17.2.1 Onyx Solar Energy
List of Figures
- Figure 1: Global Solar Roadways Market Revenue Breakdown (Million, %) by Region 2024 & 2032
- Figure 2: North America Solar Roadways Market Revenue (Million), by Country 2024 & 2032
- Figure 3: North America Solar Roadways Market Revenue Share (%), by Country 2024 & 2032
- Figure 4: Europe Solar Roadways Market Revenue (Million), by Country 2024 & 2032
- Figure 5: Europe Solar Roadways Market Revenue Share (%), by Country 2024 & 2032
- Figure 6: Asia Pacific Solar Roadways Market Revenue (Million), by Country 2024 & 2032
- Figure 7: Asia Pacific Solar Roadways Market Revenue Share (%), by Country 2024 & 2032
- Figure 8: South America Solar Roadways Market Revenue (Million), by Country 2024 & 2032
- Figure 9: South America Solar Roadways Market Revenue Share (%), by Country 2024 & 2032
- Figure 10: North America Solar Roadways Market Revenue (Million), by Country 2024 & 2032
- Figure 11: North America Solar Roadways Market Revenue Share (%), by Country 2024 & 2032
- Figure 12: MEA Solar Roadways Market Revenue (Million), by Country 2024 & 2032
- Figure 13: MEA Solar Roadways Market Revenue Share (%), by Country 2024 & 2032
- Figure 14: North America Solar Roadways Market Revenue (Million), by Materials 2024 & 2032
- Figure 15: North America Solar Roadways Market Revenue Share (%), by Materials 2024 & 2032
- Figure 16: North America Solar Roadways Market Revenue (Million), by Applications 2024 & 2032
- Figure 17: North America Solar Roadways Market Revenue Share (%), by Applications 2024 & 2032
- Figure 18: North America Solar Roadways Market Revenue (Million), by Country 2024 & 2032
- Figure 19: North America Solar Roadways Market Revenue Share (%), by Country 2024 & 2032
- Figure 20: Europe Solar Roadways Market Revenue (Million), by Materials 2024 & 2032
- Figure 21: Europe Solar Roadways Market Revenue Share (%), by Materials 2024 & 2032
- Figure 22: Europe Solar Roadways Market Revenue (Million), by Applications 2024 & 2032
- Figure 23: Europe Solar Roadways Market Revenue Share (%), by Applications 2024 & 2032
- Figure 24: Europe Solar Roadways Market Revenue (Million), by Country 2024 & 2032
- Figure 25: Europe Solar Roadways Market Revenue Share (%), by Country 2024 & 2032
- Figure 26: Asia Pacific Solar Roadways Market Revenue (Million), by Materials 2024 & 2032
- Figure 27: Asia Pacific Solar Roadways Market Revenue Share (%), by Materials 2024 & 2032
- Figure 28: Asia Pacific Solar Roadways Market Revenue (Million), by Applications 2024 & 2032
- Figure 29: Asia Pacific Solar Roadways Market Revenue Share (%), by Applications 2024 & 2032
- Figure 30: Asia Pacific Solar Roadways Market Revenue (Million), by Country 2024 & 2032
- Figure 31: Asia Pacific Solar Roadways Market Revenue Share (%), by Country 2024 & 2032
- Figure 32: Middle East and Africa Solar Roadways Market Revenue (Million), by Materials 2024 & 2032
- Figure 33: Middle East and Africa Solar Roadways Market Revenue Share (%), by Materials 2024 & 2032
- Figure 34: Middle East and Africa Solar Roadways Market Revenue (Million), by Applications 2024 & 2032
- Figure 35: Middle East and Africa Solar Roadways Market Revenue Share (%), by Applications 2024 & 2032
- Figure 36: Middle East and Africa Solar Roadways Market Revenue (Million), by Country 2024 & 2032
- Figure 37: Middle East and Africa Solar Roadways Market Revenue Share (%), by Country 2024 & 2032
- Figure 38: South America Solar Roadways Market Revenue (Million), by Materials 2024 & 2032
- Figure 39: South America Solar Roadways Market Revenue Share (%), by Materials 2024 & 2032
- Figure 40: South America Solar Roadways Market Revenue (Million), by Applications 2024 & 2032
- Figure 41: South America Solar Roadways Market Revenue Share (%), by Applications 2024 & 2032
- Figure 42: South America Solar Roadways Market Revenue (Million), by Country 2024 & 2032
- Figure 43: South America Solar Roadways Market Revenue Share (%), by Country 2024 & 2032
List of Tables
- Table 1: Global Solar Roadways Market Revenue Million Forecast, by Region 2019 & 2032
- Table 2: Global Solar Roadways Market Revenue Million Forecast, by Materials 2019 & 2032
- Table 3: Global Solar Roadways Market Revenue Million Forecast, by Applications 2019 & 2032
- Table 4: Global Solar Roadways Market Revenue Million Forecast, by Region 2019 & 2032
- Table 5: Global Solar Roadways Market Revenue Million Forecast, by Country 2019 & 2032
- Table 6: United States Solar Roadways Market Revenue (Million) Forecast, by Application 2019 & 2032
- Table 7: Canada Solar Roadways Market Revenue (Million) Forecast, by Application 2019 & 2032
- Table 8: Mexico Solar Roadways Market Revenue (Million) Forecast, by Application 2019 & 2032
- Table 9: Global Solar Roadways Market Revenue Million Forecast, by Country 2019 & 2032
- Table 10: Germany Solar Roadways Market Revenue (Million) Forecast, by Application 2019 & 2032
- Table 11: United Kingdom Solar Roadways Market Revenue (Million) Forecast, by Application 2019 & 2032
- Table 12: France Solar Roadways Market Revenue (Million) Forecast, by Application 2019 & 2032
- Table 13: Spain Solar Roadways Market Revenue (Million) Forecast, by Application 2019 & 2032
- Table 14: Italy Solar Roadways Market Revenue (Million) Forecast, by Application 2019 & 2032
- Table 15: Spain Solar Roadways Market Revenue (Million) Forecast, by Application 2019 & 2032
- Table 16: Belgium Solar Roadways Market Revenue (Million) Forecast, by Application 2019 & 2032
- Table 17: Netherland Solar Roadways Market Revenue (Million) Forecast, by Application 2019 & 2032
- Table 18: Nordics Solar Roadways Market Revenue (Million) Forecast, by Application 2019 & 2032
- Table 19: Rest of Europe Solar Roadways Market Revenue (Million) Forecast, by Application 2019 & 2032
- Table 20: Global Solar Roadways Market Revenue Million Forecast, by Country 2019 & 2032
- Table 21: China Solar Roadways Market Revenue (Million) Forecast, by Application 2019 & 2032
- Table 22: Japan Solar Roadways Market Revenue (Million) Forecast, by Application 2019 & 2032
- Table 23: India Solar Roadways Market Revenue (Million) Forecast, by Application 2019 & 2032
- Table 24: South Korea Solar Roadways Market Revenue (Million) Forecast, by Application 2019 & 2032
- Table 25: Southeast Asia Solar Roadways Market Revenue (Million) Forecast, by Application 2019 & 2032
- Table 26: Australia Solar Roadways Market Revenue (Million) Forecast, by Application 2019 & 2032
- Table 27: Indonesia Solar Roadways Market Revenue (Million) Forecast, by Application 2019 & 2032
- Table 28: Phillipes Solar Roadways Market Revenue (Million) Forecast, by Application 2019 & 2032
- Table 29: Singapore Solar Roadways Market Revenue (Million) Forecast, by Application 2019 & 2032
- Table 30: Thailandc Solar Roadways Market Revenue (Million) Forecast, by Application 2019 & 2032
- Table 31: Rest of Asia Pacific Solar Roadways Market Revenue (Million) Forecast, by Application 2019 & 2032
- Table 32: Global Solar Roadways Market Revenue Million Forecast, by Country 2019 & 2032
- Table 33: Brazil Solar Roadways Market Revenue (Million) Forecast, by Application 2019 & 2032
- Table 34: Argentina Solar Roadways Market Revenue (Million) Forecast, by Application 2019 & 2032
- Table 35: Peru Solar Roadways Market Revenue (Million) Forecast, by Application 2019 & 2032
- Table 36: Chile Solar Roadways Market Revenue (Million) Forecast, by Application 2019 & 2032
- Table 37: Colombia Solar Roadways Market Revenue (Million) Forecast, by Application 2019 & 2032
- Table 38: Ecuador Solar Roadways Market Revenue (Million) Forecast, by Application 2019 & 2032
- Table 39: Venezuela Solar Roadways Market Revenue (Million) Forecast, by Application 2019 & 2032
- Table 40: Rest of South America Solar Roadways Market Revenue (Million) Forecast, by Application 2019 & 2032
- Table 41: Global Solar Roadways Market Revenue Million Forecast, by Country 2019 & 2032
- Table 42: United States Solar Roadways Market Revenue (Million) Forecast, by Application 2019 & 2032
- Table 43: Canada Solar Roadways Market Revenue (Million) Forecast, by Application 2019 & 2032
- Table 44: Mexico Solar Roadways Market Revenue (Million) Forecast, by Application 2019 & 2032
- Table 45: Global Solar Roadways Market Revenue Million Forecast, by Country 2019 & 2032
- Table 46: United Arab Emirates Solar Roadways Market Revenue (Million) Forecast, by Application 2019 & 2032
- Table 47: Saudi Arabia Solar Roadways Market Revenue (Million) Forecast, by Application 2019 & 2032
- Table 48: South Africa Solar Roadways Market Revenue (Million) Forecast, by Application 2019 & 2032
- Table 49: Rest of Middle East and Africa Solar Roadways Market Revenue (Million) Forecast, by Application 2019 & 2032
- Table 50: Global Solar Roadways Market Revenue Million Forecast, by Materials 2019 & 2032
- Table 51: Global Solar Roadways Market Revenue Million Forecast, by Applications 2019 & 2032
- Table 52: Global Solar Roadways Market Revenue Million Forecast, by Country 2019 & 2032
- Table 53: United States Solar Roadways Market Revenue (Million) Forecast, by Application 2019 & 2032
- Table 54: Canada Solar Roadways Market Revenue (Million) Forecast, by Application 2019 & 2032
- Table 55: Rest of North America Solar Roadways Market Revenue (Million) Forecast, by Application 2019 & 2032
- Table 56: Global Solar Roadways Market Revenue Million Forecast, by Materials 2019 & 2032
- Table 57: Global Solar Roadways Market Revenue Million Forecast, by Applications 2019 & 2032
- Table 58: Global Solar Roadways Market Revenue Million Forecast, by Country 2019 & 2032
- Table 59: Germany Solar Roadways Market Revenue (Million) Forecast, by Application 2019 & 2032
- Table 60: France Solar Roadways Market Revenue (Million) Forecast, by Application 2019 & 2032
- Table 61: United Kingdom Solar Roadways Market Revenue (Million) Forecast, by Application 2019 & 2032
- Table 62: Italy Solar Roadways Market Revenue (Million) Forecast, by Application 2019 & 2032
- Table 63: Spain Solar Roadways Market Revenue (Million) Forecast, by Application 2019 & 2032
- Table 64: NORDIC Solar Roadways Market Revenue (Million) Forecast, by Application 2019 & 2032
- Table 65: Turkey Solar Roadways Market Revenue (Million) Forecast, by Application 2019 & 2032
- Table 66: Russia Solar Roadways Market Revenue (Million) Forecast, by Application 2019 & 2032
- Table 67: Rest of Europe Solar Roadways Market Revenue (Million) Forecast, by Application 2019 & 2032
- Table 68: Global Solar Roadways Market Revenue Million Forecast, by Materials 2019 & 2032
- Table 69: Global Solar Roadways Market Revenue Million Forecast, by Applications 2019 & 2032
- Table 70: Global Solar Roadways Market Revenue Million Forecast, by Country 2019 & 2032
- Table 71: China Solar Roadways Market Revenue (Million) Forecast, by Application 2019 & 2032
- Table 72: India Solar Roadways Market Revenue (Million) Forecast, by Application 2019 & 2032
- Table 73: Japan Solar Roadways Market Revenue (Million) Forecast, by Application 2019 & 2032
- Table 74: Malaysia Solar Roadways Market Revenue (Million) Forecast, by Application 2019 & 2032
- Table 75: Thailand Solar Roadways Market Revenue (Million) Forecast, by Application 2019 & 2032
- Table 76: Indonesia Solar Roadways Market Revenue (Million) Forecast, by Application 2019 & 2032
- Table 77: Vietnam Solar Roadways Market Revenue (Million) Forecast, by Application 2019 & 2032
- Table 78: Rest of Asia Pacific Solar Roadways Market Revenue (Million) Forecast, by Application 2019 & 2032
- Table 79: Global Solar Roadways Market Revenue Million Forecast, by Materials 2019 & 2032
- Table 80: Global Solar Roadways Market Revenue Million Forecast, by Applications 2019 & 2032
- Table 81: Global Solar Roadways Market Revenue Million Forecast, by Country 2019 & 2032
- Table 82: Saudi Arabia Solar Roadways Market Revenue (Million) Forecast, by Application 2019 & 2032
- Table 83: United Arab Emirates Solar Roadways Market Revenue (Million) Forecast, by Application 2019 & 2032
- Table 84: South Africa Solar Roadways Market Revenue (Million) Forecast, by Application 2019 & 2032
- Table 85: Qatar Solar Roadways Market Revenue (Million) Forecast, by Application 2019 & 2032
- Table 86: Egypt Solar Roadways Market Revenue (Million) Forecast, by Application 2019 & 2032
- Table 87: Nigeria Solar Roadways Market Revenue (Million) Forecast, by Application 2019 & 2032
- Table 88: Rest of Middle East and Africa Solar Roadways Market Revenue (Million) Forecast, by Application 2019 & 2032
- Table 89: Global Solar Roadways Market Revenue Million Forecast, by Materials 2019 & 2032
- Table 90: Global Solar Roadways Market Revenue Million Forecast, by Applications 2019 & 2032
- Table 91: Global Solar Roadways Market Revenue Million Forecast, by Country 2019 & 2032
- Table 92: Brazil Solar Roadways Market Revenue (Million) Forecast, by Application 2019 & 2032
- Table 93: Argentina Solar Roadways Market Revenue (Million) Forecast, by Application 2019 & 2032
- Table 94: Colombia Solar Roadways Market Revenue (Million) Forecast, by Application 2019 & 2032
- Table 95: Rest of South America Solar Roadways Market Revenue (Million) Forecast, by Application 2019 & 2032
Frequently Asked Questions
1. What is the projected Compound Annual Growth Rate (CAGR) of the Solar Roadways Market?
The projected CAGR is approximately 24.60%.
2. Which companies are prominent players in the Solar Roadways Market?
Key companies in the market include Onyx Solar Energy, Wuxi Suntech Power Co Ltd, Solar Roadways, SolaRoad Inc, Canadian Solar*List Not Exhaustive 6 4 Market Ranking/Share (%) Analysi, Wattway, Colas Group, PLATIO Solar.
3. What are the main segments of the Solar Roadways Market?
The market segments include Materials, Applications.
4. Can you provide details about the market size?
The market size is estimated to be USD 280 Million as of 2022.
5. What are some drivers contributing to market growth?
4.; Growing Adoption of Renewable Energy4.; Efforts in Sustainable Infrastructure to Reduce Carbon Footprints.
6. What are the notable trends driving market growth?
The Driveways Segment is Expected to Witness Significant Growth.
7. Are there any restraints impacting market growth?
4.; High Initial Cost Associated With Developing the Infrastructure.
8. Can you provide examples of recent developments in the market?
May 2023: The Dutch province of North Brabant started constructing a 500-meter-long ground-mounted solar cycle path along the provincial N285 road near Wagenberg. The PV system will be integrated into the asphalt top layer and comprise 600 unspecified solar panels. As per the government, the project is mainly intended to gain experience deploying solar cells on bicycle paths. During five years, government experts will assess the resistance of the solar modules to the mechanical stress applied by the presence of pedestrians and bikers, the costs for their maintenance, and the PV system energy yield.
9. What pricing options are available for accessing the report?
Pricing options include single-user, multi-user, and enterprise licenses priced at USD 4750, USD 5250, and USD 8750 respectively.
10. Is the market size provided in terms of value or volume?
The market size is provided in terms of value, measured in Million.
11. Are there any specific market keywords associated with the report?
Yes, the market keyword associated with the report is "Solar Roadways Market," which aids in identifying and referencing the specific market segment covered.
12. How do I determine which pricing option suits my needs best?
The pricing options vary based on user requirements and access needs. Individual users may opt for single-user licenses, while businesses requiring broader access may choose multi-user or enterprise licenses for cost-effective access to the report.
13. Are there any additional resources or data provided in the Solar Roadways Market report?
While the report offers comprehensive insights, it's advisable to review the specific contents or supplementary materials provided to ascertain if additional resources or data are available.
14. How can I stay updated on further developments or reports in the Solar Roadways Market?
To stay informed about further developments, trends, and reports in the Solar Roadways Market, consider subscribing to industry newsletters, following relevant companies and organizations, or regularly checking reputable industry news sources and publications.
Methodology
Step 1 - Identification of Relevant Samples Size from Population Database


Step 2 - Approaches for Defining Global Market Size (Value, Volume* & Price*)

Note*: In applicable scenarios
Step 3 - Data Sources
Primary Research
- Web Analytics
- Survey Reports
- Research Institute
- Latest Research Reports
- Opinion Leaders
Secondary Research
- Annual Reports
- White Paper
- Latest Press Release
- Industry Association
- Paid Database
- Investor Presentations

Step 4 - Data Triangulation
Involves using different sources of information in order to increase the validity of a study
These sources are likely to be stakeholders in a program - participants, other researchers, program staff, other community members, and so on.
Then we put all data in single framework & apply various statistical tools to find out the dynamic on the market.
During the analysis stage, feedback from the stakeholder groups would be compared to determine areas of agreement as well as areas of divergence


