
Key Insights
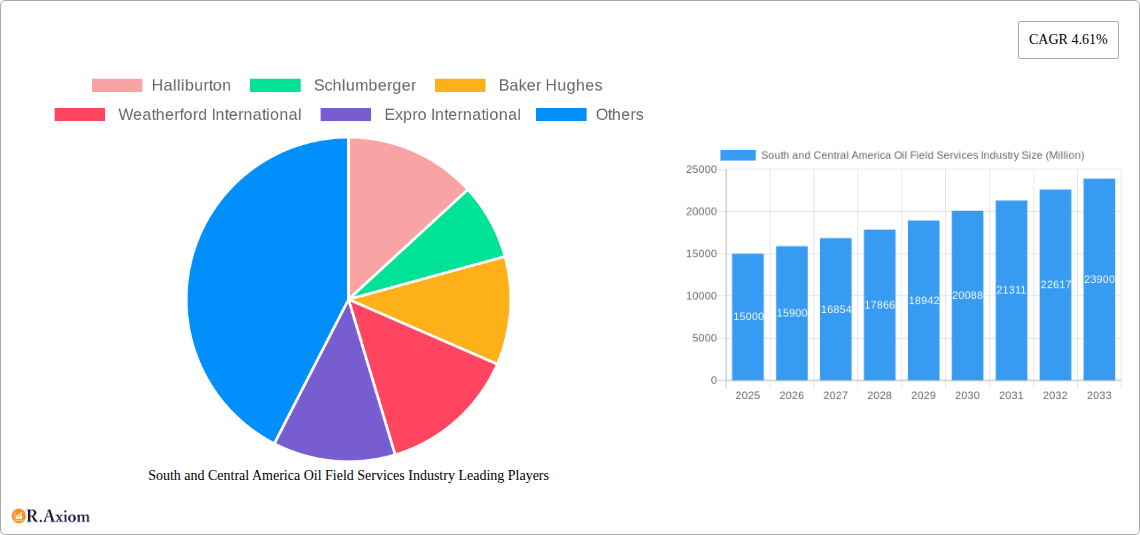
The South and Central American oil field services market, while smaller than its North American or European counterparts, presents a significant growth opportunity. Driven by increasing oil and gas exploration and production activities in the region, particularly in Brazil and Argentina, the market is projected to experience steady expansion throughout the forecast period (2025-2033). While the overall global CAGR is 4.61%, the South and Central American market may see a slightly higher rate, perhaps in the range of 5-6%, due to the region's untapped potential and ongoing investments in infrastructure development. Key drivers include the discovery of new oil and gas reserves, government initiatives to boost energy independence, and growing demand for energy in rapidly developing economies. However, political instability in some parts of the region, along with environmental concerns surrounding oil extraction, pose challenges to sustained growth. The market is segmented by service type (solar, wind, hydro, and other renewables alongside traditional oilfield services), with traditional services holding the larger share initially, but renewable energy services expected to see faster growth in the long term. Major international players like Halliburton, Schlumberger, and Baker Hughes are already active in the region, competing with local service providers. Future growth will depend on successful project execution, sustainable investments, and a favorable regulatory environment.
The competitive landscape in South and Central America is characterized by a blend of multinational corporations and local companies. Multinational companies benefit from established technological expertise, financial resources, and global networks, allowing them to secure major contracts. However, local companies possess a strong understanding of the regional market dynamics and possess cost advantages. This dynamic fosters a competitive environment driving innovation and efficiency improvements. The market's future will hinge on the ability of companies to adapt to evolving technological advancements, manage environmental concerns, and navigate the complex geopolitical landscape. Increased investment in renewable energy sources will also influence the market trajectory, presenting both opportunities and challenges for existing players. The success of oil field service companies will rely on strategic partnerships, technological innovation, and a commitment to sustainability.
South and Central America Oil Field Services Industry: A Comprehensive Market Report (2019-2033)
This detailed report provides a comprehensive analysis of the South and Central America oil field services industry, covering market trends, competitive landscape, growth drivers, and future outlook. The study period spans from 2019 to 2033, with 2025 serving as the base and estimated year. The report offers actionable insights for industry stakeholders, including oil companies, service providers, and investors.
South and Central America Oil Field Services Industry Market Concentration & Innovation
This section analyzes the market concentration, innovation drivers, regulatory frameworks, product substitutes, end-user trends, and M&A activities within the South and Central American oil field services industry. The market is moderately concentrated, with a few major players like Halliburton, Schlumberger, and Baker Hughes holding significant market share, estimated at xx% collectively in 2025. However, regional players and specialized service providers contribute substantially, fostering competition.
Innovation is driven by the need for enhanced efficiency, reduced operational costs, and improved safety standards in oil extraction and production. Stricter environmental regulations are pushing the adoption of cleaner technologies and sustainable practices. Product substitutes, such as renewable energy sources, pose a gradual challenge, but the region's significant oil reserves ensure continued demand for oil field services in the foreseeable future. End-user trends indicate a growing preference for integrated service solutions and technology-driven services that improve operational efficiency and reduce environmental impact.
M&A activities have been moderate in recent years, with deal values estimated at approximately xx Million USD annually in the historical period. Larger players are strategically acquiring smaller companies to expand their service portfolio and gain regional expertise.
- Market Share (2025): Halliburton (xx%), Schlumberger (xx%), Baker Hughes (xx%), Others (xx%)
- M&A Deal Value (2019-2024): Average xx Million USD annually
South and Central America Oil Field Services Industry Industry Trends & Insights
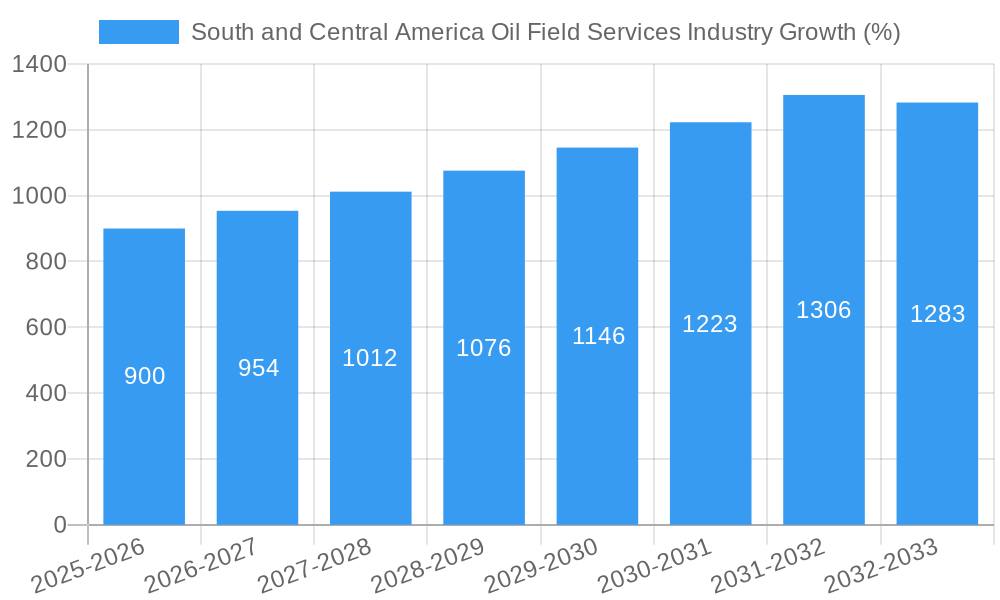
The South and Central American oil field services market is experiencing a period of moderate growth, driven by increasing oil and gas exploration and production activities, particularly in countries like Brazil and Argentina. The Compound Annual Growth Rate (CAGR) is projected at xx% during the forecast period (2025-2033). Technological disruptions, such as the adoption of automation, digitalization, and advanced analytics, are transforming operational efficiency and safety standards. Consumer preferences are shifting towards integrated service offerings, sustainable practices, and technologically advanced solutions. Competitive dynamics are characterized by both cooperation and competition, with larger players focusing on strategic partnerships and acquisitions while smaller players leverage specialized services and regional expertise. Market penetration of advanced technologies like AI and IoT in oil field services is expected to reach xx% by 2033.
Dominant Markets & Segments in South and Central America Oil Field Services Industry
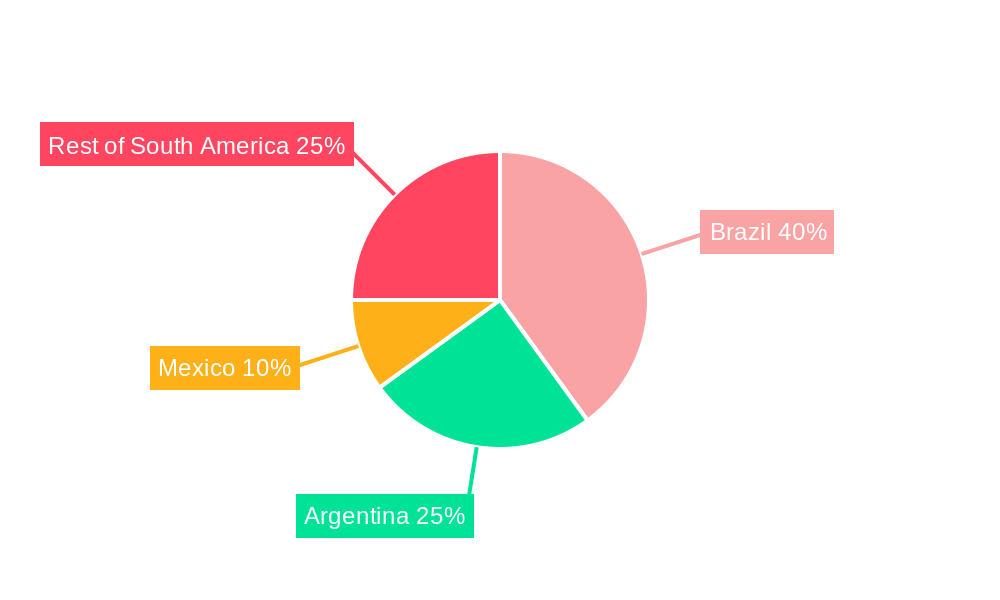
Brazil and Argentina are the dominant markets in the South and Central American oil field services industry, accounting for approximately xx% of the total market in 2025.
Brazil's dominance is driven by:
- Significant oil reserves and ongoing exploration activities.
- Government initiatives to support the energy sector.
- Well-established infrastructure and skilled workforce.
Argentina's significant market share stems from:
- Resurgence in unconventional oil and gas exploration.
- Government policies aimed at attracting foreign investment.
- Opportunities in shale gas development.
While the "Other Types" segment currently dominates (xx% in 2025) encompassing conventional oilfield services, the renewable energy segment (Solar, Wind, Hydro) is projected to show significant growth, albeit from a smaller base, driven by increasing government support for renewable energy initiatives. However, the substantial existing oil and gas infrastructure and continued demand for fossil fuels ensure the dominance of the “Other Types” segment throughout the forecast period.
South and Central America Oil Field Services Industry Product Developments
Recent product innovations include advanced drilling technologies, enhanced oil recovery techniques, and automation solutions aimed at improving efficiency, safety, and environmental performance. These innovations offer significant competitive advantages by reducing operational costs, enhancing productivity, and minimizing environmental impact. The market is witnessing a strong trend towards digitalization and data analytics, leading to the development of sophisticated software and platforms for real-time monitoring, predictive maintenance, and optimized resource allocation.
Report Scope & Segmentation Analysis
This report segments the South and Central American oil field services market by type: Solar, Wind, Hydro, and Other Types (conventional oil field services).
Other Types: This segment is the largest, projected to reach xx Million USD by 2033, driven by sustained demand for traditional oil and gas extraction services. Competition is intense, with both multinational and regional players vying for market share.
Solar, Wind, and Hydro: These segments are currently smaller but exhibit significant growth potential, driven by government initiatives promoting renewable energy and growing environmental awareness. The combined market size for these segments is predicted to reach xx Million USD by 2033. Competition in this segment is expected to intensify with the entry of new players specializing in renewable energy solutions.
Key Drivers of South and Central America Oil Field Services Industry Growth
The growth of the South and Central American oil field services industry is driven by several factors including:
- Increased Exploration & Production Activities: Ongoing exploration and production activities in key regions, particularly Brazil and Argentina, fuel demand for services.
- Technological Advancements: Adoption of advanced technologies enhancing efficiency and reducing costs.
- Government Support: Government initiatives supporting energy sector development attract investment and stimulate growth.
Challenges in the South and Central America Oil Field Services Industry Sector
The industry faces several challenges:
- Regulatory Hurdles: Complex regulatory frameworks and obtaining necessary permits can delay projects and increase costs.
- Supply Chain Issues: Disruptions to global supply chains can impact the availability of essential equipment and materials.
- Geopolitical Instability: Political instability in certain regions can disrupt operations and investment. This is estimated to reduce market growth by xx% in the worst-case scenario.
Emerging Opportunities in South and Central America Oil Field Services Industry
Emerging opportunities include:
- Growth of Renewable Energy: The expanding renewable energy sector creates opportunities for companies offering services in this domain.
- Technological Innovation: Continuous technological advancements present opportunities for companies offering cutting-edge solutions.
- Focus on Sustainability: Growing demand for environmentally friendly solutions opens new avenues for companies committed to sustainable practices.
Leading Players in the South and Central America Oil Field Services Industry Market
Key Developments in South and Central America Oil Field Services Industry Industry
November 2022: Petrobras awarded Diamond Offshore's Ocean Courage a four-year project (USD 429 Million) in Brazil, commencing in Q4 2023. This signals continued investment in offshore oil exploration and production.
February 2022: Archer secured a two-year contract extension (USD 400 Million) for drilling services in Argentina, highlighting the growing activity in the Argentinian oil and gas sector.
Strategic Outlook for South and Central America Oil Field Services Industry Market
The South and Central American oil field services market presents significant growth potential driven by continued exploration and production, technological innovation, and increasing government support for the energy sector. The focus on sustainability and renewable energy offers promising avenues for future growth. However, navigating regulatory complexities and addressing geopolitical risks will be crucial for success. The market is projected to experience a robust expansion, with the highest growth expected in the renewable energy segment and continued strong performance in traditional oilfield services in Brazil and Argentina.
South and Central America Oil Field Services Industry Segmentation
- 1. Production Analysis
- 2. Consumption Analysis
- 3. Import Market Analysis (Value & Volume)
- 4. Export Market Analysis (Value & Volume)
- 5. Price Trend Analysis
South and Central America Oil Field Services Industry Segmentation By Geography
- 1. Mexico
- 2. Brazil
- 3. Argentina
- 4. Rest of The South and Central America
South and Central America Oil Field Services Industry REPORT HIGHLIGHTS
| Aspects | Details |
|---|---|
| Study Period | 2019-2033 |
| Base Year | 2024 |
| Estimated Year | 2025 |
| Forecast Period | 2025-2033 |
| Historical Period | 2019-2024 |
| Growth Rate | CAGR of 4.61% from 2019-2033 |
| Segmentation |
|
Table of Contents
- 1. Introduction
- 1.1. Research Scope
- 1.2. Market Segmentation
- 1.3. Research Methodology
- 1.4. Definitions and Assumptions
- 2. Executive Summary
- 2.1. Introduction
- 3. Market Dynamics
- 3.1. Introduction
- 3.2. Market Drivers
- 3.2.1. 4.; Increasing Number of Offshore Operations 4.; Demand Coming for Unconventional Energy Sources
- 3.3. Market Restrains
- 3.3.1. 4.; Demand for Renewable Energy
- 3.4. Market Trends
- 3.4.1. Drilling Services Expected to dominate the market
- 4. Market Factor Analysis
- 4.1. Porters Five Forces
- 4.2. Supply/Value Chain
- 4.3. PESTEL analysis
- 4.4. Market Entropy
- 4.5. Patent/Trademark Analysis
- 5. Global South and Central America Oil Field Services Industry Analysis, Insights and Forecast, 2019-2031
- 5.1. Market Analysis, Insights and Forecast - by Production Analysis
- 5.2. Market Analysis, Insights and Forecast - by Consumption Analysis
- 5.3. Market Analysis, Insights and Forecast - by Import Market Analysis (Value & Volume)
- 5.4. Market Analysis, Insights and Forecast - by Export Market Analysis (Value & Volume)
- 5.5. Market Analysis, Insights and Forecast - by Price Trend Analysis
- 5.6. Market Analysis, Insights and Forecast - by Region
- 5.6.1. Mexico
- 5.6.2. Brazil
- 5.6.3. Argentina
- 5.6.4. Rest of The South and Central America
- 5.1. Market Analysis, Insights and Forecast - by Production Analysis
- 6. Mexico South and Central America Oil Field Services Industry Analysis, Insights and Forecast, 2019-2031
- 6.1. Market Analysis, Insights and Forecast - by Production Analysis
- 6.2. Market Analysis, Insights and Forecast - by Consumption Analysis
- 6.3. Market Analysis, Insights and Forecast - by Import Market Analysis (Value & Volume)
- 6.4. Market Analysis, Insights and Forecast - by Export Market Analysis (Value & Volume)
- 6.5. Market Analysis, Insights and Forecast - by Price Trend Analysis
- 6.1. Market Analysis, Insights and Forecast - by Production Analysis
- 7. Brazil South and Central America Oil Field Services Industry Analysis, Insights and Forecast, 2019-2031
- 7.1. Market Analysis, Insights and Forecast - by Production Analysis
- 7.2. Market Analysis, Insights and Forecast - by Consumption Analysis
- 7.3. Market Analysis, Insights and Forecast - by Import Market Analysis (Value & Volume)
- 7.4. Market Analysis, Insights and Forecast - by Export Market Analysis (Value & Volume)
- 7.5. Market Analysis, Insights and Forecast - by Price Trend Analysis
- 7.1. Market Analysis, Insights and Forecast - by Production Analysis
- 8. Argentina South and Central America Oil Field Services Industry Analysis, Insights and Forecast, 2019-2031
- 8.1. Market Analysis, Insights and Forecast - by Production Analysis
- 8.2. Market Analysis, Insights and Forecast - by Consumption Analysis
- 8.3. Market Analysis, Insights and Forecast - by Import Market Analysis (Value & Volume)
- 8.4. Market Analysis, Insights and Forecast - by Export Market Analysis (Value & Volume)
- 8.5. Market Analysis, Insights and Forecast - by Price Trend Analysis
- 8.1. Market Analysis, Insights and Forecast - by Production Analysis
- 9. Rest of The South and Central America South and Central America Oil Field Services Industry Analysis, Insights and Forecast, 2019-2031
- 9.1. Market Analysis, Insights and Forecast - by Production Analysis
- 9.2. Market Analysis, Insights and Forecast - by Consumption Analysis
- 9.3. Market Analysis, Insights and Forecast - by Import Market Analysis (Value & Volume)
- 9.4. Market Analysis, Insights and Forecast - by Export Market Analysis (Value & Volume)
- 9.5. Market Analysis, Insights and Forecast - by Price Trend Analysis
- 9.1. Market Analysis, Insights and Forecast - by Production Analysis
- 10. North America South and Central America Oil Field Services Industry Analysis, Insights and Forecast, 2019-2031
- 10.1. Market Analysis, Insights and Forecast - By Country/Sub-region
- 10.1.1 United States
- 10.1.2 Canada
- 10.1.3 Mexico
- 11. Europe South and Central America Oil Field Services Industry Analysis, Insights and Forecast, 2019-2031
- 11.1. Market Analysis, Insights and Forecast - By Country/Sub-region
- 11.1.1 Germany
- 11.1.2 United Kingdom
- 11.1.3 France
- 11.1.4 Spain
- 11.1.5 Italy
- 11.1.6 Spain
- 11.1.7 Belgium
- 11.1.8 Netherland
- 11.1.9 Nordics
- 11.1.10 Rest of Europe
- 12. Asia Pacific South and Central America Oil Field Services Industry Analysis, Insights and Forecast, 2019-2031
- 12.1. Market Analysis, Insights and Forecast - By Country/Sub-region
- 12.1.1 China
- 12.1.2 Japan
- 12.1.3 India
- 12.1.4 South Korea
- 12.1.5 Southeast Asia
- 12.1.6 Australia
- 12.1.7 Indonesia
- 12.1.8 Phillipes
- 12.1.9 Singapore
- 12.1.10 Thailandc
- 12.1.11 Rest of Asia Pacific
- 13. South America South and Central America Oil Field Services Industry Analysis, Insights and Forecast, 2019-2031
- 13.1. Market Analysis, Insights and Forecast - By Country/Sub-region
- 13.1.1 Brazil
- 13.1.2 Argentina
- 13.1.3 Peru
- 13.1.4 Chile
- 13.1.5 Colombia
- 13.1.6 Ecuador
- 13.1.7 Venezuela
- 13.1.8 Rest of South America
- 14. North America South and Central America Oil Field Services Industry Analysis, Insights and Forecast, 2019-2031
- 14.1. Market Analysis, Insights and Forecast - By Country/Sub-region
- 14.1.1 United States
- 14.1.2 Canada
- 14.1.3 Mexico
- 15. MEA South and Central America Oil Field Services Industry Analysis, Insights and Forecast, 2019-2031
- 15.1. Market Analysis, Insights and Forecast - By Country/Sub-region
- 15.1.1 United Arab Emirates
- 15.1.2 Saudi Arabia
- 15.1.3 South Africa
- 15.1.4 Rest of Middle East and Africa
- 16. Competitive Analysis
- 16.1. Global Market Share Analysis 2024
- 16.2. Company Profiles
- 16.2.1 Halliburton
- 16.2.1.1. Overview
- 16.2.1.2. Products
- 16.2.1.3. SWOT Analysis
- 16.2.1.4. Recent Developments
- 16.2.1.5. Financials (Based on Availability)
- 16.2.2 Schlumberger
- 16.2.2.1. Overview
- 16.2.2.2. Products
- 16.2.2.3. SWOT Analysis
- 16.2.2.4. Recent Developments
- 16.2.2.5. Financials (Based on Availability)
- 16.2.3 Baker Hughes
- 16.2.3.1. Overview
- 16.2.3.2. Products
- 16.2.3.3. SWOT Analysis
- 16.2.3.4. Recent Developments
- 16.2.3.5. Financials (Based on Availability)
- 16.2.4 Weatherford International
- 16.2.4.1. Overview
- 16.2.4.2. Products
- 16.2.4.3. SWOT Analysis
- 16.2.4.4. Recent Developments
- 16.2.4.5. Financials (Based on Availability)
- 16.2.5 Expro International
- 16.2.5.1. Overview
- 16.2.5.2. Products
- 16.2.5.3. SWOT Analysis
- 16.2.5.4. Recent Developments
- 16.2.5.5. Financials (Based on Availability)
- 16.2.1 Halliburton
List of Figures
- Figure 1: Global South and Central America Oil Field Services Industry Revenue Breakdown (Million, %) by Region 2024 & 2032
- Figure 2: North America South and Central America Oil Field Services Industry Revenue (Million), by Country 2024 & 2032
- Figure 3: North America South and Central America Oil Field Services Industry Revenue Share (%), by Country 2024 & 2032
- Figure 4: Europe South and Central America Oil Field Services Industry Revenue (Million), by Country 2024 & 2032
- Figure 5: Europe South and Central America Oil Field Services Industry Revenue Share (%), by Country 2024 & 2032
- Figure 6: Asia Pacific South and Central America Oil Field Services Industry Revenue (Million), by Country 2024 & 2032
- Figure 7: Asia Pacific South and Central America Oil Field Services Industry Revenue Share (%), by Country 2024 & 2032
- Figure 8: South America South and Central America Oil Field Services Industry Revenue (Million), by Country 2024 & 2032
- Figure 9: South America South and Central America Oil Field Services Industry Revenue Share (%), by Country 2024 & 2032
- Figure 10: North America South and Central America Oil Field Services Industry Revenue (Million), by Country 2024 & 2032
- Figure 11: North America South and Central America Oil Field Services Industry Revenue Share (%), by Country 2024 & 2032
- Figure 12: MEA South and Central America Oil Field Services Industry Revenue (Million), by Country 2024 & 2032
- Figure 13: MEA South and Central America Oil Field Services Industry Revenue Share (%), by Country 2024 & 2032
- Figure 14: Mexico South and Central America Oil Field Services Industry Revenue (Million), by Production Analysis 2024 & 2032
- Figure 15: Mexico South and Central America Oil Field Services Industry Revenue Share (%), by Production Analysis 2024 & 2032
- Figure 16: Mexico South and Central America Oil Field Services Industry Revenue (Million), by Consumption Analysis 2024 & 2032
- Figure 17: Mexico South and Central America Oil Field Services Industry Revenue Share (%), by Consumption Analysis 2024 & 2032
- Figure 18: Mexico South and Central America Oil Field Services Industry Revenue (Million), by Import Market Analysis (Value & Volume) 2024 & 2032
- Figure 19: Mexico South and Central America Oil Field Services Industry Revenue Share (%), by Import Market Analysis (Value & Volume) 2024 & 2032
- Figure 20: Mexico South and Central America Oil Field Services Industry Revenue (Million), by Export Market Analysis (Value & Volume) 2024 & 2032
- Figure 21: Mexico South and Central America Oil Field Services Industry Revenue Share (%), by Export Market Analysis (Value & Volume) 2024 & 2032
- Figure 22: Mexico South and Central America Oil Field Services Industry Revenue (Million), by Price Trend Analysis 2024 & 2032
- Figure 23: Mexico South and Central America Oil Field Services Industry Revenue Share (%), by Price Trend Analysis 2024 & 2032
- Figure 24: Mexico South and Central America Oil Field Services Industry Revenue (Million), by Country 2024 & 2032
- Figure 25: Mexico South and Central America Oil Field Services Industry Revenue Share (%), by Country 2024 & 2032
- Figure 26: Brazil South and Central America Oil Field Services Industry Revenue (Million), by Production Analysis 2024 & 2032
- Figure 27: Brazil South and Central America Oil Field Services Industry Revenue Share (%), by Production Analysis 2024 & 2032
- Figure 28: Brazil South and Central America Oil Field Services Industry Revenue (Million), by Consumption Analysis 2024 & 2032
- Figure 29: Brazil South and Central America Oil Field Services Industry Revenue Share (%), by Consumption Analysis 2024 & 2032
- Figure 30: Brazil South and Central America Oil Field Services Industry Revenue (Million), by Import Market Analysis (Value & Volume) 2024 & 2032
- Figure 31: Brazil South and Central America Oil Field Services Industry Revenue Share (%), by Import Market Analysis (Value & Volume) 2024 & 2032
- Figure 32: Brazil South and Central America Oil Field Services Industry Revenue (Million), by Export Market Analysis (Value & Volume) 2024 & 2032
- Figure 33: Brazil South and Central America Oil Field Services Industry Revenue Share (%), by Export Market Analysis (Value & Volume) 2024 & 2032
- Figure 34: Brazil South and Central America Oil Field Services Industry Revenue (Million), by Price Trend Analysis 2024 & 2032
- Figure 35: Brazil South and Central America Oil Field Services Industry Revenue Share (%), by Price Trend Analysis 2024 & 2032
- Figure 36: Brazil South and Central America Oil Field Services Industry Revenue (Million), by Country 2024 & 2032
- Figure 37: Brazil South and Central America Oil Field Services Industry Revenue Share (%), by Country 2024 & 2032
- Figure 38: Argentina South and Central America Oil Field Services Industry Revenue (Million), by Production Analysis 2024 & 2032
- Figure 39: Argentina South and Central America Oil Field Services Industry Revenue Share (%), by Production Analysis 2024 & 2032
- Figure 40: Argentina South and Central America Oil Field Services Industry Revenue (Million), by Consumption Analysis 2024 & 2032
- Figure 41: Argentina South and Central America Oil Field Services Industry Revenue Share (%), by Consumption Analysis 2024 & 2032
- Figure 42: Argentina South and Central America Oil Field Services Industry Revenue (Million), by Import Market Analysis (Value & Volume) 2024 & 2032
- Figure 43: Argentina South and Central America Oil Field Services Industry Revenue Share (%), by Import Market Analysis (Value & Volume) 2024 & 2032
- Figure 44: Argentina South and Central America Oil Field Services Industry Revenue (Million), by Export Market Analysis (Value & Volume) 2024 & 2032
- Figure 45: Argentina South and Central America Oil Field Services Industry Revenue Share (%), by Export Market Analysis (Value & Volume) 2024 & 2032
- Figure 46: Argentina South and Central America Oil Field Services Industry Revenue (Million), by Price Trend Analysis 2024 & 2032
- Figure 47: Argentina South and Central America Oil Field Services Industry Revenue Share (%), by Price Trend Analysis 2024 & 2032
- Figure 48: Argentina South and Central America Oil Field Services Industry Revenue (Million), by Country 2024 & 2032
- Figure 49: Argentina South and Central America Oil Field Services Industry Revenue Share (%), by Country 2024 & 2032
- Figure 50: Rest of The South and Central America South and Central America Oil Field Services Industry Revenue (Million), by Production Analysis 2024 & 2032
- Figure 51: Rest of The South and Central America South and Central America Oil Field Services Industry Revenue Share (%), by Production Analysis 2024 & 2032
- Figure 52: Rest of The South and Central America South and Central America Oil Field Services Industry Revenue (Million), by Consumption Analysis 2024 & 2032
- Figure 53: Rest of The South and Central America South and Central America Oil Field Services Industry Revenue Share (%), by Consumption Analysis 2024 & 2032
- Figure 54: Rest of The South and Central America South and Central America Oil Field Services Industry Revenue (Million), by Import Market Analysis (Value & Volume) 2024 & 2032
- Figure 55: Rest of The South and Central America South and Central America Oil Field Services Industry Revenue Share (%), by Import Market Analysis (Value & Volume) 2024 & 2032
- Figure 56: Rest of The South and Central America South and Central America Oil Field Services Industry Revenue (Million), by Export Market Analysis (Value & Volume) 2024 & 2032
- Figure 57: Rest of The South and Central America South and Central America Oil Field Services Industry Revenue Share (%), by Export Market Analysis (Value & Volume) 2024 & 2032
- Figure 58: Rest of The South and Central America South and Central America Oil Field Services Industry Revenue (Million), by Price Trend Analysis 2024 & 2032
- Figure 59: Rest of The South and Central America South and Central America Oil Field Services Industry Revenue Share (%), by Price Trend Analysis 2024 & 2032
- Figure 60: Rest of The South and Central America South and Central America Oil Field Services Industry Revenue (Million), by Country 2024 & 2032
- Figure 61: Rest of The South and Central America South and Central America Oil Field Services Industry Revenue Share (%), by Country 2024 & 2032
List of Tables
- Table 1: Global South and Central America Oil Field Services Industry Revenue Million Forecast, by Region 2019 & 2032
- Table 2: Global South and Central America Oil Field Services Industry Revenue Million Forecast, by Production Analysis 2019 & 2032
- Table 3: Global South and Central America Oil Field Services Industry Revenue Million Forecast, by Consumption Analysis 2019 & 2032
- Table 4: Global South and Central America Oil Field Services Industry Revenue Million Forecast, by Import Market Analysis (Value & Volume) 2019 & 2032
- Table 5: Global South and Central America Oil Field Services Industry Revenue Million Forecast, by Export Market Analysis (Value & Volume) 2019 & 2032
- Table 6: Global South and Central America Oil Field Services Industry Revenue Million Forecast, by Price Trend Analysis 2019 & 2032
- Table 7: Global South and Central America Oil Field Services Industry Revenue Million Forecast, by Region 2019 & 2032
- Table 8: Global South and Central America Oil Field Services Industry Revenue Million Forecast, by Country 2019 & 2032
- Table 9: United States South and Central America Oil Field Services Industry Revenue (Million) Forecast, by Application 2019 & 2032
- Table 10: Canada South and Central America Oil Field Services Industry Revenue (Million) Forecast, by Application 2019 & 2032
- Table 11: Mexico South and Central America Oil Field Services Industry Revenue (Million) Forecast, by Application 2019 & 2032
- Table 12: Global South and Central America Oil Field Services Industry Revenue Million Forecast, by Country 2019 & 2032
- Table 13: Germany South and Central America Oil Field Services Industry Revenue (Million) Forecast, by Application 2019 & 2032
- Table 14: United Kingdom South and Central America Oil Field Services Industry Revenue (Million) Forecast, by Application 2019 & 2032
- Table 15: France South and Central America Oil Field Services Industry Revenue (Million) Forecast, by Application 2019 & 2032
- Table 16: Spain South and Central America Oil Field Services Industry Revenue (Million) Forecast, by Application 2019 & 2032
- Table 17: Italy South and Central America Oil Field Services Industry Revenue (Million) Forecast, by Application 2019 & 2032
- Table 18: Spain South and Central America Oil Field Services Industry Revenue (Million) Forecast, by Application 2019 & 2032
- Table 19: Belgium South and Central America Oil Field Services Industry Revenue (Million) Forecast, by Application 2019 & 2032
- Table 20: Netherland South and Central America Oil Field Services Industry Revenue (Million) Forecast, by Application 2019 & 2032
- Table 21: Nordics South and Central America Oil Field Services Industry Revenue (Million) Forecast, by Application 2019 & 2032
- Table 22: Rest of Europe South and Central America Oil Field Services Industry Revenue (Million) Forecast, by Application 2019 & 2032
- Table 23: Global South and Central America Oil Field Services Industry Revenue Million Forecast, by Country 2019 & 2032
- Table 24: China South and Central America Oil Field Services Industry Revenue (Million) Forecast, by Application 2019 & 2032
- Table 25: Japan South and Central America Oil Field Services Industry Revenue (Million) Forecast, by Application 2019 & 2032
- Table 26: India South and Central America Oil Field Services Industry Revenue (Million) Forecast, by Application 2019 & 2032
- Table 27: South Korea South and Central America Oil Field Services Industry Revenue (Million) Forecast, by Application 2019 & 2032
- Table 28: Southeast Asia South and Central America Oil Field Services Industry Revenue (Million) Forecast, by Application 2019 & 2032
- Table 29: Australia South and Central America Oil Field Services Industry Revenue (Million) Forecast, by Application 2019 & 2032
- Table 30: Indonesia South and Central America Oil Field Services Industry Revenue (Million) Forecast, by Application 2019 & 2032
- Table 31: Phillipes South and Central America Oil Field Services Industry Revenue (Million) Forecast, by Application 2019 & 2032
- Table 32: Singapore South and Central America Oil Field Services Industry Revenue (Million) Forecast, by Application 2019 & 2032
- Table 33: Thailandc South and Central America Oil Field Services Industry Revenue (Million) Forecast, by Application 2019 & 2032
- Table 34: Rest of Asia Pacific South and Central America Oil Field Services Industry Revenue (Million) Forecast, by Application 2019 & 2032
- Table 35: Global South and Central America Oil Field Services Industry Revenue Million Forecast, by Country 2019 & 2032
- Table 36: Brazil South and Central America Oil Field Services Industry Revenue (Million) Forecast, by Application 2019 & 2032
- Table 37: Argentina South and Central America Oil Field Services Industry Revenue (Million) Forecast, by Application 2019 & 2032
- Table 38: Peru South and Central America Oil Field Services Industry Revenue (Million) Forecast, by Application 2019 & 2032
- Table 39: Chile South and Central America Oil Field Services Industry Revenue (Million) Forecast, by Application 2019 & 2032
- Table 40: Colombia South and Central America Oil Field Services Industry Revenue (Million) Forecast, by Application 2019 & 2032
- Table 41: Ecuador South and Central America Oil Field Services Industry Revenue (Million) Forecast, by Application 2019 & 2032
- Table 42: Venezuela South and Central America Oil Field Services Industry Revenue (Million) Forecast, by Application 2019 & 2032
- Table 43: Rest of South America South and Central America Oil Field Services Industry Revenue (Million) Forecast, by Application 2019 & 2032
- Table 44: Global South and Central America Oil Field Services Industry Revenue Million Forecast, by Country 2019 & 2032
- Table 45: United States South and Central America Oil Field Services Industry Revenue (Million) Forecast, by Application 2019 & 2032
- Table 46: Canada South and Central America Oil Field Services Industry Revenue (Million) Forecast, by Application 2019 & 2032
- Table 47: Mexico South and Central America Oil Field Services Industry Revenue (Million) Forecast, by Application 2019 & 2032
- Table 48: Global South and Central America Oil Field Services Industry Revenue Million Forecast, by Country 2019 & 2032
- Table 49: United Arab Emirates South and Central America Oil Field Services Industry Revenue (Million) Forecast, by Application 2019 & 2032
- Table 50: Saudi Arabia South and Central America Oil Field Services Industry Revenue (Million) Forecast, by Application 2019 & 2032
- Table 51: South Africa South and Central America Oil Field Services Industry Revenue (Million) Forecast, by Application 2019 & 2032
- Table 52: Rest of Middle East and Africa South and Central America Oil Field Services Industry Revenue (Million) Forecast, by Application 2019 & 2032
- Table 53: Global South and Central America Oil Field Services Industry Revenue Million Forecast, by Production Analysis 2019 & 2032
- Table 54: Global South and Central America Oil Field Services Industry Revenue Million Forecast, by Consumption Analysis 2019 & 2032
- Table 55: Global South and Central America Oil Field Services Industry Revenue Million Forecast, by Import Market Analysis (Value & Volume) 2019 & 2032
- Table 56: Global South and Central America Oil Field Services Industry Revenue Million Forecast, by Export Market Analysis (Value & Volume) 2019 & 2032
- Table 57: Global South and Central America Oil Field Services Industry Revenue Million Forecast, by Price Trend Analysis 2019 & 2032
- Table 58: Global South and Central America Oil Field Services Industry Revenue Million Forecast, by Country 2019 & 2032
- Table 59: Global South and Central America Oil Field Services Industry Revenue Million Forecast, by Production Analysis 2019 & 2032
- Table 60: Global South and Central America Oil Field Services Industry Revenue Million Forecast, by Consumption Analysis 2019 & 2032
- Table 61: Global South and Central America Oil Field Services Industry Revenue Million Forecast, by Import Market Analysis (Value & Volume) 2019 & 2032
- Table 62: Global South and Central America Oil Field Services Industry Revenue Million Forecast, by Export Market Analysis (Value & Volume) 2019 & 2032
- Table 63: Global South and Central America Oil Field Services Industry Revenue Million Forecast, by Price Trend Analysis 2019 & 2032
- Table 64: Global South and Central America Oil Field Services Industry Revenue Million Forecast, by Country 2019 & 2032
- Table 65: Global South and Central America Oil Field Services Industry Revenue Million Forecast, by Production Analysis 2019 & 2032
- Table 66: Global South and Central America Oil Field Services Industry Revenue Million Forecast, by Consumption Analysis 2019 & 2032
- Table 67: Global South and Central America Oil Field Services Industry Revenue Million Forecast, by Import Market Analysis (Value & Volume) 2019 & 2032
- Table 68: Global South and Central America Oil Field Services Industry Revenue Million Forecast, by Export Market Analysis (Value & Volume) 2019 & 2032
- Table 69: Global South and Central America Oil Field Services Industry Revenue Million Forecast, by Price Trend Analysis 2019 & 2032
- Table 70: Global South and Central America Oil Field Services Industry Revenue Million Forecast, by Country 2019 & 2032
- Table 71: Global South and Central America Oil Field Services Industry Revenue Million Forecast, by Production Analysis 2019 & 2032
- Table 72: Global South and Central America Oil Field Services Industry Revenue Million Forecast, by Consumption Analysis 2019 & 2032
- Table 73: Global South and Central America Oil Field Services Industry Revenue Million Forecast, by Import Market Analysis (Value & Volume) 2019 & 2032
- Table 74: Global South and Central America Oil Field Services Industry Revenue Million Forecast, by Export Market Analysis (Value & Volume) 2019 & 2032
- Table 75: Global South and Central America Oil Field Services Industry Revenue Million Forecast, by Price Trend Analysis 2019 & 2032
- Table 76: Global South and Central America Oil Field Services Industry Revenue Million Forecast, by Country 2019 & 2032
Frequently Asked Questions
1. What is the projected Compound Annual Growth Rate (CAGR) of the South and Central America Oil Field Services Industry?
The projected CAGR is approximately 4.61%.
2. Which companies are prominent players in the South and Central America Oil Field Services Industry?
Key companies in the market include Halliburton , Schlumberger , Baker Hughes , Weatherford International , Expro International.
3. What are the main segments of the South and Central America Oil Field Services Industry?
The market segments include Production Analysis, Consumption Analysis, Import Market Analysis (Value & Volume), Export Market Analysis (Value & Volume), Price Trend Analysis.
4. Can you provide details about the market size?
The market size is estimated to be USD XX Million as of 2022.
5. What are some drivers contributing to market growth?
4.; Increasing Number of Offshore Operations 4.; Demand Coming for Unconventional Energy Sources.
6. What are the notable trends driving market growth?
Drilling Services Expected to dominate the market.
7. Are there any restraints impacting market growth?
4.; Demand for Renewable Energy.
8. Can you provide examples of recent developments in the market?
November 2022: Petrobras awarded Diamond Offshore's Ocean Courage a four-year project with an unpriced option for an additional four years in Brazil. The estimated total value of the firm term of the award, which includes a mobilization fee and the provision of some extra services, is about USD 429 million.The contract is expected to commence in Q4 2023.
9. What pricing options are available for accessing the report?
Pricing options include single-user, multi-user, and enterprise licenses priced at USD 4750, USD 5250, and USD 8750 respectively.
10. Is the market size provided in terms of value or volume?
The market size is provided in terms of value, measured in Million.
11. Are there any specific market keywords associated with the report?
Yes, the market keyword associated with the report is "South and Central America Oil Field Services Industry," which aids in identifying and referencing the specific market segment covered.
12. How do I determine which pricing option suits my needs best?
The pricing options vary based on user requirements and access needs. Individual users may opt for single-user licenses, while businesses requiring broader access may choose multi-user or enterprise licenses for cost-effective access to the report.
13. Are there any additional resources or data provided in the South and Central America Oil Field Services Industry report?
While the report offers comprehensive insights, it's advisable to review the specific contents or supplementary materials provided to ascertain if additional resources or data are available.
14. How can I stay updated on further developments or reports in the South and Central America Oil Field Services Industry?
To stay informed about further developments, trends, and reports in the South and Central America Oil Field Services Industry, consider subscribing to industry newsletters, following relevant companies and organizations, or regularly checking reputable industry news sources and publications.
Methodology
Step 1 - Identification of Relevant Samples Size from Population Database


Step 2 - Approaches for Defining Global Market Size (Value, Volume* & Price*)

Note*: In applicable scenarios
Step 3 - Data Sources
Primary Research
- Web Analytics
- Survey Reports
- Research Institute
- Latest Research Reports
- Opinion Leaders
Secondary Research
- Annual Reports
- White Paper
- Latest Press Release
- Industry Association
- Paid Database
- Investor Presentations

Step 4 - Data Triangulation
Involves using different sources of information in order to increase the validity of a study
These sources are likely to be stakeholders in a program - participants, other researchers, program staff, other community members, and so on.
Then we put all data in single framework & apply various statistical tools to find out the dynamic on the market.
During the analysis stage, feedback from the stakeholder groups would be compared to determine areas of agreement as well as areas of divergence


