
Key Insights
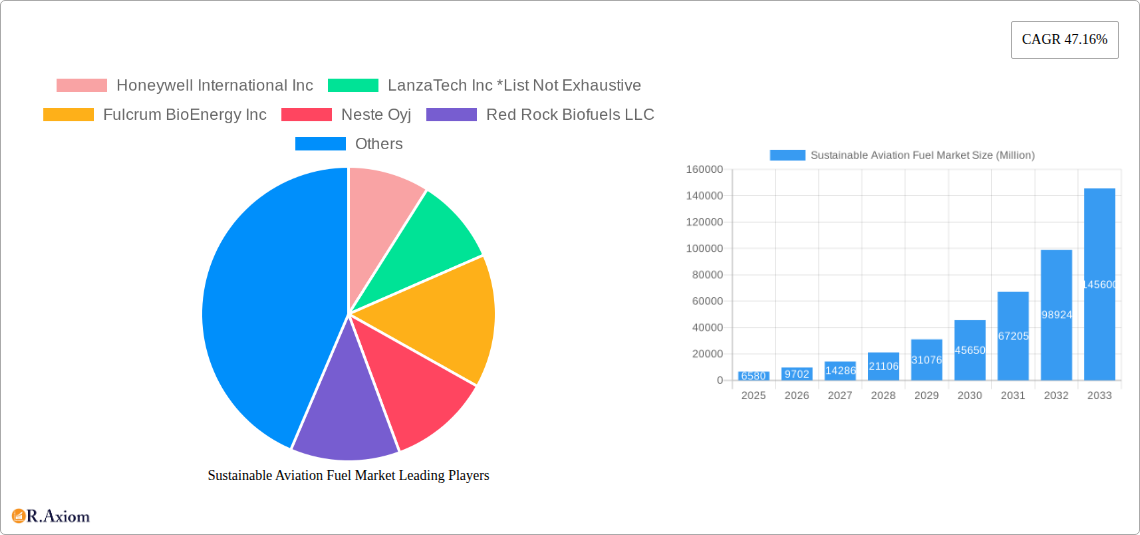
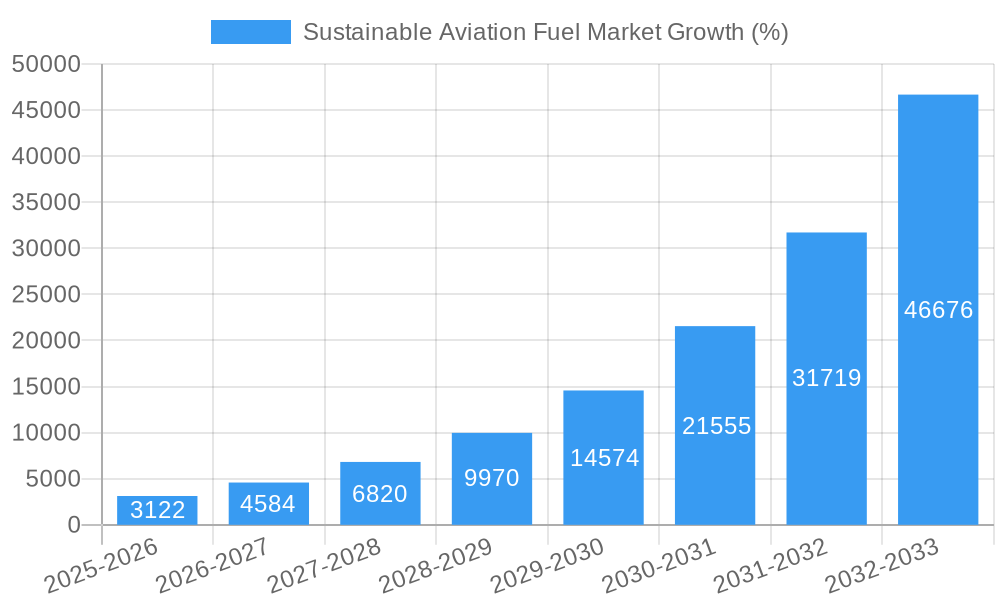
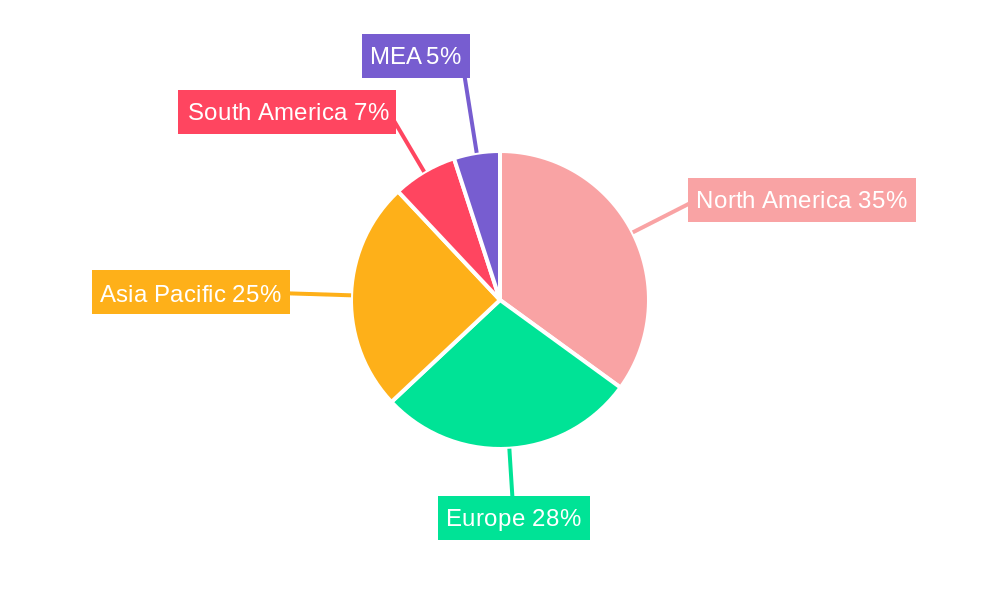
The Sustainable Aviation Fuel (SAF) market is experiencing explosive growth, projected to reach \$6.58 billion in 2025 and expand at a remarkable Compound Annual Growth Rate (CAGR) of 47.16% from 2025 to 2033. This surge is driven by increasing environmental concerns, stringent government regulations aimed at reducing aviation's carbon footprint, and a growing commitment from airlines to achieve net-zero emissions targets. Key technological advancements in Fischer-Tropsch (FT) synthesis, Hydroprocessed Esters and Fatty Acids (HEFA), Synthesized Iso-Paraffinic (SIP), and Alcohol-to-Jet (AJT) production methods are further fueling market expansion. The commercial aviation sector currently dominates application, but defense applications are emerging as a significant growth segment. Major players like Honeywell International Inc., LanzaTech Inc., and Neste Oyj are heavily investing in research and development, capacity expansion, and strategic partnerships to capitalize on this burgeoning market. The geographical distribution shows strong growth across North America, Europe, and Asia Pacific, with North America currently holding a significant market share due to robust government support and a well-established infrastructure. However, rapid growth is expected in the Asia-Pacific region driven by increasing air travel demand and government initiatives.
The market's restraints primarily involve the high production costs of SAF compared to conventional jet fuel and the limited scalability of current production technologies. Furthermore, the availability of sustainable feedstocks like used cooking oil and agricultural residues remains a challenge, particularly in regions with limited resources. Nevertheless, ongoing innovation in feedstock utilization, advancements in production efficiency, and supportive government policies are progressively addressing these challenges, paving the way for a substantial increase in SAF adoption and a significant reduction in the aviation industry's environmental impact in the coming years. The market is expected to see significant consolidation as larger players acquire smaller companies and technologies, leading to further innovation and economies of scale.
Sustainable Aviation Fuel Market: A Comprehensive Report (2019-2033)
This in-depth report provides a comprehensive analysis of the Sustainable Aviation Fuel (SAF) market, covering market size, growth projections, technological advancements, regulatory landscape, and key players. The study period spans from 2019 to 2033, with 2025 serving as the base and estimated year. The report offers actionable insights for industry stakeholders, investors, and policymakers seeking to navigate this rapidly evolving sector.
Sustainable Aviation Fuel Market Concentration & Innovation
This section analyzes the competitive landscape of the SAF market, examining market concentration, innovation drivers, regulatory frameworks, product substitutes, end-user trends, and mergers & acquisitions (M&A) activities. The market is currently characterized by a moderate level of concentration, with a few major players holding significant market share. However, the emergence of numerous startups and the entry of established energy companies are increasing competition. The global SAF market is estimated at xx Million in 2025, exhibiting a CAGR of xx% during the forecast period (2025-2033). Market share data for key players (e.g., Neste Oyj, Honeywell International Inc.) will be provided, alongside analysis of M&A deal values (totaling xx Million in the last five years).
- Innovation Drivers: Stringent emission reduction targets, advancements in feedstock technologies, and government incentives are driving innovation.
- Regulatory Frameworks: Government policies, such as carbon taxes and mandates for SAF blending, are significantly shaping market dynamics.
- Product Substitutes: While SAF is currently the most promising alternative to conventional jet fuel, other options like hydrogen and electric propulsion are also under development.
- End-User Trends: Airlines are increasingly adopting SAF to meet their sustainability goals, driving market demand.
- M&A Activity: Consolidation within the sector is expected to accelerate, as larger companies acquire smaller players to secure access to technology and feedstock.
Sustainable Aviation Fuel Market Industry Trends & Insights
This section delves into the key trends shaping the SAF market, including market growth drivers, technological disruptions, consumer preferences, and competitive dynamics. The market is experiencing rapid growth fueled by rising environmental concerns, stricter emission regulations, and the increasing affordability of SAF. Technological advancements, such as improved process efficiency and the utilization of diverse feedstocks, are further accelerating market expansion.
The report will analyze consumer preferences (e.g., airline and consumer demand for sustainable travel options), exploring the impact on market dynamics. Competitive dynamics, including pricing strategies, innovation, and market positioning of key players, are also analyzed. Specific metrics such as the Compound Annual Growth Rate (CAGR) and market penetration rates for different SAF technologies will be detailed.
Dominant Markets & Segments in Sustainable Aviation Fuel Market
This section identifies the leading regions, countries, and segments within the SAF market, focusing on Technology (Fischer-Tropsch (FT), Hydroprocessed Esters and Fatty Acids (HEFA), Synthesized Iso-Paraffinic (SIP), and Alcohol-to-Jet (AJT)) and Application (Commercial, Defense).
- Leading Regions/Countries: (Analysis of market share and growth drivers for specific regions and countries will be provided.) Factors like government support, feedstock availability, and infrastructure development will be key considerations in determining market dominance.
- Technology Segments: HEFA is currently the leading technology segment due to its maturity and availability. However, other technologies like SIP and AJT are projected to gain traction with technological advancements.
- Application Segments: The Commercial segment currently holds a dominant share of the market, driven by increasing demand from airlines. The Defense segment is expected to exhibit considerable growth due to increased focus on sustainable practices within the military.
Sustainable Aviation Fuel Market Product Developments
This section summarizes recent product innovations, applications, and competitive advantages in the SAF market, highlighting technological trends and their market fit. Key developments include the introduction of new feedstocks, improvements in production efficiency, and the development of more sustainable and cost-effective production methods. The focus is on the evolving technological landscape and how it shapes the competitive dynamics of the market.
Report Scope & Segmentation Analysis
This section details the market segmentation, including the technologies (Fischer-Tropsch (FT), Hydroprocessed Esters and Fatty Acids (HEFA), Synthesized Iso-Paraffinic (SIP), and Alcohol-to-Jet (AJT)) and applications (Commercial, Defense). Each segment's growth projections, market sizes, and competitive dynamics will be analyzed individually. Detailed breakdowns of market size, growth rates, and key players in each segment will be presented.
Key Drivers of Sustainable Aviation Fuel Market Growth
This section outlines the key drivers of SAF market growth, emphasizing technological advancements, economic factors, and supportive government regulations. Examples include carbon emission reduction targets, increasing airline commitments to sustainability, and government incentives for SAF production.
Challenges in the Sustainable Aviation Fuel Market Sector
This section identifies and analyzes the challenges and restraints hindering SAF market growth, including regulatory hurdles, supply chain issues (feedstock availability and logistical limitations), and intense competitive pressure. Quantifiable impacts of these challenges on market growth will be assessed.
Emerging Opportunities in Sustainable Aviation Fuel Market
This section highlights emerging opportunities in the SAF market, such as new market segments, technological innovations, and shifts in consumer preferences. The potential for growth in emerging markets and advancements in production technologies will be discussed.
Leading Players in the Sustainable Aviation Fuel Market Market
- Honeywell International Inc. (Honeywell International Inc.)
- LanzaTech Inc. (LanzaTech Inc.)
- Fulcrum BioEnergy Inc.
- Neste Oyj (Neste Oyj)
- Red Rock Biofuels LLC
- Swedish Biofuels AB
- SG Preston Company
- TotalEnergies SE (TotalEnergies SE)
- Gevo Inc. (Gevo Inc.)
Key Developments in Sustainable Aviation Fuel Market Industry
- May 2023: Twelve and Etihad Airways signed an MOU to collaborate on E-Jet® fuel.
- February 2022: Engie SA and Infinium Holdings announced a EUR 500 Million project to produce renewable fuels in France.
- February 2022: Boeing announced a supply agreement for two million gallons of blended SAF with EPIC Fuels.
Strategic Outlook for Sustainable Aviation Fuel Market Market
This section summarizes the growth catalysts and future market potential of the SAF sector. The report concludes by offering a strategic outlook, highlighting opportunities for growth and innovation in the years to come. The increasing demand for sustainable air travel, coupled with technological advancements and supportive government policies, points to a promising future for the SAF market.
Sustainable Aviation Fuel Market Segmentation
-
1. Technology
- 1.1. Fischer-Tropsch (FT)
- 1.2. Hydroprocessed Esters and Fatty Acids (HEFA)
- 1.3. Synthesi
-
2. Application
- 2.1. Commercial
- 2.2. Defense
Sustainable Aviation Fuel Market Segmentation By Geography
-
1. North America
- 1.1. United States of America
- 1.2. Canada
- 1.3. Rest of the North America
-
2. Asia Pacific
- 2.1. China
- 2.2. India
- 2.3. Japan
- 2.4. Rest of the Asia Pacific
-
3. Europe
- 3.1. United Kingdom
- 3.2. France
- 3.3. Germany
- 3.4. Rest of the Europe
-
4. South America
- 4.1. Brazil
- 4.2. Argentina
- 4.3. Rest of the South America
-
5. Middle East and Africa
- 5.1. United Arab Emirates
- 5.2. Saudi Arabia
- 5.3. Qatar
- 5.4. Rest of the Middle East and Africa
Sustainable Aviation Fuel Market REPORT HIGHLIGHTS
| Aspects | Details |
|---|---|
| Study Period | 2019-2033 |
| Base Year | 2024 |
| Estimated Year | 2025 |
| Forecast Period | 2025-2033 |
| Historical Period | 2019-2024 |
| Growth Rate | CAGR of 47.16% from 2019-2033 |
| Segmentation |
|
Table of Contents
- 1. Introduction
- 1.1. Research Scope
- 1.2. Market Segmentation
- 1.3. Research Methodology
- 1.4. Definitions and Assumptions
- 2. Executive Summary
- 2.1. Introduction
- 3. Market Dynamics
- 3.1. Introduction
- 3.2. Market Drivers
- 3.2.1. 4.; Increased Government Regulations for Greenhouse Gas Emissions 4.; Encouraging Production and Consumption of Renewable Aviation Fuel
- 3.3. Market Restrains
- 3.3.1. 4.; The High Costs of Renewable Aviation Fuel
- 3.4. Market Trends
- 3.4.1. Hydroprocessed Esters and Fatty Acids (HEFA) Technology to Dominate the Market
- 4. Market Factor Analysis
- 4.1. Porters Five Forces
- 4.2. Supply/Value Chain
- 4.3. PESTEL analysis
- 4.4. Market Entropy
- 4.5. Patent/Trademark Analysis
- 5. Global Sustainable Aviation Fuel Market Analysis, Insights and Forecast, 2019-2031
- 5.1. Market Analysis, Insights and Forecast - by Technology
- 5.1.1. Fischer-Tropsch (FT)
- 5.1.2. Hydroprocessed Esters and Fatty Acids (HEFA)
- 5.1.3. Synthesi
- 5.2. Market Analysis, Insights and Forecast - by Application
- 5.2.1. Commercial
- 5.2.2. Defense
- 5.3. Market Analysis, Insights and Forecast - by Region
- 5.3.1. North America
- 5.3.2. Asia Pacific
- 5.3.3. Europe
- 5.3.4. South America
- 5.3.5. Middle East and Africa
- 5.1. Market Analysis, Insights and Forecast - by Technology
- 6. North America Sustainable Aviation Fuel Market Analysis, Insights and Forecast, 2019-2031
- 6.1. Market Analysis, Insights and Forecast - by Technology
- 6.1.1. Fischer-Tropsch (FT)
- 6.1.2. Hydroprocessed Esters and Fatty Acids (HEFA)
- 6.1.3. Synthesi
- 6.2. Market Analysis, Insights and Forecast - by Application
- 6.2.1. Commercial
- 6.2.2. Defense
- 6.1. Market Analysis, Insights and Forecast - by Technology
- 7. Asia Pacific Sustainable Aviation Fuel Market Analysis, Insights and Forecast, 2019-2031
- 7.1. Market Analysis, Insights and Forecast - by Technology
- 7.1.1. Fischer-Tropsch (FT)
- 7.1.2. Hydroprocessed Esters and Fatty Acids (HEFA)
- 7.1.3. Synthesi
- 7.2. Market Analysis, Insights and Forecast - by Application
- 7.2.1. Commercial
- 7.2.2. Defense
- 7.1. Market Analysis, Insights and Forecast - by Technology
- 8. Europe Sustainable Aviation Fuel Market Analysis, Insights and Forecast, 2019-2031
- 8.1. Market Analysis, Insights and Forecast - by Technology
- 8.1.1. Fischer-Tropsch (FT)
- 8.1.2. Hydroprocessed Esters and Fatty Acids (HEFA)
- 8.1.3. Synthesi
- 8.2. Market Analysis, Insights and Forecast - by Application
- 8.2.1. Commercial
- 8.2.2. Defense
- 8.1. Market Analysis, Insights and Forecast - by Technology
- 9. South America Sustainable Aviation Fuel Market Analysis, Insights and Forecast, 2019-2031
- 9.1. Market Analysis, Insights and Forecast - by Technology
- 9.1.1. Fischer-Tropsch (FT)
- 9.1.2. Hydroprocessed Esters and Fatty Acids (HEFA)
- 9.1.3. Synthesi
- 9.2. Market Analysis, Insights and Forecast - by Application
- 9.2.1. Commercial
- 9.2.2. Defense
- 9.1. Market Analysis, Insights and Forecast - by Technology
- 10. Middle East and Africa Sustainable Aviation Fuel Market Analysis, Insights and Forecast, 2019-2031
- 10.1. Market Analysis, Insights and Forecast - by Technology
- 10.1.1. Fischer-Tropsch (FT)
- 10.1.2. Hydroprocessed Esters and Fatty Acids (HEFA)
- 10.1.3. Synthesi
- 10.2. Market Analysis, Insights and Forecast - by Application
- 10.2.1. Commercial
- 10.2.2. Defense
- 10.1. Market Analysis, Insights and Forecast - by Technology
- 11. North America Sustainable Aviation Fuel Market Analysis, Insights and Forecast, 2019-2031
- 11.1. Market Analysis, Insights and Forecast - By Country/Sub-region
- 11.1.1 United States
- 11.1.2 Canada
- 11.1.3 Mexico
- 12. Europe Sustainable Aviation Fuel Market Analysis, Insights and Forecast, 2019-2031
- 12.1. Market Analysis, Insights and Forecast - By Country/Sub-region
- 12.1.1 Germany
- 12.1.2 United Kingdom
- 12.1.3 France
- 12.1.4 Spain
- 12.1.5 Italy
- 12.1.6 Spain
- 12.1.7 Belgium
- 12.1.8 Netherland
- 12.1.9 Nordics
- 12.1.10 Rest of Europe
- 13. Asia Pacific Sustainable Aviation Fuel Market Analysis, Insights and Forecast, 2019-2031
- 13.1. Market Analysis, Insights and Forecast - By Country/Sub-region
- 13.1.1 China
- 13.1.2 Japan
- 13.1.3 India
- 13.1.4 South Korea
- 13.1.5 Southeast Asia
- 13.1.6 Australia
- 13.1.7 Indonesia
- 13.1.8 Phillipes
- 13.1.9 Singapore
- 13.1.10 Thailandc
- 13.1.11 Rest of Asia Pacific
- 14. South America Sustainable Aviation Fuel Market Analysis, Insights and Forecast, 2019-2031
- 14.1. Market Analysis, Insights and Forecast - By Country/Sub-region
- 14.1.1 Brazil
- 14.1.2 Argentina
- 14.1.3 Peru
- 14.1.4 Chile
- 14.1.5 Colombia
- 14.1.6 Ecuador
- 14.1.7 Venezuela
- 14.1.8 Rest of South America
- 15. North America Sustainable Aviation Fuel Market Analysis, Insights and Forecast, 2019-2031
- 15.1. Market Analysis, Insights and Forecast - By Country/Sub-region
- 15.1.1 United States
- 15.1.2 Canada
- 15.1.3 Mexico
- 16. MEA Sustainable Aviation Fuel Market Analysis, Insights and Forecast, 2019-2031
- 16.1. Market Analysis, Insights and Forecast - By Country/Sub-region
- 16.1.1 United Arab Emirates
- 16.1.2 Saudi Arabia
- 16.1.3 South Africa
- 16.1.4 Rest of Middle East and Africa
- 17. Competitive Analysis
- 17.1. Global Market Share Analysis 2024
- 17.2. Company Profiles
- 17.2.1 Honeywell International Inc
- 17.2.1.1. Overview
- 17.2.1.2. Products
- 17.2.1.3. SWOT Analysis
- 17.2.1.4. Recent Developments
- 17.2.1.5. Financials (Based on Availability)
- 17.2.2 LanzaTech Inc *List Not Exhaustive
- 17.2.2.1. Overview
- 17.2.2.2. Products
- 17.2.2.3. SWOT Analysis
- 17.2.2.4. Recent Developments
- 17.2.2.5. Financials (Based on Availability)
- 17.2.3 Fulcrum BioEnergy Inc
- 17.2.3.1. Overview
- 17.2.3.2. Products
- 17.2.3.3. SWOT Analysis
- 17.2.3.4. Recent Developments
- 17.2.3.5. Financials (Based on Availability)
- 17.2.4 Neste Oyj
- 17.2.4.1. Overview
- 17.2.4.2. Products
- 17.2.4.3. SWOT Analysis
- 17.2.4.4. Recent Developments
- 17.2.4.5. Financials (Based on Availability)
- 17.2.5 Red Rock Biofuels LLC
- 17.2.5.1. Overview
- 17.2.5.2. Products
- 17.2.5.3. SWOT Analysis
- 17.2.5.4. Recent Developments
- 17.2.5.5. Financials (Based on Availability)
- 17.2.6 Swedish Biofuels AB
- 17.2.6.1. Overview
- 17.2.6.2. Products
- 17.2.6.3. SWOT Analysis
- 17.2.6.4. Recent Developments
- 17.2.6.5. Financials (Based on Availability)
- 17.2.7 SG Preston Company
- 17.2.7.1. Overview
- 17.2.7.2. Products
- 17.2.7.3. SWOT Analysis
- 17.2.7.4. Recent Developments
- 17.2.7.5. Financials (Based on Availability)
- 17.2.8 TotalEnergies SE
- 17.2.8.1. Overview
- 17.2.8.2. Products
- 17.2.8.3. SWOT Analysis
- 17.2.8.4. Recent Developments
- 17.2.8.5. Financials (Based on Availability)
- 17.2.9 Gevo Inc
- 17.2.9.1. Overview
- 17.2.9.2. Products
- 17.2.9.3. SWOT Analysis
- 17.2.9.4. Recent Developments
- 17.2.9.5. Financials (Based on Availability)
- 17.2.1 Honeywell International Inc
List of Figures
- Figure 1: Global Sustainable Aviation Fuel Market Revenue Breakdown (Million, %) by Region 2024 & 2032
- Figure 2: North America Sustainable Aviation Fuel Market Revenue (Million), by Country 2024 & 2032
- Figure 3: North America Sustainable Aviation Fuel Market Revenue Share (%), by Country 2024 & 2032
- Figure 4: Europe Sustainable Aviation Fuel Market Revenue (Million), by Country 2024 & 2032
- Figure 5: Europe Sustainable Aviation Fuel Market Revenue Share (%), by Country 2024 & 2032
- Figure 6: Asia Pacific Sustainable Aviation Fuel Market Revenue (Million), by Country 2024 & 2032
- Figure 7: Asia Pacific Sustainable Aviation Fuel Market Revenue Share (%), by Country 2024 & 2032
- Figure 8: South America Sustainable Aviation Fuel Market Revenue (Million), by Country 2024 & 2032
- Figure 9: South America Sustainable Aviation Fuel Market Revenue Share (%), by Country 2024 & 2032
- Figure 10: North America Sustainable Aviation Fuel Market Revenue (Million), by Country 2024 & 2032
- Figure 11: North America Sustainable Aviation Fuel Market Revenue Share (%), by Country 2024 & 2032
- Figure 12: MEA Sustainable Aviation Fuel Market Revenue (Million), by Country 2024 & 2032
- Figure 13: MEA Sustainable Aviation Fuel Market Revenue Share (%), by Country 2024 & 2032
- Figure 14: North America Sustainable Aviation Fuel Market Revenue (Million), by Technology 2024 & 2032
- Figure 15: North America Sustainable Aviation Fuel Market Revenue Share (%), by Technology 2024 & 2032
- Figure 16: North America Sustainable Aviation Fuel Market Revenue (Million), by Application 2024 & 2032
- Figure 17: North America Sustainable Aviation Fuel Market Revenue Share (%), by Application 2024 & 2032
- Figure 18: North America Sustainable Aviation Fuel Market Revenue (Million), by Country 2024 & 2032
- Figure 19: North America Sustainable Aviation Fuel Market Revenue Share (%), by Country 2024 & 2032
- Figure 20: Asia Pacific Sustainable Aviation Fuel Market Revenue (Million), by Technology 2024 & 2032
- Figure 21: Asia Pacific Sustainable Aviation Fuel Market Revenue Share (%), by Technology 2024 & 2032
- Figure 22: Asia Pacific Sustainable Aviation Fuel Market Revenue (Million), by Application 2024 & 2032
- Figure 23: Asia Pacific Sustainable Aviation Fuel Market Revenue Share (%), by Application 2024 & 2032
- Figure 24: Asia Pacific Sustainable Aviation Fuel Market Revenue (Million), by Country 2024 & 2032
- Figure 25: Asia Pacific Sustainable Aviation Fuel Market Revenue Share (%), by Country 2024 & 2032
- Figure 26: Europe Sustainable Aviation Fuel Market Revenue (Million), by Technology 2024 & 2032
- Figure 27: Europe Sustainable Aviation Fuel Market Revenue Share (%), by Technology 2024 & 2032
- Figure 28: Europe Sustainable Aviation Fuel Market Revenue (Million), by Application 2024 & 2032
- Figure 29: Europe Sustainable Aviation Fuel Market Revenue Share (%), by Application 2024 & 2032
- Figure 30: Europe Sustainable Aviation Fuel Market Revenue (Million), by Country 2024 & 2032
- Figure 31: Europe Sustainable Aviation Fuel Market Revenue Share (%), by Country 2024 & 2032
- Figure 32: South America Sustainable Aviation Fuel Market Revenue (Million), by Technology 2024 & 2032
- Figure 33: South America Sustainable Aviation Fuel Market Revenue Share (%), by Technology 2024 & 2032
- Figure 34: South America Sustainable Aviation Fuel Market Revenue (Million), by Application 2024 & 2032
- Figure 35: South America Sustainable Aviation Fuel Market Revenue Share (%), by Application 2024 & 2032
- Figure 36: South America Sustainable Aviation Fuel Market Revenue (Million), by Country 2024 & 2032
- Figure 37: South America Sustainable Aviation Fuel Market Revenue Share (%), by Country 2024 & 2032
- Figure 38: Middle East and Africa Sustainable Aviation Fuel Market Revenue (Million), by Technology 2024 & 2032
- Figure 39: Middle East and Africa Sustainable Aviation Fuel Market Revenue Share (%), by Technology 2024 & 2032
- Figure 40: Middle East and Africa Sustainable Aviation Fuel Market Revenue (Million), by Application 2024 & 2032
- Figure 41: Middle East and Africa Sustainable Aviation Fuel Market Revenue Share (%), by Application 2024 & 2032
- Figure 42: Middle East and Africa Sustainable Aviation Fuel Market Revenue (Million), by Country 2024 & 2032
- Figure 43: Middle East and Africa Sustainable Aviation Fuel Market Revenue Share (%), by Country 2024 & 2032
List of Tables
- Table 1: Global Sustainable Aviation Fuel Market Revenue Million Forecast, by Region 2019 & 2032
- Table 2: Global Sustainable Aviation Fuel Market Revenue Million Forecast, by Technology 2019 & 2032
- Table 3: Global Sustainable Aviation Fuel Market Revenue Million Forecast, by Application 2019 & 2032
- Table 4: Global Sustainable Aviation Fuel Market Revenue Million Forecast, by Region 2019 & 2032
- Table 5: Global Sustainable Aviation Fuel Market Revenue Million Forecast, by Country 2019 & 2032
- Table 6: United States Sustainable Aviation Fuel Market Revenue (Million) Forecast, by Application 2019 & 2032
- Table 7: Canada Sustainable Aviation Fuel Market Revenue (Million) Forecast, by Application 2019 & 2032
- Table 8: Mexico Sustainable Aviation Fuel Market Revenue (Million) Forecast, by Application 2019 & 2032
- Table 9: Global Sustainable Aviation Fuel Market Revenue Million Forecast, by Country 2019 & 2032
- Table 10: Germany Sustainable Aviation Fuel Market Revenue (Million) Forecast, by Application 2019 & 2032
- Table 11: United Kingdom Sustainable Aviation Fuel Market Revenue (Million) Forecast, by Application 2019 & 2032
- Table 12: France Sustainable Aviation Fuel Market Revenue (Million) Forecast, by Application 2019 & 2032
- Table 13: Spain Sustainable Aviation Fuel Market Revenue (Million) Forecast, by Application 2019 & 2032
- Table 14: Italy Sustainable Aviation Fuel Market Revenue (Million) Forecast, by Application 2019 & 2032
- Table 15: Spain Sustainable Aviation Fuel Market Revenue (Million) Forecast, by Application 2019 & 2032
- Table 16: Belgium Sustainable Aviation Fuel Market Revenue (Million) Forecast, by Application 2019 & 2032
- Table 17: Netherland Sustainable Aviation Fuel Market Revenue (Million) Forecast, by Application 2019 & 2032
- Table 18: Nordics Sustainable Aviation Fuel Market Revenue (Million) Forecast, by Application 2019 & 2032
- Table 19: Rest of Europe Sustainable Aviation Fuel Market Revenue (Million) Forecast, by Application 2019 & 2032
- Table 20: Global Sustainable Aviation Fuel Market Revenue Million Forecast, by Country 2019 & 2032
- Table 21: China Sustainable Aviation Fuel Market Revenue (Million) Forecast, by Application 2019 & 2032
- Table 22: Japan Sustainable Aviation Fuel Market Revenue (Million) Forecast, by Application 2019 & 2032
- Table 23: India Sustainable Aviation Fuel Market Revenue (Million) Forecast, by Application 2019 & 2032
- Table 24: South Korea Sustainable Aviation Fuel Market Revenue (Million) Forecast, by Application 2019 & 2032
- Table 25: Southeast Asia Sustainable Aviation Fuel Market Revenue (Million) Forecast, by Application 2019 & 2032
- Table 26: Australia Sustainable Aviation Fuel Market Revenue (Million) Forecast, by Application 2019 & 2032
- Table 27: Indonesia Sustainable Aviation Fuel Market Revenue (Million) Forecast, by Application 2019 & 2032
- Table 28: Phillipes Sustainable Aviation Fuel Market Revenue (Million) Forecast, by Application 2019 & 2032
- Table 29: Singapore Sustainable Aviation Fuel Market Revenue (Million) Forecast, by Application 2019 & 2032
- Table 30: Thailandc Sustainable Aviation Fuel Market Revenue (Million) Forecast, by Application 2019 & 2032
- Table 31: Rest of Asia Pacific Sustainable Aviation Fuel Market Revenue (Million) Forecast, by Application 2019 & 2032
- Table 32: Global Sustainable Aviation Fuel Market Revenue Million Forecast, by Country 2019 & 2032
- Table 33: Brazil Sustainable Aviation Fuel Market Revenue (Million) Forecast, by Application 2019 & 2032
- Table 34: Argentina Sustainable Aviation Fuel Market Revenue (Million) Forecast, by Application 2019 & 2032
- Table 35: Peru Sustainable Aviation Fuel Market Revenue (Million) Forecast, by Application 2019 & 2032
- Table 36: Chile Sustainable Aviation Fuel Market Revenue (Million) Forecast, by Application 2019 & 2032
- Table 37: Colombia Sustainable Aviation Fuel Market Revenue (Million) Forecast, by Application 2019 & 2032
- Table 38: Ecuador Sustainable Aviation Fuel Market Revenue (Million) Forecast, by Application 2019 & 2032
- Table 39: Venezuela Sustainable Aviation Fuel Market Revenue (Million) Forecast, by Application 2019 & 2032
- Table 40: Rest of South America Sustainable Aviation Fuel Market Revenue (Million) Forecast, by Application 2019 & 2032
- Table 41: Global Sustainable Aviation Fuel Market Revenue Million Forecast, by Country 2019 & 2032
- Table 42: United States Sustainable Aviation Fuel Market Revenue (Million) Forecast, by Application 2019 & 2032
- Table 43: Canada Sustainable Aviation Fuel Market Revenue (Million) Forecast, by Application 2019 & 2032
- Table 44: Mexico Sustainable Aviation Fuel Market Revenue (Million) Forecast, by Application 2019 & 2032
- Table 45: Global Sustainable Aviation Fuel Market Revenue Million Forecast, by Country 2019 & 2032
- Table 46: United Arab Emirates Sustainable Aviation Fuel Market Revenue (Million) Forecast, by Application 2019 & 2032
- Table 47: Saudi Arabia Sustainable Aviation Fuel Market Revenue (Million) Forecast, by Application 2019 & 2032
- Table 48: South Africa Sustainable Aviation Fuel Market Revenue (Million) Forecast, by Application 2019 & 2032
- Table 49: Rest of Middle East and Africa Sustainable Aviation Fuel Market Revenue (Million) Forecast, by Application 2019 & 2032
- Table 50: Global Sustainable Aviation Fuel Market Revenue Million Forecast, by Technology 2019 & 2032
- Table 51: Global Sustainable Aviation Fuel Market Revenue Million Forecast, by Application 2019 & 2032
- Table 52: Global Sustainable Aviation Fuel Market Revenue Million Forecast, by Country 2019 & 2032
- Table 53: United States of America Sustainable Aviation Fuel Market Revenue (Million) Forecast, by Application 2019 & 2032
- Table 54: Canada Sustainable Aviation Fuel Market Revenue (Million) Forecast, by Application 2019 & 2032
- Table 55: Rest of the North America Sustainable Aviation Fuel Market Revenue (Million) Forecast, by Application 2019 & 2032
- Table 56: Global Sustainable Aviation Fuel Market Revenue Million Forecast, by Technology 2019 & 2032
- Table 57: Global Sustainable Aviation Fuel Market Revenue Million Forecast, by Application 2019 & 2032
- Table 58: Global Sustainable Aviation Fuel Market Revenue Million Forecast, by Country 2019 & 2032
- Table 59: China Sustainable Aviation Fuel Market Revenue (Million) Forecast, by Application 2019 & 2032
- Table 60: India Sustainable Aviation Fuel Market Revenue (Million) Forecast, by Application 2019 & 2032
- Table 61: Japan Sustainable Aviation Fuel Market Revenue (Million) Forecast, by Application 2019 & 2032
- Table 62: Rest of the Asia Pacific Sustainable Aviation Fuel Market Revenue (Million) Forecast, by Application 2019 & 2032
- Table 63: Global Sustainable Aviation Fuel Market Revenue Million Forecast, by Technology 2019 & 2032
- Table 64: Global Sustainable Aviation Fuel Market Revenue Million Forecast, by Application 2019 & 2032
- Table 65: Global Sustainable Aviation Fuel Market Revenue Million Forecast, by Country 2019 & 2032
- Table 66: United Kingdom Sustainable Aviation Fuel Market Revenue (Million) Forecast, by Application 2019 & 2032
- Table 67: France Sustainable Aviation Fuel Market Revenue (Million) Forecast, by Application 2019 & 2032
- Table 68: Germany Sustainable Aviation Fuel Market Revenue (Million) Forecast, by Application 2019 & 2032
- Table 69: Rest of the Europe Sustainable Aviation Fuel Market Revenue (Million) Forecast, by Application 2019 & 2032
- Table 70: Global Sustainable Aviation Fuel Market Revenue Million Forecast, by Technology 2019 & 2032
- Table 71: Global Sustainable Aviation Fuel Market Revenue Million Forecast, by Application 2019 & 2032
- Table 72: Global Sustainable Aviation Fuel Market Revenue Million Forecast, by Country 2019 & 2032
- Table 73: Brazil Sustainable Aviation Fuel Market Revenue (Million) Forecast, by Application 2019 & 2032
- Table 74: Argentina Sustainable Aviation Fuel Market Revenue (Million) Forecast, by Application 2019 & 2032
- Table 75: Rest of the South America Sustainable Aviation Fuel Market Revenue (Million) Forecast, by Application 2019 & 2032
- Table 76: Global Sustainable Aviation Fuel Market Revenue Million Forecast, by Technology 2019 & 2032
- Table 77: Global Sustainable Aviation Fuel Market Revenue Million Forecast, by Application 2019 & 2032
- Table 78: Global Sustainable Aviation Fuel Market Revenue Million Forecast, by Country 2019 & 2032
- Table 79: United Arab Emirates Sustainable Aviation Fuel Market Revenue (Million) Forecast, by Application 2019 & 2032
- Table 80: Saudi Arabia Sustainable Aviation Fuel Market Revenue (Million) Forecast, by Application 2019 & 2032
- Table 81: Qatar Sustainable Aviation Fuel Market Revenue (Million) Forecast, by Application 2019 & 2032
- Table 82: Rest of the Middle East and Africa Sustainable Aviation Fuel Market Revenue (Million) Forecast, by Application 2019 & 2032
Frequently Asked Questions
1. What is the projected Compound Annual Growth Rate (CAGR) of the Sustainable Aviation Fuel Market?
The projected CAGR is approximately 47.16%.
2. Which companies are prominent players in the Sustainable Aviation Fuel Market?
Key companies in the market include Honeywell International Inc, LanzaTech Inc *List Not Exhaustive, Fulcrum BioEnergy Inc, Neste Oyj, Red Rock Biofuels LLC, Swedish Biofuels AB, SG Preston Company, TotalEnergies SE, Gevo Inc.
3. What are the main segments of the Sustainable Aviation Fuel Market?
The market segments include Technology, Application.
4. Can you provide details about the market size?
The market size is estimated to be USD 6.58 Million as of 2022.
5. What are some drivers contributing to market growth?
4.; Increased Government Regulations for Greenhouse Gas Emissions 4.; Encouraging Production and Consumption of Renewable Aviation Fuel.
6. What are the notable trends driving market growth?
Hydroprocessed Esters and Fatty Acids (HEFA) Technology to Dominate the Market.
7. Are there any restraints impacting market growth?
4.; The High Costs of Renewable Aviation Fuel.
8. Can you provide examples of recent developments in the market?
In May 2023, Twelve and Etihad Airways, the national carrier of the United Arab Emirates, signed a Memorandum of Understanding (MOU) to collaborate on the advancement of E-Jet® fuel, Twelve's sustainable aviation fuel (SAF) made from CO2 and renewable energy, as well as plans for an international demonstration flight and a supply roadmap that will support Etihad's sustainability strategy.
9. What pricing options are available for accessing the report?
Pricing options include single-user, multi-user, and enterprise licenses priced at USD 4750, USD 5250, and USD 8750 respectively.
10. Is the market size provided in terms of value or volume?
The market size is provided in terms of value, measured in Million.
11. Are there any specific market keywords associated with the report?
Yes, the market keyword associated with the report is "Sustainable Aviation Fuel Market," which aids in identifying and referencing the specific market segment covered.
12. How do I determine which pricing option suits my needs best?
The pricing options vary based on user requirements and access needs. Individual users may opt for single-user licenses, while businesses requiring broader access may choose multi-user or enterprise licenses for cost-effective access to the report.
13. Are there any additional resources or data provided in the Sustainable Aviation Fuel Market report?
While the report offers comprehensive insights, it's advisable to review the specific contents or supplementary materials provided to ascertain if additional resources or data are available.
14. How can I stay updated on further developments or reports in the Sustainable Aviation Fuel Market?
To stay informed about further developments, trends, and reports in the Sustainable Aviation Fuel Market, consider subscribing to industry newsletters, following relevant companies and organizations, or regularly checking reputable industry news sources and publications.
Methodology
Step 1 - Identification of Relevant Samples Size from Population Database


Step 2 - Approaches for Defining Global Market Size (Value, Volume* & Price*)

Note*: In applicable scenarios
Step 3 - Data Sources
Primary Research
- Web Analytics
- Survey Reports
- Research Institute
- Latest Research Reports
- Opinion Leaders
Secondary Research
- Annual Reports
- White Paper
- Latest Press Release
- Industry Association
- Paid Database
- Investor Presentations

Step 4 - Data Triangulation
Involves using different sources of information in order to increase the validity of a study
These sources are likely to be stakeholders in a program - participants, other researchers, program staff, other community members, and so on.
Then we put all data in single framework & apply various statistical tools to find out the dynamic on the market.
During the analysis stage, feedback from the stakeholder groups would be compared to determine areas of agreement as well as areas of divergence


