
Key Insights
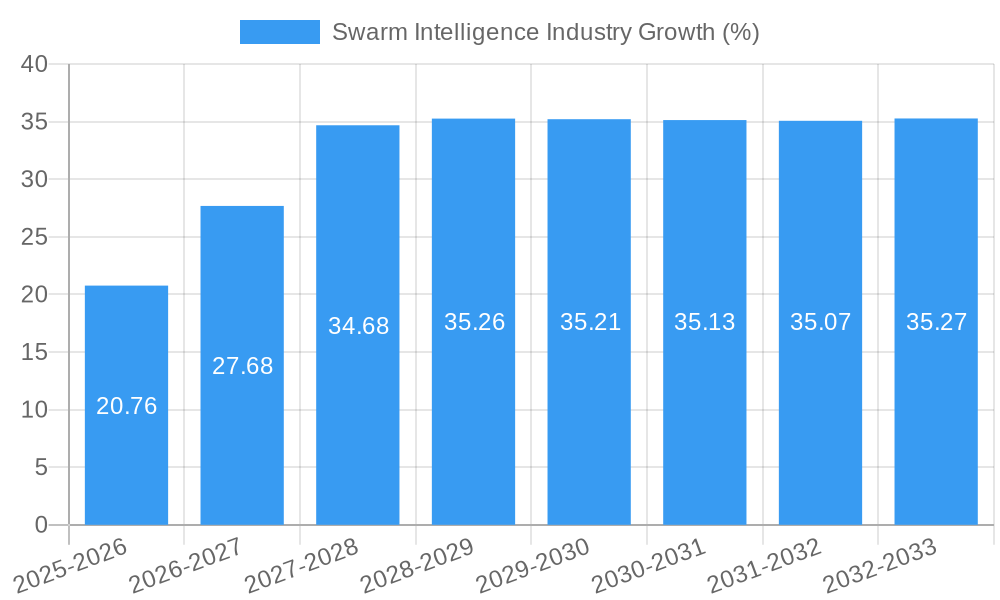
The Swarm Intelligence (SI) market is experiencing explosive growth, projected to reach \$58.5 million in 2025 and exhibiting a remarkable Compound Annual Growth Rate (CAGR) of 35.90%. This burgeoning sector is driven by the increasing adoption of SI algorithms across diverse industries. The automation of complex tasks in transportation and logistics, for example, is a significant driver, leveraging the efficiency and adaptability of SI-powered solutions to optimize route planning, delivery schedules, and resource allocation. Robotics and automation are another key beneficiary, with SI enabling sophisticated collaborative robots and autonomous systems capable of navigating dynamic environments and performing intricate tasks. Furthermore, the healthcare sector is adopting SI for applications such as drug discovery, personalized medicine, and improved diagnostic accuracy. The expanding e-commerce landscape fuels demand within retail, as SI algorithms enhance recommendation systems, personalize customer experiences, and optimize supply chain management. While the market faces challenges such as the complexity of implementing and integrating SI solutions, and the potential for high initial investment costs, the significant advantages offered by SI in terms of optimization, adaptability, and scalability are overcoming these hurdles. The various types of SI algorithms, including Ant Colony Optimization, Particle Swarm Optimization, and Swarm-based Networks, all contribute to the market's breadth and versatility. Geographical distribution likely reflects the concentration of technological advancements and early adoption, with North America and Europe potentially leading initially, followed by rapid expansion in the Asia-Pacific region.
The forecast period (2025-2033) promises continued expansion, fueled by technological advancements, falling implementation costs, and the growing awareness of SI's potential across various sectors. New applications will likely emerge, further diversifying the market and driving adoption. Companies like Hydromea, Brainalyzed Insight, and Sentien Robotics are at the forefront of innovation, contributing to the development of advanced SI solutions. However, competition is expected to intensify as more players enter the market, leading to price pressure and increased focus on differentiation through specialized applications and superior performance. The long-term outlook for the SI market remains exceptionally positive, driven by continuous technological advancements and an expanding range of applications across various industries. The potential for disruption and innovation within the SI field suggests this market will continue its upward trajectory for the foreseeable future.
This comprehensive report provides an in-depth analysis of the Swarm Intelligence industry, encompassing market size, segmentation, growth drivers, challenges, key players, and future outlook. The study period covers 2019-2033, with 2025 as the base and estimated year. The forecast period spans 2025-2033, and the historical period covers 2019-2024. The report projects a market value exceeding $xx Million by 2033, presenting lucrative opportunities for stakeholders.

Swarm Intelligence Industry Market Concentration & Innovation
The Swarm Intelligence market exhibits a moderately concentrated landscape, with a few key players holding significant market share. However, the presence of numerous smaller, innovative companies suggests a dynamic competitive environment. Market share data for 2024 reveals that the top 5 players account for approximately 40% of the total market, with the remaining share distributed among numerous smaller firms. Innovation is driven by advancements in AI, machine learning, and sensor technologies. Regulatory frameworks vary by region, impacting market growth. Product substitutes are limited, with Swarm Intelligence offering unique advantages in optimization and control. End-user trends indicate increasing adoption across various sectors, fueling market growth. M&A activity has been moderate, with deal values averaging $xx Million in recent years. Key M&A activities include [Insert Specific Examples if Available, otherwise replace with "Strategic acquisitions focused primarily on expanding technological capabilities and market reach."].
- Market Concentration: Top 5 players hold approximately 40% market share (2024).
- Innovation Drivers: AI, Machine Learning, Sensor Technologies.
- Regulatory Frameworks: Vary significantly by region.
- M&A Activity: Average deal value: $xx Million (2019-2024).
Swarm Intelligence Industry Industry Trends & Insights
The Swarm Intelligence market is experiencing robust growth, driven by increasing demand for efficient optimization solutions across various industries. The Compound Annual Growth Rate (CAGR) is estimated at xx% during the forecast period (2025-2033). Technological disruptions, such as advancements in distributed ledger technologies (DLT) and quantum computing, are poised to further accelerate market expansion. Consumer preferences shift towards AI-powered solutions, demanding higher levels of automation and efficiency. Competitive dynamics are shaped by innovation, strategic partnerships, and M&A activities. Market penetration is growing rapidly in sectors like logistics and robotics, exceeding xx% in 2024. Challenges include data privacy concerns, the need for robust cybersecurity measures, and the potential for algorithmic bias. However, these challenges also present opportunities for innovation and market differentiation.
Dominant Markets & Segments in Swarm Intelligence Industry
The North American region dominates the Swarm Intelligence market, driven by substantial investments in R&D and a strong focus on technological advancements. Within segments:
- By Type: Particle Swarm Optimization holds the largest market share, owing to its wide applicability in various optimization problems. Ant Colony Optimization is a rapidly growing segment, fueled by its suitability for complex routing and scheduling tasks. Swarm-based networks are gaining traction in decentralized systems applications. Other types comprise niche solutions catering to specialized needs.
- By End-user Industry: Robotics and Automation is the largest segment, followed closely by Transportation and Logistics. The Healthcare sector demonstrates promising growth, driven by applications in drug discovery and personalized medicine. Retail (Digital Ecommerce) is also experiencing increasing adoption, especially in inventory management and supply chain optimization.
Key Drivers:
- North America: Strong R&D investment, focus on technological advancement.
- Robotics & Automation: High demand for efficient automation solutions.
- Transportation & Logistics: Need for optimized routing and delivery systems.
Swarm Intelligence Industry Product Developments
Recent product innovations focus on enhancing algorithm efficiency, scalability, and integration with other technologies. New applications are emerging in areas such as autonomous vehicle control, environmental monitoring, and precision agriculture. Competitive advantages stem from improved algorithm performance, user-friendly interfaces, and robust cybersecurity features. A notable trend is the integration of Swarm Intelligence with edge computing, enabling real-time decision-making in decentralized environments.
Report Scope & Segmentation Analysis
This report comprehensively analyzes the Swarm Intelligence market across various segments.
- By Type: Ant Colony Optimization, Particle Swarm Optimization, Swarm-based Network, Other Types. Growth projections vary across segments, with Particle Swarm Optimization exhibiting the highest CAGR.
- By End-user Industry: Transportation and Logistics, Robotics and Automation, Healthcare, Retail (Digital Ecommerce), Other End-user Industries. Market size and competitive dynamics differ across these segments, reflecting varied adoption rates and technological requirements.
Key Drivers of Swarm Intelligence Growth
Technological advancements in AI, machine learning, and sensor technologies are key drivers of market growth. Economic factors such as increased automation needs and the demand for optimized resource allocation are also contributing factors. Supportive regulatory frameworks in certain regions further accelerate market adoption. For example, government initiatives promoting autonomous vehicles are stimulating the development of Swarm Intelligence solutions for traffic management.
Challenges in the Swarm Intelligence Industry Sector
Challenges include the high initial investment costs associated with implementing Swarm Intelligence solutions. Concerns around data security and privacy also represent potential barriers to adoption. Competition among solution providers is intensifying, requiring companies to continuously innovate and differentiate their offerings. Supply chain disruptions related to essential components like sensors and processing units can impact deployment.
Emerging Opportunities in Swarm Intelligence Industry
Emerging opportunities exist in sectors such as smart grids, environmental monitoring, and precision agriculture. The integration of Swarm Intelligence with other technologies, such as blockchain and IoT, will unlock new applications and business models. The increasing availability of large datasets and the development of more sophisticated algorithms are also expected to drive innovation and expansion into new market segments.
Leading Players in the Swarm Intelligence Industry Market
- Hydromea
- Brainalyzed Insight
- Sentien Robotics LLC
- Power-Blox AG
- Swarm Systems Limited
- Unanimous AI
- Swarm Technology
- Valutico UK Ltd
- Kim Technologies
- ConvergentAI Inc
Key Developments in Swarm Intelligence Industry
- October 2023: Shield AI launches V-Bat Teams drone swarming capability for defense applications. This significantly impacts the defense sector, driving demand for advanced swarm technologies.
- July 2023: NASA's Starling mission initiates testing of critical swarm technologies in space, demonstrating potential for autonomous space operations and stimulating commercial space growth. This has a long-term impact on the space exploration industry.
Strategic Outlook for Swarm Intelligence Market
The Swarm Intelligence market is poised for significant growth, driven by technological advancements and increasing adoption across diverse sectors. Opportunities lie in developing specialized solutions for niche applications and expanding into emerging markets. Strategic partnerships and collaborations will be crucial for achieving market leadership. Continued focus on algorithm improvement, user experience, and data security will be essential for sustained growth.
Swarm Intelligence Industry Segmentation
-
1. Type
- 1.1. Ant Colony Optimisation
- 1.2. Particle Swarm Optimisation
- 1.3. Swarm-based Network
- 1.4. Other Types
-
2. End-user Industry
- 2.1. Transportation and Logistics
- 2.2. Robotics and Automation
- 2.3. Healthcare
- 2.4. Retail (Digital Ecommerce)
- 2.5. Other End-user Industries
Swarm Intelligence Industry Segmentation By Geography
- 1. North America
- 2. Europe
- 3. Asia
- 4. Australia and New Zealand

Swarm Intelligence Industry REPORT HIGHLIGHTS
| Aspects | Details |
|---|---|
| Study Period | 2019-2033 |
| Base Year | 2024 |
| Estimated Year | 2025 |
| Forecast Period | 2025-2033 |
| Historical Period | 2019-2024 |
| Growth Rate | CAGR of 35.90% from 2019-2033 |
| Segmentation |
|
Table of Contents
- 1. Introduction
- 1.1. Research Scope
- 1.2. Market Segmentation
- 1.3. Research Methodology
- 1.4. Definitions and Assumptions
- 2. Executive Summary
- 2.1. Introduction
- 3. Market Dynamics
- 3.1. Introduction
- 3.2. Market Drivers
- 3.2.1. Growing Demand for the Swarm Robotics is Expected to Drive Across the Logistic Sector; Rising Application of Real-time Artificial Intelligence Algorithm in Patent Recognition
- 3.3. Market Restrains
- 3.3.1. Lack of Required Skills Among Professionals
- 3.4. Market Trends
- 3.4.1. Transportation and Logistics Sector is Gaining Traction Due to the Emergence of an Optimization Algorithm
- 4. Market Factor Analysis
- 4.1. Porters Five Forces
- 4.2. Supply/Value Chain
- 4.3. PESTEL analysis
- 4.4. Market Entropy
- 4.5. Patent/Trademark Analysis
- 5. Global Swarm Intelligence Industry Analysis, Insights and Forecast, 2019-2031
- 5.1. Market Analysis, Insights and Forecast - by Type
- 5.1.1. Ant Colony Optimisation
- 5.1.2. Particle Swarm Optimisation
- 5.1.3. Swarm-based Network
- 5.1.4. Other Types
- 5.2. Market Analysis, Insights and Forecast - by End-user Industry
- 5.2.1. Transportation and Logistics
- 5.2.2. Robotics and Automation
- 5.2.3. Healthcare
- 5.2.4. Retail (Digital Ecommerce)
- 5.2.5. Other End-user Industries
- 5.3. Market Analysis, Insights and Forecast - by Region
- 5.3.1. North America
- 5.3.2. Europe
- 5.3.3. Asia
- 5.3.4. Australia and New Zealand
- 5.1. Market Analysis, Insights and Forecast - by Type
- 6. North America Swarm Intelligence Industry Analysis, Insights and Forecast, 2019-2031
- 6.1. Market Analysis, Insights and Forecast - by Type
- 6.1.1. Ant Colony Optimisation
- 6.1.2. Particle Swarm Optimisation
- 6.1.3. Swarm-based Network
- 6.1.4. Other Types
- 6.2. Market Analysis, Insights and Forecast - by End-user Industry
- 6.2.1. Transportation and Logistics
- 6.2.2. Robotics and Automation
- 6.2.3. Healthcare
- 6.2.4. Retail (Digital Ecommerce)
- 6.2.5. Other End-user Industries
- 6.1. Market Analysis, Insights and Forecast - by Type
- 7. Europe Swarm Intelligence Industry Analysis, Insights and Forecast, 2019-2031
- 7.1. Market Analysis, Insights and Forecast - by Type
- 7.1.1. Ant Colony Optimisation
- 7.1.2. Particle Swarm Optimisation
- 7.1.3. Swarm-based Network
- 7.1.4. Other Types
- 7.2. Market Analysis, Insights and Forecast - by End-user Industry
- 7.2.1. Transportation and Logistics
- 7.2.2. Robotics and Automation
- 7.2.3. Healthcare
- 7.2.4. Retail (Digital Ecommerce)
- 7.2.5. Other End-user Industries
- 7.1. Market Analysis, Insights and Forecast - by Type
- 8. Asia Swarm Intelligence Industry Analysis, Insights and Forecast, 2019-2031
- 8.1. Market Analysis, Insights and Forecast - by Type
- 8.1.1. Ant Colony Optimisation
- 8.1.2. Particle Swarm Optimisation
- 8.1.3. Swarm-based Network
- 8.1.4. Other Types
- 8.2. Market Analysis, Insights and Forecast - by End-user Industry
- 8.2.1. Transportation and Logistics
- 8.2.2. Robotics and Automation
- 8.2.3. Healthcare
- 8.2.4. Retail (Digital Ecommerce)
- 8.2.5. Other End-user Industries
- 8.1. Market Analysis, Insights and Forecast - by Type
- 9. Australia and New Zealand Swarm Intelligence Industry Analysis, Insights and Forecast, 2019-2031
- 9.1. Market Analysis, Insights and Forecast - by Type
- 9.1.1. Ant Colony Optimisation
- 9.1.2. Particle Swarm Optimisation
- 9.1.3. Swarm-based Network
- 9.1.4. Other Types
- 9.2. Market Analysis, Insights and Forecast - by End-user Industry
- 9.2.1. Transportation and Logistics
- 9.2.2. Robotics and Automation
- 9.2.3. Healthcare
- 9.2.4. Retail (Digital Ecommerce)
- 9.2.5. Other End-user Industries
- 9.1. Market Analysis, Insights and Forecast - by Type
- 10. North America Swarm Intelligence Industry Analysis, Insights and Forecast, 2019-2031
- 10.1. Market Analysis, Insights and Forecast - By Country/Sub-region
- 10.1.1.
- 11. Europe Swarm Intelligence Industry Analysis, Insights and Forecast, 2019-2031
- 11.1. Market Analysis, Insights and Forecast - By Country/Sub-region
- 11.1.1.
- 12. Asia Pacific Swarm Intelligence Industry Analysis, Insights and Forecast, 2019-2031
- 12.1. Market Analysis, Insights and Forecast - By Country/Sub-region
- 12.1.1.
- 13. Rest of the World Swarm Intelligence Industry Analysis, Insights and Forecast, 2019-2031
- 13.1. Market Analysis, Insights and Forecast - By Country/Sub-region
- 13.1.1.
- 14. Competitive Analysis
- 14.1. Global Market Share Analysis 2024
- 14.2. Company Profiles
- 14.2.1 Hydromea*List Not Exhaustive
- 14.2.1.1. Overview
- 14.2.1.2. Products
- 14.2.1.3. SWOT Analysis
- 14.2.1.4. Recent Developments
- 14.2.1.5. Financials (Based on Availability)
- 14.2.2 Brainalyzed Insight
- 14.2.2.1. Overview
- 14.2.2.2. Products
- 14.2.2.3. SWOT Analysis
- 14.2.2.4. Recent Developments
- 14.2.2.5. Financials (Based on Availability)
- 14.2.3 Sentien Robotics LLC
- 14.2.3.1. Overview
- 14.2.3.2. Products
- 14.2.3.3. SWOT Analysis
- 14.2.3.4. Recent Developments
- 14.2.3.5. Financials (Based on Availability)
- 14.2.4 Power-Blox AG
- 14.2.4.1. Overview
- 14.2.4.2. Products
- 14.2.4.3. SWOT Analysis
- 14.2.4.4. Recent Developments
- 14.2.4.5. Financials (Based on Availability)
- 14.2.5 Swarm Systems Limited
- 14.2.5.1. Overview
- 14.2.5.2. Products
- 14.2.5.3. SWOT Analysis
- 14.2.5.4. Recent Developments
- 14.2.5.5. Financials (Based on Availability)
- 14.2.6 Unanimous AI
- 14.2.6.1. Overview
- 14.2.6.2. Products
- 14.2.6.3. SWOT Analysis
- 14.2.6.4. Recent Developments
- 14.2.6.5. Financials (Based on Availability)
- 14.2.7 Swarm Technology
- 14.2.7.1. Overview
- 14.2.7.2. Products
- 14.2.7.3. SWOT Analysis
- 14.2.7.4. Recent Developments
- 14.2.7.5. Financials (Based on Availability)
- 14.2.8 Valutico UK Ltd
- 14.2.8.1. Overview
- 14.2.8.2. Products
- 14.2.8.3. SWOT Analysis
- 14.2.8.4. Recent Developments
- 14.2.8.5. Financials (Based on Availability)
- 14.2.9 Kim Technologies
- 14.2.9.1. Overview
- 14.2.9.2. Products
- 14.2.9.3. SWOT Analysis
- 14.2.9.4. Recent Developments
- 14.2.9.5. Financials (Based on Availability)
- 14.2.10 ConvergentAI Inc
- 14.2.10.1. Overview
- 14.2.10.2. Products
- 14.2.10.3. SWOT Analysis
- 14.2.10.4. Recent Developments
- 14.2.10.5. Financials (Based on Availability)
- 14.2.1 Hydromea*List Not Exhaustive
List of Figures
- Figure 1: Global Swarm Intelligence Industry Revenue Breakdown (Million, %) by Region 2024 & 2032
- Figure 2: North America Swarm Intelligence Industry Revenue (Million), by Country 2024 & 2032
- Figure 3: North America Swarm Intelligence Industry Revenue Share (%), by Country 2024 & 2032
- Figure 4: Europe Swarm Intelligence Industry Revenue (Million), by Country 2024 & 2032
- Figure 5: Europe Swarm Intelligence Industry Revenue Share (%), by Country 2024 & 2032
- Figure 6: Asia Pacific Swarm Intelligence Industry Revenue (Million), by Country 2024 & 2032
- Figure 7: Asia Pacific Swarm Intelligence Industry Revenue Share (%), by Country 2024 & 2032
- Figure 8: Rest of the World Swarm Intelligence Industry Revenue (Million), by Country 2024 & 2032
- Figure 9: Rest of the World Swarm Intelligence Industry Revenue Share (%), by Country 2024 & 2032
- Figure 10: North America Swarm Intelligence Industry Revenue (Million), by Type 2024 & 2032
- Figure 11: North America Swarm Intelligence Industry Revenue Share (%), by Type 2024 & 2032
- Figure 12: North America Swarm Intelligence Industry Revenue (Million), by End-user Industry 2024 & 2032
- Figure 13: North America Swarm Intelligence Industry Revenue Share (%), by End-user Industry 2024 & 2032
- Figure 14: North America Swarm Intelligence Industry Revenue (Million), by Country 2024 & 2032
- Figure 15: North America Swarm Intelligence Industry Revenue Share (%), by Country 2024 & 2032
- Figure 16: Europe Swarm Intelligence Industry Revenue (Million), by Type 2024 & 2032
- Figure 17: Europe Swarm Intelligence Industry Revenue Share (%), by Type 2024 & 2032
- Figure 18: Europe Swarm Intelligence Industry Revenue (Million), by End-user Industry 2024 & 2032
- Figure 19: Europe Swarm Intelligence Industry Revenue Share (%), by End-user Industry 2024 & 2032
- Figure 20: Europe Swarm Intelligence Industry Revenue (Million), by Country 2024 & 2032
- Figure 21: Europe Swarm Intelligence Industry Revenue Share (%), by Country 2024 & 2032
- Figure 22: Asia Swarm Intelligence Industry Revenue (Million), by Type 2024 & 2032
- Figure 23: Asia Swarm Intelligence Industry Revenue Share (%), by Type 2024 & 2032
- Figure 24: Asia Swarm Intelligence Industry Revenue (Million), by End-user Industry 2024 & 2032
- Figure 25: Asia Swarm Intelligence Industry Revenue Share (%), by End-user Industry 2024 & 2032
- Figure 26: Asia Swarm Intelligence Industry Revenue (Million), by Country 2024 & 2032
- Figure 27: Asia Swarm Intelligence Industry Revenue Share (%), by Country 2024 & 2032
- Figure 28: Australia and New Zealand Swarm Intelligence Industry Revenue (Million), by Type 2024 & 2032
- Figure 29: Australia and New Zealand Swarm Intelligence Industry Revenue Share (%), by Type 2024 & 2032
- Figure 30: Australia and New Zealand Swarm Intelligence Industry Revenue (Million), by End-user Industry 2024 & 2032
- Figure 31: Australia and New Zealand Swarm Intelligence Industry Revenue Share (%), by End-user Industry 2024 & 2032
- Figure 32: Australia and New Zealand Swarm Intelligence Industry Revenue (Million), by Country 2024 & 2032
- Figure 33: Australia and New Zealand Swarm Intelligence Industry Revenue Share (%), by Country 2024 & 2032
List of Tables
- Table 1: Global Swarm Intelligence Industry Revenue Million Forecast, by Region 2019 & 2032
- Table 2: Global Swarm Intelligence Industry Revenue Million Forecast, by Type 2019 & 2032
- Table 3: Global Swarm Intelligence Industry Revenue Million Forecast, by End-user Industry 2019 & 2032
- Table 4: Global Swarm Intelligence Industry Revenue Million Forecast, by Region 2019 & 2032
- Table 5: Global Swarm Intelligence Industry Revenue Million Forecast, by Country 2019 & 2032
- Table 6: Swarm Intelligence Industry Revenue (Million) Forecast, by Application 2019 & 2032
- Table 7: Global Swarm Intelligence Industry Revenue Million Forecast, by Country 2019 & 2032
- Table 8: Swarm Intelligence Industry Revenue (Million) Forecast, by Application 2019 & 2032
- Table 9: Global Swarm Intelligence Industry Revenue Million Forecast, by Country 2019 & 2032
- Table 10: Swarm Intelligence Industry Revenue (Million) Forecast, by Application 2019 & 2032
- Table 11: Global Swarm Intelligence Industry Revenue Million Forecast, by Country 2019 & 2032
- Table 12: Swarm Intelligence Industry Revenue (Million) Forecast, by Application 2019 & 2032
- Table 13: Global Swarm Intelligence Industry Revenue Million Forecast, by Type 2019 & 2032
- Table 14: Global Swarm Intelligence Industry Revenue Million Forecast, by End-user Industry 2019 & 2032
- Table 15: Global Swarm Intelligence Industry Revenue Million Forecast, by Country 2019 & 2032
- Table 16: Global Swarm Intelligence Industry Revenue Million Forecast, by Type 2019 & 2032
- Table 17: Global Swarm Intelligence Industry Revenue Million Forecast, by End-user Industry 2019 & 2032
- Table 18: Global Swarm Intelligence Industry Revenue Million Forecast, by Country 2019 & 2032
- Table 19: Global Swarm Intelligence Industry Revenue Million Forecast, by Type 2019 & 2032
- Table 20: Global Swarm Intelligence Industry Revenue Million Forecast, by End-user Industry 2019 & 2032
- Table 21: Global Swarm Intelligence Industry Revenue Million Forecast, by Country 2019 & 2032
- Table 22: Global Swarm Intelligence Industry Revenue Million Forecast, by Type 2019 & 2032
- Table 23: Global Swarm Intelligence Industry Revenue Million Forecast, by End-user Industry 2019 & 2032
- Table 24: Global Swarm Intelligence Industry Revenue Million Forecast, by Country 2019 & 2032
Frequently Asked Questions
1. What is the projected Compound Annual Growth Rate (CAGR) of the Swarm Intelligence Industry?
The projected CAGR is approximately 35.90%.
2. Which companies are prominent players in the Swarm Intelligence Industry?
Key companies in the market include Hydromea*List Not Exhaustive, Brainalyzed Insight, Sentien Robotics LLC, Power-Blox AG, Swarm Systems Limited, Unanimous AI, Swarm Technology, Valutico UK Ltd, Kim Technologies, ConvergentAI Inc.
3. What are the main segments of the Swarm Intelligence Industry?
The market segments include Type, End-user Industry.
4. Can you provide details about the market size?
The market size is estimated to be USD 58.5 Million as of 2022.
5. What are some drivers contributing to market growth?
Growing Demand for the Swarm Robotics is Expected to Drive Across the Logistic Sector; Rising Application of Real-time Artificial Intelligence Algorithm in Patent Recognition.
6. What are the notable trends driving market growth?
Transportation and Logistics Sector is Gaining Traction Due to the Emergence of an Optimization Algorithm.
7. Are there any restraints impacting market growth?
Lack of Required Skills Among Professionals.
8. Can you provide examples of recent developments in the market?
October 2023: California-based defense technology firm Shield AI launched a new drone swarming capability called V-Bat Teams, which may be used by the Defense Department use for programs such as its Replicator initiative.
9. What pricing options are available for accessing the report?
Pricing options include single-user, multi-user, and enterprise licenses priced at USD 4750, USD 5250, and USD 8750 respectively.
10. Is the market size provided in terms of value or volume?
The market size is provided in terms of value, measured in Million.
11. Are there any specific market keywords associated with the report?
Yes, the market keyword associated with the report is "Swarm Intelligence Industry," which aids in identifying and referencing the specific market segment covered.
12. How do I determine which pricing option suits my needs best?
The pricing options vary based on user requirements and access needs. Individual users may opt for single-user licenses, while businesses requiring broader access may choose multi-user or enterprise licenses for cost-effective access to the report.
13. Are there any additional resources or data provided in the Swarm Intelligence Industry report?
While the report offers comprehensive insights, it's advisable to review the specific contents or supplementary materials provided to ascertain if additional resources or data are available.
14. How can I stay updated on further developments or reports in the Swarm Intelligence Industry?
To stay informed about further developments, trends, and reports in the Swarm Intelligence Industry, consider subscribing to industry newsletters, following relevant companies and organizations, or regularly checking reputable industry news sources and publications.
Methodology
Step 1 - Identification of Relevant Samples Size from Population Database


Step 2 - Approaches for Defining Global Market Size (Value, Volume* & Price*)

Note*: In applicable scenarios
Step 3 - Data Sources
Primary Research
- Web Analytics
- Survey Reports
- Research Institute
- Latest Research Reports
- Opinion Leaders
Secondary Research
- Annual Reports
- White Paper
- Latest Press Release
- Industry Association
- Paid Database
- Investor Presentations

Step 4 - Data Triangulation
Involves using different sources of information in order to increase the validity of a study
These sources are likely to be stakeholders in a program - participants, other researchers, program staff, other community members, and so on.
Then we put all data in single framework & apply various statistical tools to find out the dynamic on the market.
During the analysis stage, feedback from the stakeholder groups would be compared to determine areas of agreement as well as areas of divergence


