
Key Insights
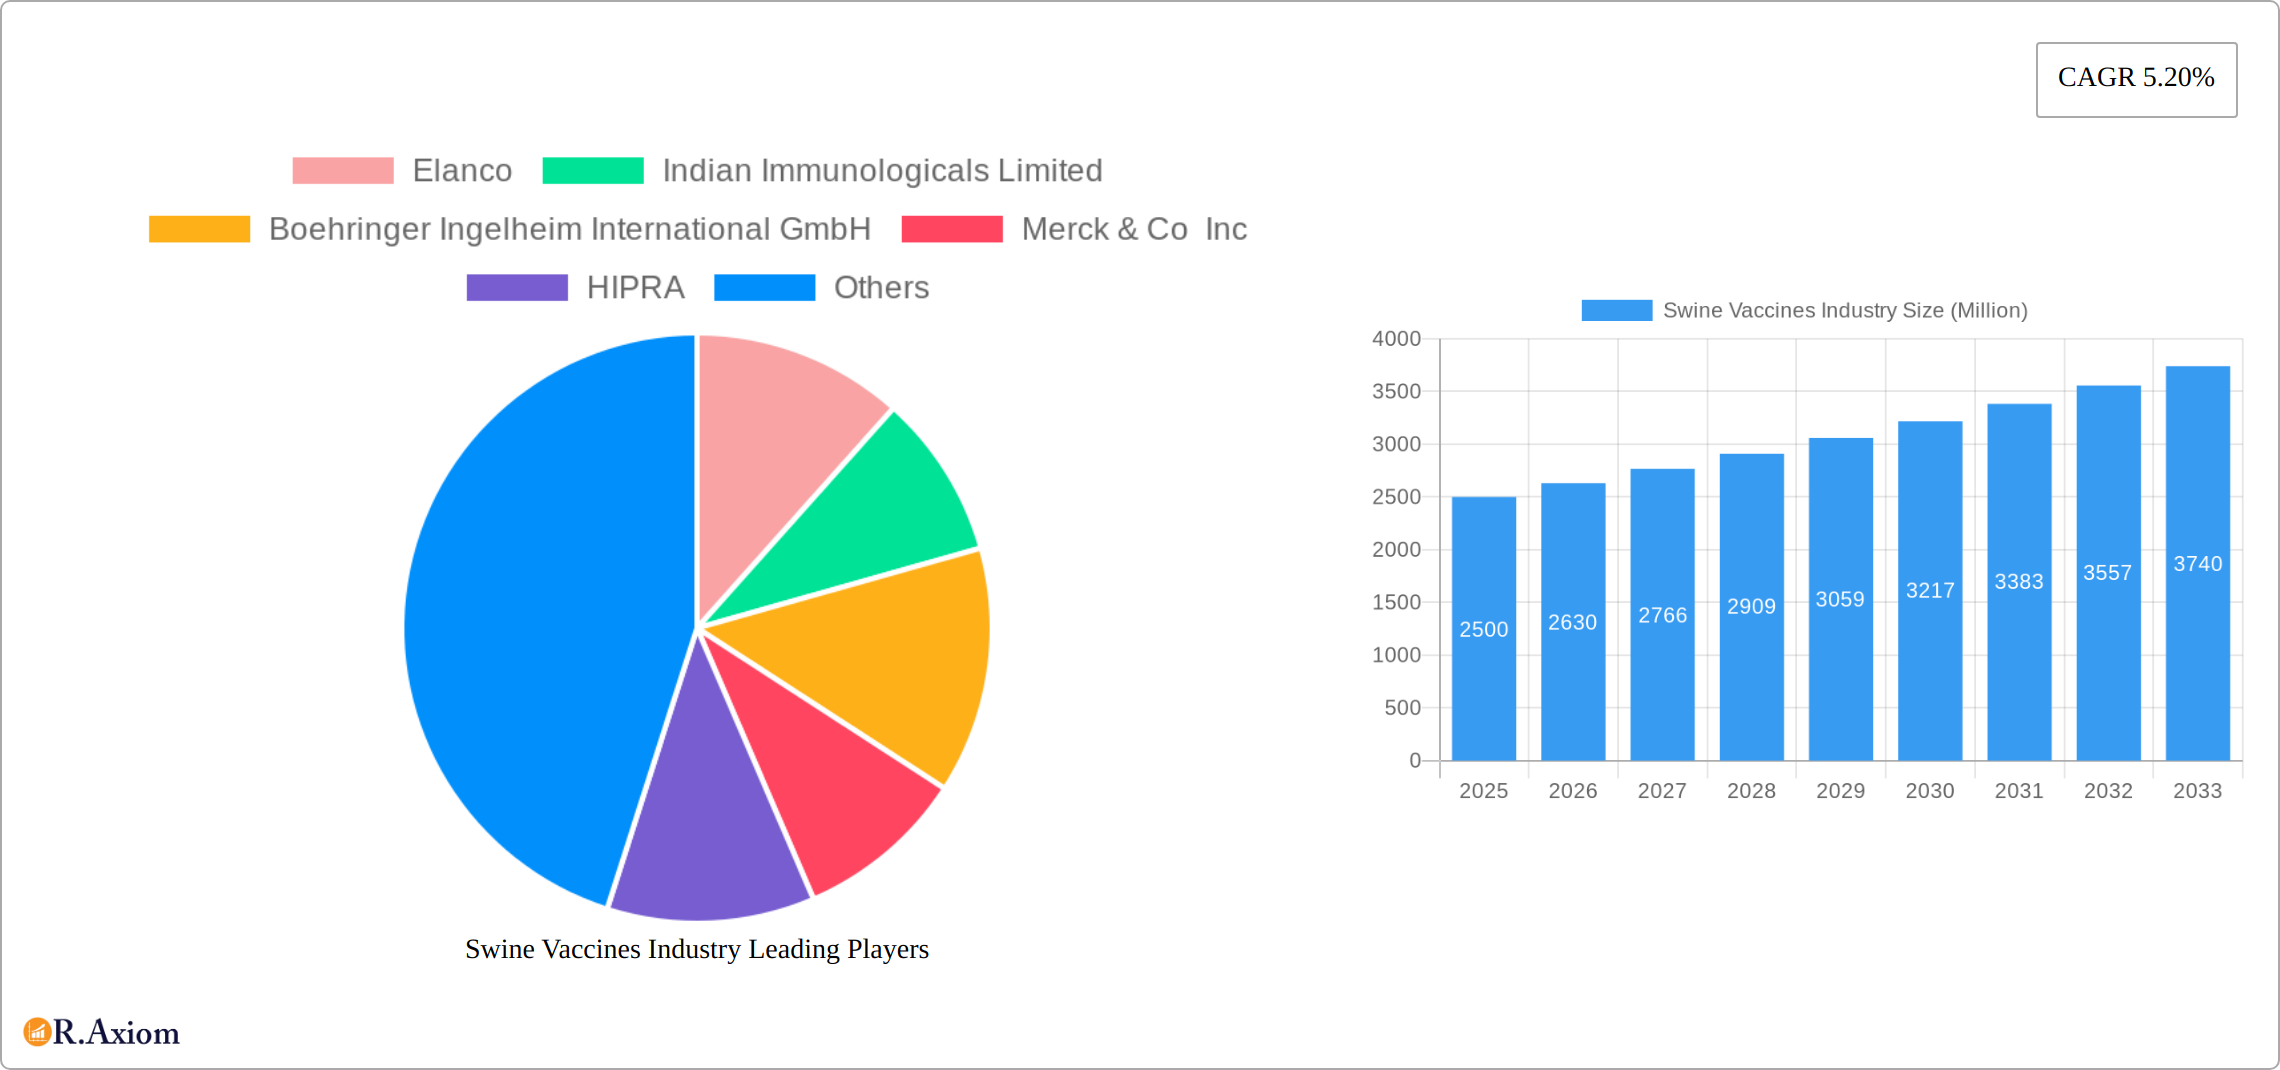
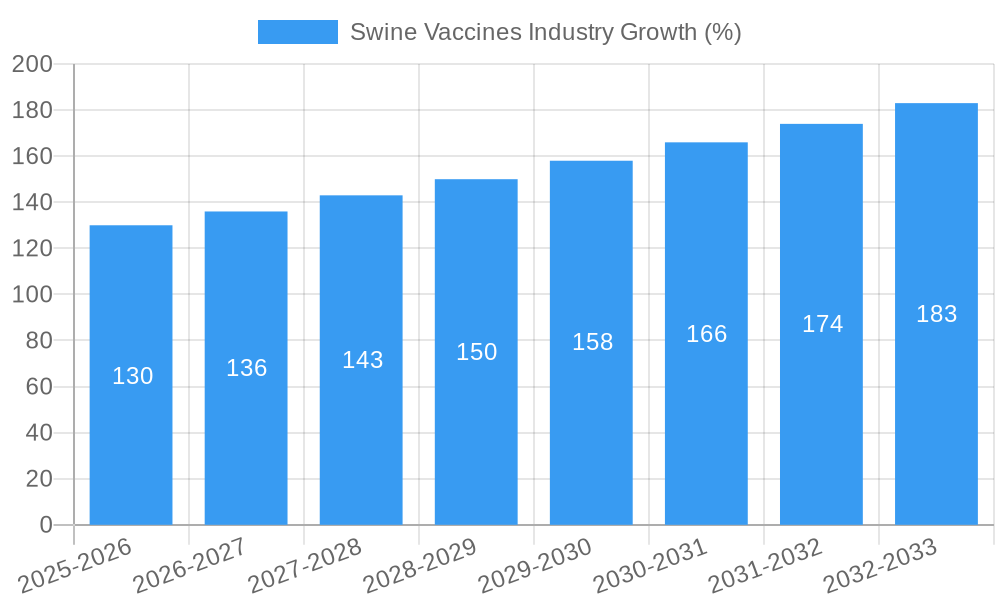
The global swine vaccine market, valued at approximately $XX million in 2025, is projected to experience robust growth, exhibiting a Compound Annual Growth Rate (CAGR) of 5.20% from 2025 to 2033. This expansion is driven by several key factors. Increasing prevalence of swine diseases like Classical Swine Fever, Porcine Parvovirus, and Swine Influenza necessitates widespread vaccination programs, particularly in high-density pig farming regions of Asia-Pacific and North America. Furthermore, the rising demand for safe and high-quality pork products fuels the adoption of preventative measures like vaccination, contributing to market growth. Technological advancements in vaccine development, such as the introduction of more effective recombinant vaccines, are also driving market expansion. The market is segmented by product type (inactivated, attenuated live, recombinant, and others) and disease type. While inactivated vaccines currently hold a significant market share due to their established safety profile, recombinant vaccines are gaining traction due to their higher efficacy and reduced side effects. The competitive landscape comprises both established global players like Zoetis, Boehringer Ingelheim, and Merck, and regional players catering to specific market needs. Growth, however, might face restraints from stringent regulatory approvals, potential vaccine resistance in certain pig populations, and price fluctuations in raw materials.
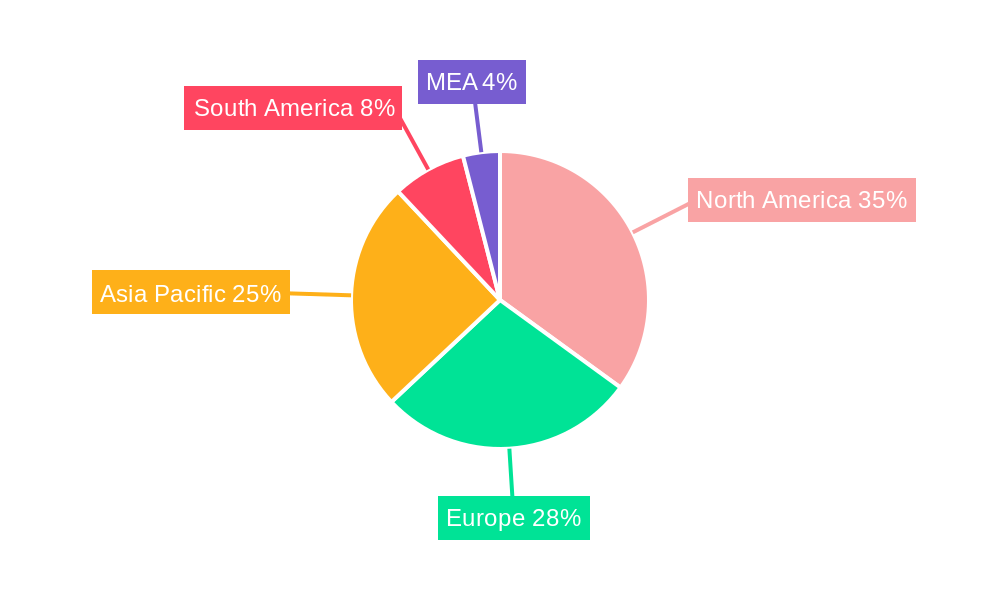
The market's regional distribution reflects the global distribution of swine farming. North America and Europe are expected to maintain substantial market share due to established veterinary infrastructure and high adoption rates of swine vaccines. However, the Asia-Pacific region is poised for significant growth, driven by expanding pig farming activities and rising awareness of disease prevention in countries like China and India. South America and the Middle East & Africa regions, while currently smaller markets, show promise for future growth as their swine farming industries evolve and vaccination practices become more widely adopted. The forecast period (2025-2033) will likely see continued market consolidation as larger companies pursue acquisitions and strategic partnerships to enhance their product portfolios and market reach. This dynamic interplay of drivers, restraints, and regional variations will shape the trajectory of the swine vaccine market in the coming years.
Swine Vaccines Industry: A Comprehensive Market Report (2019-2033)
This detailed report provides a comprehensive analysis of the global swine vaccines market, covering market size, segmentation, growth drivers, challenges, and key players. The study period spans from 2019 to 2033, with 2025 serving as the base and estimated year. The report offers actionable insights for industry stakeholders, including manufacturers, distributors, and investors. It leverages extensive market research and data analysis to provide a clear understanding of current market dynamics and future growth prospects. The total market value in 2025 is estimated at xx Million and is projected to reach xx Million by 2033, exhibiting a CAGR of xx% during the forecast period (2025-2033).
Swine Vaccines Industry Market Concentration & Innovation
The swine vaccines market exhibits a moderately concentrated landscape, with several multinational pharmaceutical companies holding significant market share. Elanco, Boehringer Ingelheim, Merck & Co Inc, and Zoetis are among the leading players, accounting for an estimated xx% of the global market share in 2025. Innovation is a key driver, with companies investing heavily in the development of novel vaccines, including recombinant and subunit vaccines, to address emerging diseases and improve vaccine efficacy.
- Market Concentration: High (xx%) driven by a few multinational players.
- Innovation Drivers: Development of novel vaccine technologies (recombinant, subunit), focus on improved efficacy and safety profiles.
- Regulatory Frameworks: Stringent regulatory approvals impact market entry and product lifecycle.
- Product Substitutes: Limited direct substitutes but alternative disease management strategies exist.
- End-User Trends: Increasing demand from intensive pig farming operations and growing focus on biosecurity.
- M&A Activities: The sector has witnessed significant M&A activity in recent years, with deal values totaling an estimated xx Million in the period 2019-2024. These activities aim to expand product portfolios and enhance market reach.
Swine Vaccines Industry Industry Trends & Insights
The swine vaccines market is experiencing robust growth, driven by several factors including: increasing global pork consumption, expansion of intensive pig farming, rising awareness of animal health, and government support for disease prevention programs. The market has also seen technological disruptions, including the development of new vaccine delivery systems and improved adjuvant technologies that enhance vaccine effectiveness. Consumer preferences are shifting toward safer, more efficacious vaccines with reduced side effects. Competitive dynamics are shaped by product innovation, pricing strategies, and distribution networks. The market’s CAGR from 2019 to 2024 was xx%, indicating consistent growth. Market penetration remains significant in developed regions, but opportunities exist in emerging markets.
Dominant Markets & Segments in Swine Vaccines Industry
Dominant Region/Country: China and the EU currently dominate the market, driven by their large pig populations and stringent biosecurity regulations. However, growth is also being observed in other regions such as North America and Southeast Asia.
Dominant Segments:
By Product: Inactivated vaccines hold the largest market share in 2025 due to their established efficacy and safety profile. However, the recombinant vaccines segment is expected to witness the fastest growth during the forecast period, driven by technological advancements.
By Disease Type: Swine Influenza, Porcine Reproductive and Respiratory Syndrome (PRRS), and Porcine Parvovirus represent the largest disease-specific segments. Classical Swine Fever remains a significant concern, particularly in some regions.
Key Drivers for Dominant Segments:
- Economic policies: Government subsidies and support for animal health programs.
- Infrastructure: Improved veterinary infrastructure and access to vaccines.
- Disease prevalence: High prevalence of specific swine diseases.
Swine Vaccines Industry Product Developments
Recent years have witnessed significant product innovation in the swine vaccines industry. Focus is on developing multivalent vaccines, offering protection against multiple diseases in a single dose, improving vaccine delivery systems (e.g., intranasal vaccines), and incorporating advanced adjuvants to boost immunogenicity. These innovations address the need for improved efficacy, reduced injection stress for animals, and enhanced cost-effectiveness for producers. The market is also seeing the rise of personalized vaccines tailored to specific regional disease patterns.
Report Scope & Segmentation Analysis
This report comprehensively segments the swine vaccines market based on both product type and disease indication.
By Product: Inactivated vaccines, attenuated live vaccines, recombinant vaccines, and others (e.g., subunit vaccines). The report analyzes the market size, growth projections, and competitive dynamics of each segment.
By Disease Type: Classical Swine Fever, Porcine Parvovirus, Swine Influenza, PRRS, and others. The report examines the prevalence of each disease, the market size for vaccines targeting each disease, and the competitive landscape within each segment.
Key Drivers of Swine Vaccines Industry Growth
Growth in the swine vaccines market is driven by several factors:
- Increased pork consumption: Globally increasing demand for pork is increasing pig farming.
- Intensification of pig farming: Larger farms necessitate disease prevention programs.
- Government regulations: Stringent regulations regarding disease control and biosecurity.
- Technological advancements: Improvements in vaccine technology (e.g., recombinant vaccines) enhance efficacy.
Challenges in the Swine Vaccines Industry Sector
The swine vaccines industry faces several challenges including:
- Stringent regulatory requirements: Obtaining approvals can be time-consuming and costly.
- Supply chain complexities: Ensuring consistent vaccine supply to diverse markets.
- Price competition: Intense competition among major players affects profitability.
- Disease emergence: Constant emergence of new disease strains requires ongoing vaccine development.
Emerging Opportunities in Swine Vaccines Industry
Several opportunities are shaping the future of the swine vaccines industry:
- Expansion in emerging markets: Developing countries offer significant growth potential.
- Development of novel vaccine technologies: Subunit, mRNA, and other advanced vaccine platforms.
- Personalized medicine approaches: Tailoring vaccines to specific strains and regional needs.
- Focus on One Health: Integrating animal health with human and environmental health.
Leading Players in the Swine Vaccines Industry Market
- Elanco
- Indian Immunologicals Limited
- Boehringer Ingelheim International GmbH
- Merck & Co Inc
- HIPRA
- Virbac
- Biogenesis Bago
- Vaxxinova International BV
- KM Biologics
- Phibro Animal Health Corporation
- Ceva Sante Animale
- Zoetis Inc
Key Developments in Swine Vaccines Industry Industry
- March 2022: Boehringer Ingelheim launched ReproCyc ParvoFLEX, a porcine parvovirus vaccine.
- May 2022: Boehringer Ingelheim launched TwistPak, a platform for combining Ingelvac MycoFLEX and Ingelvac CircoFLEX vaccines.
Strategic Outlook for Swine Vaccines Industry Market
The swine vaccines market is poised for continued growth, driven by increasing pork production, technological advancements, and the ongoing need for effective disease control. Focus on innovation, strategic partnerships, and expansion into new markets will be key success factors for companies in this dynamic sector. The development of personalized and multivalent vaccines, coupled with improved vaccine delivery systems, will further shape the market landscape.
Swine Vaccines Industry Segmentation
-
1. Product
- 1.1. Inactivated Vaccines
- 1.2. Attenuated Live Vaccines
- 1.3. Recombinant Vaccines
- 1.4. Others
-
2. Disease Type
- 2.1. Classical Swine Fever
- 2.2. Porcine Parvovirus
- 2.3. Swine Influenza
- 2.4. Others
Swine Vaccines Industry Segmentation By Geography
-
1. North America
- 1.1. United States
- 1.2. Canada
- 1.3. Mexico
-
2. Europe
- 2.1. Germany
- 2.2. United Kingdom
- 2.3. France
- 2.4. Italy
- 2.5. Spain
- 2.6. Rest of Europe
-
3. Asia Pacific
- 3.1. China
- 3.2. Japan
- 3.3. India
- 3.4. Australia
- 3.5. South Korea
- 3.6. Rest of Asia Pacific
- 4. Rest of the World
Swine Vaccines Industry REPORT HIGHLIGHTS
| Aspects | Details |
|---|---|
| Study Period | 2019-2033 |
| Base Year | 2024 |
| Estimated Year | 2025 |
| Forecast Period | 2025-2033 |
| Historical Period | 2019-2024 |
| Growth Rate | CAGR of 5.20% from 2019-2033 |
| Segmentation |
|
Table of Contents
- 1. Introduction
- 1.1. Research Scope
- 1.2. Market Segmentation
- 1.3. Research Methodology
- 1.4. Definitions and Assumptions
- 2. Executive Summary
- 2.1. Introduction
- 3. Market Dynamics
- 3.1. Introduction
- 3.2. Market Drivers
- 3.2.1. Government Initiatives toward Swine Flu Management and Increasing Awareness about Influenza A; Increase In Research and Development Expenditure Toward Vaccine Innovation
- 3.3. Market Restrains
- 3.3.1. High Expenses of Maintaining and Handling Storage Conditions along with Chance of Reverse Reaction from Vaccines
- 3.4. Market Trends
- 3.4.1. Inactivated Vaccines Segment is Expected to Witness Significant Growth Over the Forecast Period
- 4. Market Factor Analysis
- 4.1. Porters Five Forces
- 4.2. Supply/Value Chain
- 4.3. PESTEL analysis
- 4.4. Market Entropy
- 4.5. Patent/Trademark Analysis
- 5. Global Swine Vaccines Industry Analysis, Insights and Forecast, 2019-2031
- 5.1. Market Analysis, Insights and Forecast - by Product
- 5.1.1. Inactivated Vaccines
- 5.1.2. Attenuated Live Vaccines
- 5.1.3. Recombinant Vaccines
- 5.1.4. Others
- 5.2. Market Analysis, Insights and Forecast - by Disease Type
- 5.2.1. Classical Swine Fever
- 5.2.2. Porcine Parvovirus
- 5.2.3. Swine Influenza
- 5.2.4. Others
- 5.3. Market Analysis, Insights and Forecast - by Region
- 5.3.1. North America
- 5.3.2. Europe
- 5.3.3. Asia Pacific
- 5.3.4. Rest of the World
- 5.1. Market Analysis, Insights and Forecast - by Product
- 6. North America Swine Vaccines Industry Analysis, Insights and Forecast, 2019-2031
- 6.1. Market Analysis, Insights and Forecast - by Product
- 6.1.1. Inactivated Vaccines
- 6.1.2. Attenuated Live Vaccines
- 6.1.3. Recombinant Vaccines
- 6.1.4. Others
- 6.2. Market Analysis, Insights and Forecast - by Disease Type
- 6.2.1. Classical Swine Fever
- 6.2.2. Porcine Parvovirus
- 6.2.3. Swine Influenza
- 6.2.4. Others
- 6.1. Market Analysis, Insights and Forecast - by Product
- 7. Europe Swine Vaccines Industry Analysis, Insights and Forecast, 2019-2031
- 7.1. Market Analysis, Insights and Forecast - by Product
- 7.1.1. Inactivated Vaccines
- 7.1.2. Attenuated Live Vaccines
- 7.1.3. Recombinant Vaccines
- 7.1.4. Others
- 7.2. Market Analysis, Insights and Forecast - by Disease Type
- 7.2.1. Classical Swine Fever
- 7.2.2. Porcine Parvovirus
- 7.2.3. Swine Influenza
- 7.2.4. Others
- 7.1. Market Analysis, Insights and Forecast - by Product
- 8. Asia Pacific Swine Vaccines Industry Analysis, Insights and Forecast, 2019-2031
- 8.1. Market Analysis, Insights and Forecast - by Product
- 8.1.1. Inactivated Vaccines
- 8.1.2. Attenuated Live Vaccines
- 8.1.3. Recombinant Vaccines
- 8.1.4. Others
- 8.2. Market Analysis, Insights and Forecast - by Disease Type
- 8.2.1. Classical Swine Fever
- 8.2.2. Porcine Parvovirus
- 8.2.3. Swine Influenza
- 8.2.4. Others
- 8.1. Market Analysis, Insights and Forecast - by Product
- 9. Rest of the World Swine Vaccines Industry Analysis, Insights and Forecast, 2019-2031
- 9.1. Market Analysis, Insights and Forecast - by Product
- 9.1.1. Inactivated Vaccines
- 9.1.2. Attenuated Live Vaccines
- 9.1.3. Recombinant Vaccines
- 9.1.4. Others
- 9.2. Market Analysis, Insights and Forecast - by Disease Type
- 9.2.1. Classical Swine Fever
- 9.2.2. Porcine Parvovirus
- 9.2.3. Swine Influenza
- 9.2.4. Others
- 9.1. Market Analysis, Insights and Forecast - by Product
- 10. North America Swine Vaccines Industry Analysis, Insights and Forecast, 2019-2031
- 10.1. Market Analysis, Insights and Forecast - By Country/Sub-region
- 10.1.1 United States
- 10.1.2 Canada
- 10.1.3 Mexico
- 11. Europe Swine Vaccines Industry Analysis, Insights and Forecast, 2019-2031
- 11.1. Market Analysis, Insights and Forecast - By Country/Sub-region
- 11.1.1 Germany
- 11.1.2 United Kingdom
- 11.1.3 France
- 11.1.4 Spain
- 11.1.5 Italy
- 11.1.6 Spain
- 11.1.7 Belgium
- 11.1.8 Netherland
- 11.1.9 Nordics
- 11.1.10 Rest of Europe
- 12. Asia Pacific Swine Vaccines Industry Analysis, Insights and Forecast, 2019-2031
- 12.1. Market Analysis, Insights and Forecast - By Country/Sub-region
- 12.1.1 China
- 12.1.2 Japan
- 12.1.3 India
- 12.1.4 South Korea
- 12.1.5 Southeast Asia
- 12.1.6 Australia
- 12.1.7 Indonesia
- 12.1.8 Phillipes
- 12.1.9 Singapore
- 12.1.10 Thailandc
- 12.1.11 Rest of Asia Pacific
- 13. South America Swine Vaccines Industry Analysis, Insights and Forecast, 2019-2031
- 13.1. Market Analysis, Insights and Forecast - By Country/Sub-region
- 13.1.1 Brazil
- 13.1.2 Argentina
- 13.1.3 Peru
- 13.1.4 Chile
- 13.1.5 Colombia
- 13.1.6 Ecuador
- 13.1.7 Venezuela
- 13.1.8 Rest of South America
- 14. North America Swine Vaccines Industry Analysis, Insights and Forecast, 2019-2031
- 14.1. Market Analysis, Insights and Forecast - By Country/Sub-region
- 14.1.1 United States
- 14.1.2 Canada
- 14.1.3 Mexico
- 15. MEA Swine Vaccines Industry Analysis, Insights and Forecast, 2019-2031
- 15.1. Market Analysis, Insights and Forecast - By Country/Sub-region
- 15.1.1 United Arab Emirates
- 15.1.2 Saudi Arabia
- 15.1.3 South Africa
- 15.1.4 Rest of Middle East and Africa
- 16. Competitive Analysis
- 16.1. Global Market Share Analysis 2024
- 16.2. Company Profiles
- 16.2.1 Elanco
- 16.2.1.1. Overview
- 16.2.1.2. Products
- 16.2.1.3. SWOT Analysis
- 16.2.1.4. Recent Developments
- 16.2.1.5. Financials (Based on Availability)
- 16.2.2 Indian Immunologicals Limited
- 16.2.2.1. Overview
- 16.2.2.2. Products
- 16.2.2.3. SWOT Analysis
- 16.2.2.4. Recent Developments
- 16.2.2.5. Financials (Based on Availability)
- 16.2.3 Boehringer Ingelheim International GmbH
- 16.2.3.1. Overview
- 16.2.3.2. Products
- 16.2.3.3. SWOT Analysis
- 16.2.3.4. Recent Developments
- 16.2.3.5. Financials (Based on Availability)
- 16.2.4 Merck & Co Inc
- 16.2.4.1. Overview
- 16.2.4.2. Products
- 16.2.4.3. SWOT Analysis
- 16.2.4.4. Recent Developments
- 16.2.4.5. Financials (Based on Availability)
- 16.2.5 HIPRA
- 16.2.5.1. Overview
- 16.2.5.2. Products
- 16.2.5.3. SWOT Analysis
- 16.2.5.4. Recent Developments
- 16.2.5.5. Financials (Based on Availability)
- 16.2.6 Virbac
- 16.2.6.1. Overview
- 16.2.6.2. Products
- 16.2.6.3. SWOT Analysis
- 16.2.6.4. Recent Developments
- 16.2.6.5. Financials (Based on Availability)
- 16.2.7 Biogenesis Bago
- 16.2.7.1. Overview
- 16.2.7.2. Products
- 16.2.7.3. SWOT Analysis
- 16.2.7.4. Recent Developments
- 16.2.7.5. Financials (Based on Availability)
- 16.2.8 Vaxxinova International BV
- 16.2.8.1. Overview
- 16.2.8.2. Products
- 16.2.8.3. SWOT Analysis
- 16.2.8.4. Recent Developments
- 16.2.8.5. Financials (Based on Availability)
- 16.2.9 KM Biologics
- 16.2.9.1. Overview
- 16.2.9.2. Products
- 16.2.9.3. SWOT Analysis
- 16.2.9.4. Recent Developments
- 16.2.9.5. Financials (Based on Availability)
- 16.2.10 Phibro Animal Health Corporation
- 16.2.10.1. Overview
- 16.2.10.2. Products
- 16.2.10.3. SWOT Analysis
- 16.2.10.4. Recent Developments
- 16.2.10.5. Financials (Based on Availability)
- 16.2.11 Ceva Sante Animale
- 16.2.11.1. Overview
- 16.2.11.2. Products
- 16.2.11.3. SWOT Analysis
- 16.2.11.4. Recent Developments
- 16.2.11.5. Financials (Based on Availability)
- 16.2.12 Zoetis Inc
- 16.2.12.1. Overview
- 16.2.12.2. Products
- 16.2.12.3. SWOT Analysis
- 16.2.12.4. Recent Developments
- 16.2.12.5. Financials (Based on Availability)
- 16.2.1 Elanco
List of Figures
- Figure 1: Global Swine Vaccines Industry Revenue Breakdown (Million, %) by Region 2024 & 2032
- Figure 2: Global Swine Vaccines Industry Volume Breakdown (K Unit, %) by Region 2024 & 2032
- Figure 3: North America Swine Vaccines Industry Revenue (Million), by Country 2024 & 2032
- Figure 4: North America Swine Vaccines Industry Volume (K Unit), by Country 2024 & 2032
- Figure 5: North America Swine Vaccines Industry Revenue Share (%), by Country 2024 & 2032
- Figure 6: North America Swine Vaccines Industry Volume Share (%), by Country 2024 & 2032
- Figure 7: Europe Swine Vaccines Industry Revenue (Million), by Country 2024 & 2032
- Figure 8: Europe Swine Vaccines Industry Volume (K Unit), by Country 2024 & 2032
- Figure 9: Europe Swine Vaccines Industry Revenue Share (%), by Country 2024 & 2032
- Figure 10: Europe Swine Vaccines Industry Volume Share (%), by Country 2024 & 2032
- Figure 11: Asia Pacific Swine Vaccines Industry Revenue (Million), by Country 2024 & 2032
- Figure 12: Asia Pacific Swine Vaccines Industry Volume (K Unit), by Country 2024 & 2032
- Figure 13: Asia Pacific Swine Vaccines Industry Revenue Share (%), by Country 2024 & 2032
- Figure 14: Asia Pacific Swine Vaccines Industry Volume Share (%), by Country 2024 & 2032
- Figure 15: South America Swine Vaccines Industry Revenue (Million), by Country 2024 & 2032
- Figure 16: South America Swine Vaccines Industry Volume (K Unit), by Country 2024 & 2032
- Figure 17: South America Swine Vaccines Industry Revenue Share (%), by Country 2024 & 2032
- Figure 18: South America Swine Vaccines Industry Volume Share (%), by Country 2024 & 2032
- Figure 19: North America Swine Vaccines Industry Revenue (Million), by Country 2024 & 2032
- Figure 20: North America Swine Vaccines Industry Volume (K Unit), by Country 2024 & 2032
- Figure 21: North America Swine Vaccines Industry Revenue Share (%), by Country 2024 & 2032
- Figure 22: North America Swine Vaccines Industry Volume Share (%), by Country 2024 & 2032
- Figure 23: MEA Swine Vaccines Industry Revenue (Million), by Country 2024 & 2032
- Figure 24: MEA Swine Vaccines Industry Volume (K Unit), by Country 2024 & 2032
- Figure 25: MEA Swine Vaccines Industry Revenue Share (%), by Country 2024 & 2032
- Figure 26: MEA Swine Vaccines Industry Volume Share (%), by Country 2024 & 2032
- Figure 27: North America Swine Vaccines Industry Revenue (Million), by Product 2024 & 2032
- Figure 28: North America Swine Vaccines Industry Volume (K Unit), by Product 2024 & 2032
- Figure 29: North America Swine Vaccines Industry Revenue Share (%), by Product 2024 & 2032
- Figure 30: North America Swine Vaccines Industry Volume Share (%), by Product 2024 & 2032
- Figure 31: North America Swine Vaccines Industry Revenue (Million), by Disease Type 2024 & 2032
- Figure 32: North America Swine Vaccines Industry Volume (K Unit), by Disease Type 2024 & 2032
- Figure 33: North America Swine Vaccines Industry Revenue Share (%), by Disease Type 2024 & 2032
- Figure 34: North America Swine Vaccines Industry Volume Share (%), by Disease Type 2024 & 2032
- Figure 35: North America Swine Vaccines Industry Revenue (Million), by Country 2024 & 2032
- Figure 36: North America Swine Vaccines Industry Volume (K Unit), by Country 2024 & 2032
- Figure 37: North America Swine Vaccines Industry Revenue Share (%), by Country 2024 & 2032
- Figure 38: North America Swine Vaccines Industry Volume Share (%), by Country 2024 & 2032
- Figure 39: Europe Swine Vaccines Industry Revenue (Million), by Product 2024 & 2032
- Figure 40: Europe Swine Vaccines Industry Volume (K Unit), by Product 2024 & 2032
- Figure 41: Europe Swine Vaccines Industry Revenue Share (%), by Product 2024 & 2032
- Figure 42: Europe Swine Vaccines Industry Volume Share (%), by Product 2024 & 2032
- Figure 43: Europe Swine Vaccines Industry Revenue (Million), by Disease Type 2024 & 2032
- Figure 44: Europe Swine Vaccines Industry Volume (K Unit), by Disease Type 2024 & 2032
- Figure 45: Europe Swine Vaccines Industry Revenue Share (%), by Disease Type 2024 & 2032
- Figure 46: Europe Swine Vaccines Industry Volume Share (%), by Disease Type 2024 & 2032
- Figure 47: Europe Swine Vaccines Industry Revenue (Million), by Country 2024 & 2032
- Figure 48: Europe Swine Vaccines Industry Volume (K Unit), by Country 2024 & 2032
- Figure 49: Europe Swine Vaccines Industry Revenue Share (%), by Country 2024 & 2032
- Figure 50: Europe Swine Vaccines Industry Volume Share (%), by Country 2024 & 2032
- Figure 51: Asia Pacific Swine Vaccines Industry Revenue (Million), by Product 2024 & 2032
- Figure 52: Asia Pacific Swine Vaccines Industry Volume (K Unit), by Product 2024 & 2032
- Figure 53: Asia Pacific Swine Vaccines Industry Revenue Share (%), by Product 2024 & 2032
- Figure 54: Asia Pacific Swine Vaccines Industry Volume Share (%), by Product 2024 & 2032
- Figure 55: Asia Pacific Swine Vaccines Industry Revenue (Million), by Disease Type 2024 & 2032
- Figure 56: Asia Pacific Swine Vaccines Industry Volume (K Unit), by Disease Type 2024 & 2032
- Figure 57: Asia Pacific Swine Vaccines Industry Revenue Share (%), by Disease Type 2024 & 2032
- Figure 58: Asia Pacific Swine Vaccines Industry Volume Share (%), by Disease Type 2024 & 2032
- Figure 59: Asia Pacific Swine Vaccines Industry Revenue (Million), by Country 2024 & 2032
- Figure 60: Asia Pacific Swine Vaccines Industry Volume (K Unit), by Country 2024 & 2032
- Figure 61: Asia Pacific Swine Vaccines Industry Revenue Share (%), by Country 2024 & 2032
- Figure 62: Asia Pacific Swine Vaccines Industry Volume Share (%), by Country 2024 & 2032
- Figure 63: Rest of the World Swine Vaccines Industry Revenue (Million), by Product 2024 & 2032
- Figure 64: Rest of the World Swine Vaccines Industry Volume (K Unit), by Product 2024 & 2032
- Figure 65: Rest of the World Swine Vaccines Industry Revenue Share (%), by Product 2024 & 2032
- Figure 66: Rest of the World Swine Vaccines Industry Volume Share (%), by Product 2024 & 2032
- Figure 67: Rest of the World Swine Vaccines Industry Revenue (Million), by Disease Type 2024 & 2032
- Figure 68: Rest of the World Swine Vaccines Industry Volume (K Unit), by Disease Type 2024 & 2032
- Figure 69: Rest of the World Swine Vaccines Industry Revenue Share (%), by Disease Type 2024 & 2032
- Figure 70: Rest of the World Swine Vaccines Industry Volume Share (%), by Disease Type 2024 & 2032
- Figure 71: Rest of the World Swine Vaccines Industry Revenue (Million), by Country 2024 & 2032
- Figure 72: Rest of the World Swine Vaccines Industry Volume (K Unit), by Country 2024 & 2032
- Figure 73: Rest of the World Swine Vaccines Industry Revenue Share (%), by Country 2024 & 2032
- Figure 74: Rest of the World Swine Vaccines Industry Volume Share (%), by Country 2024 & 2032
List of Tables
- Table 1: Global Swine Vaccines Industry Revenue Million Forecast, by Region 2019 & 2032
- Table 2: Global Swine Vaccines Industry Volume K Unit Forecast, by Region 2019 & 2032
- Table 3: Global Swine Vaccines Industry Revenue Million Forecast, by Product 2019 & 2032
- Table 4: Global Swine Vaccines Industry Volume K Unit Forecast, by Product 2019 & 2032
- Table 5: Global Swine Vaccines Industry Revenue Million Forecast, by Disease Type 2019 & 2032
- Table 6: Global Swine Vaccines Industry Volume K Unit Forecast, by Disease Type 2019 & 2032
- Table 7: Global Swine Vaccines Industry Revenue Million Forecast, by Region 2019 & 2032
- Table 8: Global Swine Vaccines Industry Volume K Unit Forecast, by Region 2019 & 2032
- Table 9: Global Swine Vaccines Industry Revenue Million Forecast, by Country 2019 & 2032
- Table 10: Global Swine Vaccines Industry Volume K Unit Forecast, by Country 2019 & 2032
- Table 11: United States Swine Vaccines Industry Revenue (Million) Forecast, by Application 2019 & 2032
- Table 12: United States Swine Vaccines Industry Volume (K Unit) Forecast, by Application 2019 & 2032
- Table 13: Canada Swine Vaccines Industry Revenue (Million) Forecast, by Application 2019 & 2032
- Table 14: Canada Swine Vaccines Industry Volume (K Unit) Forecast, by Application 2019 & 2032
- Table 15: Mexico Swine Vaccines Industry Revenue (Million) Forecast, by Application 2019 & 2032
- Table 16: Mexico Swine Vaccines Industry Volume (K Unit) Forecast, by Application 2019 & 2032
- Table 17: Global Swine Vaccines Industry Revenue Million Forecast, by Country 2019 & 2032
- Table 18: Global Swine Vaccines Industry Volume K Unit Forecast, by Country 2019 & 2032
- Table 19: Germany Swine Vaccines Industry Revenue (Million) Forecast, by Application 2019 & 2032
- Table 20: Germany Swine Vaccines Industry Volume (K Unit) Forecast, by Application 2019 & 2032
- Table 21: United Kingdom Swine Vaccines Industry Revenue (Million) Forecast, by Application 2019 & 2032
- Table 22: United Kingdom Swine Vaccines Industry Volume (K Unit) Forecast, by Application 2019 & 2032
- Table 23: France Swine Vaccines Industry Revenue (Million) Forecast, by Application 2019 & 2032
- Table 24: France Swine Vaccines Industry Volume (K Unit) Forecast, by Application 2019 & 2032
- Table 25: Spain Swine Vaccines Industry Revenue (Million) Forecast, by Application 2019 & 2032
- Table 26: Spain Swine Vaccines Industry Volume (K Unit) Forecast, by Application 2019 & 2032
- Table 27: Italy Swine Vaccines Industry Revenue (Million) Forecast, by Application 2019 & 2032
- Table 28: Italy Swine Vaccines Industry Volume (K Unit) Forecast, by Application 2019 & 2032
- Table 29: Spain Swine Vaccines Industry Revenue (Million) Forecast, by Application 2019 & 2032
- Table 30: Spain Swine Vaccines Industry Volume (K Unit) Forecast, by Application 2019 & 2032
- Table 31: Belgium Swine Vaccines Industry Revenue (Million) Forecast, by Application 2019 & 2032
- Table 32: Belgium Swine Vaccines Industry Volume (K Unit) Forecast, by Application 2019 & 2032
- Table 33: Netherland Swine Vaccines Industry Revenue (Million) Forecast, by Application 2019 & 2032
- Table 34: Netherland Swine Vaccines Industry Volume (K Unit) Forecast, by Application 2019 & 2032
- Table 35: Nordics Swine Vaccines Industry Revenue (Million) Forecast, by Application 2019 & 2032
- Table 36: Nordics Swine Vaccines Industry Volume (K Unit) Forecast, by Application 2019 & 2032
- Table 37: Rest of Europe Swine Vaccines Industry Revenue (Million) Forecast, by Application 2019 & 2032
- Table 38: Rest of Europe Swine Vaccines Industry Volume (K Unit) Forecast, by Application 2019 & 2032
- Table 39: Global Swine Vaccines Industry Revenue Million Forecast, by Country 2019 & 2032
- Table 40: Global Swine Vaccines Industry Volume K Unit Forecast, by Country 2019 & 2032
- Table 41: China Swine Vaccines Industry Revenue (Million) Forecast, by Application 2019 & 2032
- Table 42: China Swine Vaccines Industry Volume (K Unit) Forecast, by Application 2019 & 2032
- Table 43: Japan Swine Vaccines Industry Revenue (Million) Forecast, by Application 2019 & 2032
- Table 44: Japan Swine Vaccines Industry Volume (K Unit) Forecast, by Application 2019 & 2032
- Table 45: India Swine Vaccines Industry Revenue (Million) Forecast, by Application 2019 & 2032
- Table 46: India Swine Vaccines Industry Volume (K Unit) Forecast, by Application 2019 & 2032
- Table 47: South Korea Swine Vaccines Industry Revenue (Million) Forecast, by Application 2019 & 2032
- Table 48: South Korea Swine Vaccines Industry Volume (K Unit) Forecast, by Application 2019 & 2032
- Table 49: Southeast Asia Swine Vaccines Industry Revenue (Million) Forecast, by Application 2019 & 2032
- Table 50: Southeast Asia Swine Vaccines Industry Volume (K Unit) Forecast, by Application 2019 & 2032
- Table 51: Australia Swine Vaccines Industry Revenue (Million) Forecast, by Application 2019 & 2032
- Table 52: Australia Swine Vaccines Industry Volume (K Unit) Forecast, by Application 2019 & 2032
- Table 53: Indonesia Swine Vaccines Industry Revenue (Million) Forecast, by Application 2019 & 2032
- Table 54: Indonesia Swine Vaccines Industry Volume (K Unit) Forecast, by Application 2019 & 2032
- Table 55: Phillipes Swine Vaccines Industry Revenue (Million) Forecast, by Application 2019 & 2032
- Table 56: Phillipes Swine Vaccines Industry Volume (K Unit) Forecast, by Application 2019 & 2032
- Table 57: Singapore Swine Vaccines Industry Revenue (Million) Forecast, by Application 2019 & 2032
- Table 58: Singapore Swine Vaccines Industry Volume (K Unit) Forecast, by Application 2019 & 2032
- Table 59: Thailandc Swine Vaccines Industry Revenue (Million) Forecast, by Application 2019 & 2032
- Table 60: Thailandc Swine Vaccines Industry Volume (K Unit) Forecast, by Application 2019 & 2032
- Table 61: Rest of Asia Pacific Swine Vaccines Industry Revenue (Million) Forecast, by Application 2019 & 2032
- Table 62: Rest of Asia Pacific Swine Vaccines Industry Volume (K Unit) Forecast, by Application 2019 & 2032
- Table 63: Global Swine Vaccines Industry Revenue Million Forecast, by Country 2019 & 2032
- Table 64: Global Swine Vaccines Industry Volume K Unit Forecast, by Country 2019 & 2032
- Table 65: Brazil Swine Vaccines Industry Revenue (Million) Forecast, by Application 2019 & 2032
- Table 66: Brazil Swine Vaccines Industry Volume (K Unit) Forecast, by Application 2019 & 2032
- Table 67: Argentina Swine Vaccines Industry Revenue (Million) Forecast, by Application 2019 & 2032
- Table 68: Argentina Swine Vaccines Industry Volume (K Unit) Forecast, by Application 2019 & 2032
- Table 69: Peru Swine Vaccines Industry Revenue (Million) Forecast, by Application 2019 & 2032
- Table 70: Peru Swine Vaccines Industry Volume (K Unit) Forecast, by Application 2019 & 2032
- Table 71: Chile Swine Vaccines Industry Revenue (Million) Forecast, by Application 2019 & 2032
- Table 72: Chile Swine Vaccines Industry Volume (K Unit) Forecast, by Application 2019 & 2032
- Table 73: Colombia Swine Vaccines Industry Revenue (Million) Forecast, by Application 2019 & 2032
- Table 74: Colombia Swine Vaccines Industry Volume (K Unit) Forecast, by Application 2019 & 2032
- Table 75: Ecuador Swine Vaccines Industry Revenue (Million) Forecast, by Application 2019 & 2032
- Table 76: Ecuador Swine Vaccines Industry Volume (K Unit) Forecast, by Application 2019 & 2032
- Table 77: Venezuela Swine Vaccines Industry Revenue (Million) Forecast, by Application 2019 & 2032
- Table 78: Venezuela Swine Vaccines Industry Volume (K Unit) Forecast, by Application 2019 & 2032
- Table 79: Rest of South America Swine Vaccines Industry Revenue (Million) Forecast, by Application 2019 & 2032
- Table 80: Rest of South America Swine Vaccines Industry Volume (K Unit) Forecast, by Application 2019 & 2032
- Table 81: Global Swine Vaccines Industry Revenue Million Forecast, by Country 2019 & 2032
- Table 82: Global Swine Vaccines Industry Volume K Unit Forecast, by Country 2019 & 2032
- Table 83: United States Swine Vaccines Industry Revenue (Million) Forecast, by Application 2019 & 2032
- Table 84: United States Swine Vaccines Industry Volume (K Unit) Forecast, by Application 2019 & 2032
- Table 85: Canada Swine Vaccines Industry Revenue (Million) Forecast, by Application 2019 & 2032
- Table 86: Canada Swine Vaccines Industry Volume (K Unit) Forecast, by Application 2019 & 2032
- Table 87: Mexico Swine Vaccines Industry Revenue (Million) Forecast, by Application 2019 & 2032
- Table 88: Mexico Swine Vaccines Industry Volume (K Unit) Forecast, by Application 2019 & 2032
- Table 89: Global Swine Vaccines Industry Revenue Million Forecast, by Country 2019 & 2032
- Table 90: Global Swine Vaccines Industry Volume K Unit Forecast, by Country 2019 & 2032
- Table 91: United Arab Emirates Swine Vaccines Industry Revenue (Million) Forecast, by Application 2019 & 2032
- Table 92: United Arab Emirates Swine Vaccines Industry Volume (K Unit) Forecast, by Application 2019 & 2032
- Table 93: Saudi Arabia Swine Vaccines Industry Revenue (Million) Forecast, by Application 2019 & 2032
- Table 94: Saudi Arabia Swine Vaccines Industry Volume (K Unit) Forecast, by Application 2019 & 2032
- Table 95: South Africa Swine Vaccines Industry Revenue (Million) Forecast, by Application 2019 & 2032
- Table 96: South Africa Swine Vaccines Industry Volume (K Unit) Forecast, by Application 2019 & 2032
- Table 97: Rest of Middle East and Africa Swine Vaccines Industry Revenue (Million) Forecast, by Application 2019 & 2032
- Table 98: Rest of Middle East and Africa Swine Vaccines Industry Volume (K Unit) Forecast, by Application 2019 & 2032
- Table 99: Global Swine Vaccines Industry Revenue Million Forecast, by Product 2019 & 2032
- Table 100: Global Swine Vaccines Industry Volume K Unit Forecast, by Product 2019 & 2032
- Table 101: Global Swine Vaccines Industry Revenue Million Forecast, by Disease Type 2019 & 2032
- Table 102: Global Swine Vaccines Industry Volume K Unit Forecast, by Disease Type 2019 & 2032
- Table 103: Global Swine Vaccines Industry Revenue Million Forecast, by Country 2019 & 2032
- Table 104: Global Swine Vaccines Industry Volume K Unit Forecast, by Country 2019 & 2032
- Table 105: United States Swine Vaccines Industry Revenue (Million) Forecast, by Application 2019 & 2032
- Table 106: United States Swine Vaccines Industry Volume (K Unit) Forecast, by Application 2019 & 2032
- Table 107: Canada Swine Vaccines Industry Revenue (Million) Forecast, by Application 2019 & 2032
- Table 108: Canada Swine Vaccines Industry Volume (K Unit) Forecast, by Application 2019 & 2032
- Table 109: Mexico Swine Vaccines Industry Revenue (Million) Forecast, by Application 2019 & 2032
- Table 110: Mexico Swine Vaccines Industry Volume (K Unit) Forecast, by Application 2019 & 2032
- Table 111: Global Swine Vaccines Industry Revenue Million Forecast, by Product 2019 & 2032
- Table 112: Global Swine Vaccines Industry Volume K Unit Forecast, by Product 2019 & 2032
- Table 113: Global Swine Vaccines Industry Revenue Million Forecast, by Disease Type 2019 & 2032
- Table 114: Global Swine Vaccines Industry Volume K Unit Forecast, by Disease Type 2019 & 2032
- Table 115: Global Swine Vaccines Industry Revenue Million Forecast, by Country 2019 & 2032
- Table 116: Global Swine Vaccines Industry Volume K Unit Forecast, by Country 2019 & 2032
- Table 117: Germany Swine Vaccines Industry Revenue (Million) Forecast, by Application 2019 & 2032
- Table 118: Germany Swine Vaccines Industry Volume (K Unit) Forecast, by Application 2019 & 2032
- Table 119: United Kingdom Swine Vaccines Industry Revenue (Million) Forecast, by Application 2019 & 2032
- Table 120: United Kingdom Swine Vaccines Industry Volume (K Unit) Forecast, by Application 2019 & 2032
- Table 121: France Swine Vaccines Industry Revenue (Million) Forecast, by Application 2019 & 2032
- Table 122: France Swine Vaccines Industry Volume (K Unit) Forecast, by Application 2019 & 2032
- Table 123: Italy Swine Vaccines Industry Revenue (Million) Forecast, by Application 2019 & 2032
- Table 124: Italy Swine Vaccines Industry Volume (K Unit) Forecast, by Application 2019 & 2032
- Table 125: Spain Swine Vaccines Industry Revenue (Million) Forecast, by Application 2019 & 2032
- Table 126: Spain Swine Vaccines Industry Volume (K Unit) Forecast, by Application 2019 & 2032
- Table 127: Rest of Europe Swine Vaccines Industry Revenue (Million) Forecast, by Application 2019 & 2032
- Table 128: Rest of Europe Swine Vaccines Industry Volume (K Unit) Forecast, by Application 2019 & 2032
- Table 129: Global Swine Vaccines Industry Revenue Million Forecast, by Product 2019 & 2032
- Table 130: Global Swine Vaccines Industry Volume K Unit Forecast, by Product 2019 & 2032
- Table 131: Global Swine Vaccines Industry Revenue Million Forecast, by Disease Type 2019 & 2032
- Table 132: Global Swine Vaccines Industry Volume K Unit Forecast, by Disease Type 2019 & 2032
- Table 133: Global Swine Vaccines Industry Revenue Million Forecast, by Country 2019 & 2032
- Table 134: Global Swine Vaccines Industry Volume K Unit Forecast, by Country 2019 & 2032
- Table 135: China Swine Vaccines Industry Revenue (Million) Forecast, by Application 2019 & 2032
- Table 136: China Swine Vaccines Industry Volume (K Unit) Forecast, by Application 2019 & 2032
- Table 137: Japan Swine Vaccines Industry Revenue (Million) Forecast, by Application 2019 & 2032
- Table 138: Japan Swine Vaccines Industry Volume (K Unit) Forecast, by Application 2019 & 2032
- Table 139: India Swine Vaccines Industry Revenue (Million) Forecast, by Application 2019 & 2032
- Table 140: India Swine Vaccines Industry Volume (K Unit) Forecast, by Application 2019 & 2032
- Table 141: Australia Swine Vaccines Industry Revenue (Million) Forecast, by Application 2019 & 2032
- Table 142: Australia Swine Vaccines Industry Volume (K Unit) Forecast, by Application 2019 & 2032
- Table 143: South Korea Swine Vaccines Industry Revenue (Million) Forecast, by Application 2019 & 2032
- Table 144: South Korea Swine Vaccines Industry Volume (K Unit) Forecast, by Application 2019 & 2032
- Table 145: Rest of Asia Pacific Swine Vaccines Industry Revenue (Million) Forecast, by Application 2019 & 2032
- Table 146: Rest of Asia Pacific Swine Vaccines Industry Volume (K Unit) Forecast, by Application 2019 & 2032
- Table 147: Global Swine Vaccines Industry Revenue Million Forecast, by Product 2019 & 2032
- Table 148: Global Swine Vaccines Industry Volume K Unit Forecast, by Product 2019 & 2032
- Table 149: Global Swine Vaccines Industry Revenue Million Forecast, by Disease Type 2019 & 2032
- Table 150: Global Swine Vaccines Industry Volume K Unit Forecast, by Disease Type 2019 & 2032
- Table 151: Global Swine Vaccines Industry Revenue Million Forecast, by Country 2019 & 2032
- Table 152: Global Swine Vaccines Industry Volume K Unit Forecast, by Country 2019 & 2032
Frequently Asked Questions
1. What is the projected Compound Annual Growth Rate (CAGR) of the Swine Vaccines Industry?
The projected CAGR is approximately 5.20%.
2. Which companies are prominent players in the Swine Vaccines Industry?
Key companies in the market include Elanco, Indian Immunologicals Limited, Boehringer Ingelheim International GmbH, Merck & Co Inc, HIPRA, Virbac, Biogenesis Bago, Vaxxinova International BV, KM Biologics, Phibro Animal Health Corporation, Ceva Sante Animale, Zoetis Inc.
3. What are the main segments of the Swine Vaccines Industry?
The market segments include Product, Disease Type.
4. Can you provide details about the market size?
The market size is estimated to be USD XX Million as of 2022.
5. What are some drivers contributing to market growth?
Government Initiatives toward Swine Flu Management and Increasing Awareness about Influenza A; Increase In Research and Development Expenditure Toward Vaccine Innovation.
6. What are the notable trends driving market growth?
Inactivated Vaccines Segment is Expected to Witness Significant Growth Over the Forecast Period.
7. Are there any restraints impacting market growth?
High Expenses of Maintaining and Handling Storage Conditions along with Chance of Reverse Reaction from Vaccines.
8. Can you provide examples of recent developments in the market?
May 2022: Boehringer Ingelheim launched TwistPak, a unique mixing platform that allows swine producers to combine two vaccines, Ingelvac MycoFLEX and Ingelvac CircoFLEX, reliably and conveniently.
9. What pricing options are available for accessing the report?
Pricing options include single-user, multi-user, and enterprise licenses priced at USD 4750, USD 5250, and USD 8750 respectively.
10. Is the market size provided in terms of value or volume?
The market size is provided in terms of value, measured in Million and volume, measured in K Unit.
11. Are there any specific market keywords associated with the report?
Yes, the market keyword associated with the report is "Swine Vaccines Industry," which aids in identifying and referencing the specific market segment covered.
12. How do I determine which pricing option suits my needs best?
The pricing options vary based on user requirements and access needs. Individual users may opt for single-user licenses, while businesses requiring broader access may choose multi-user or enterprise licenses for cost-effective access to the report.
13. Are there any additional resources or data provided in the Swine Vaccines Industry report?
While the report offers comprehensive insights, it's advisable to review the specific contents or supplementary materials provided to ascertain if additional resources or data are available.
14. How can I stay updated on further developments or reports in the Swine Vaccines Industry?
To stay informed about further developments, trends, and reports in the Swine Vaccines Industry, consider subscribing to industry newsletters, following relevant companies and organizations, or regularly checking reputable industry news sources and publications.
Methodology
Step 1 - Identification of Relevant Samples Size from Population Database


Step 2 - Approaches for Defining Global Market Size (Value, Volume* & Price*)

Note*: In applicable scenarios
Step 3 - Data Sources
Primary Research
- Web Analytics
- Survey Reports
- Research Institute
- Latest Research Reports
- Opinion Leaders
Secondary Research
- Annual Reports
- White Paper
- Latest Press Release
- Industry Association
- Paid Database
- Investor Presentations

Step 4 - Data Triangulation
Involves using different sources of information in order to increase the validity of a study
These sources are likely to be stakeholders in a program - participants, other researchers, program staff, other community members, and so on.
Then we put all data in single framework & apply various statistical tools to find out the dynamic on the market.
During the analysis stage, feedback from the stakeholder groups would be compared to determine areas of agreement as well as areas of divergence


