
Key Insights
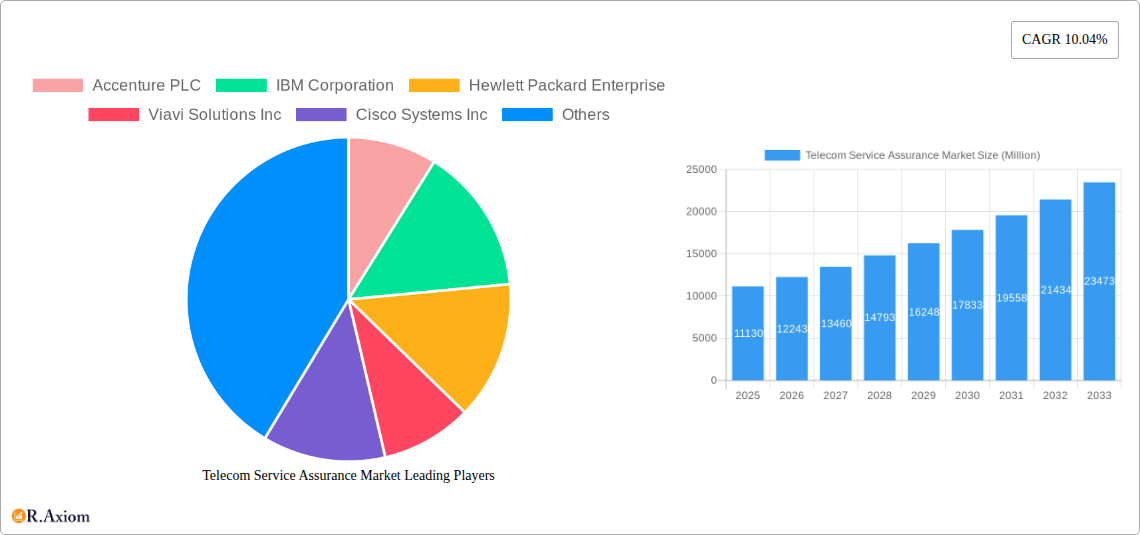
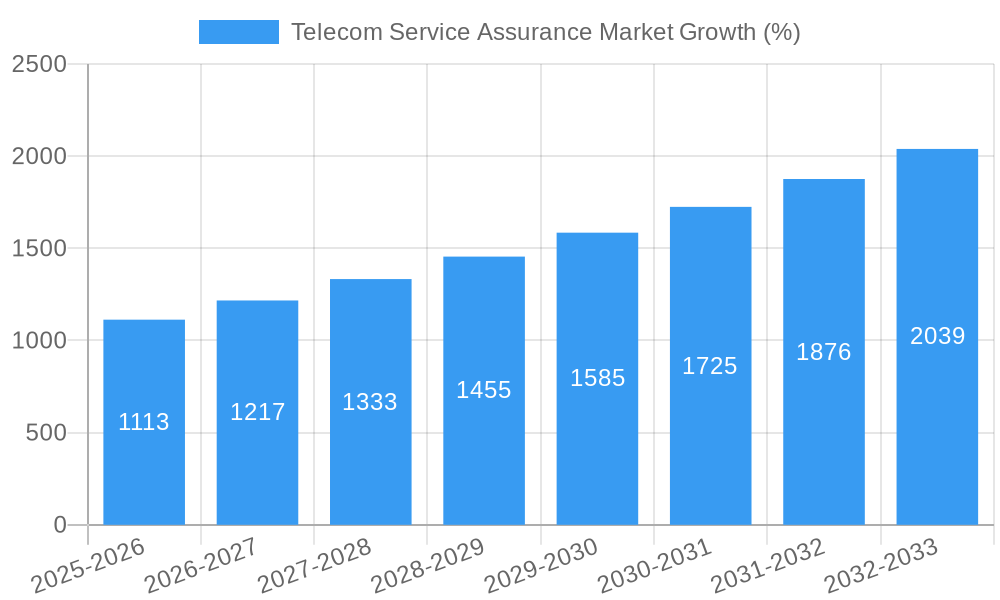
The Telecom Service Assurance market is experiencing robust growth, projected to reach $11.13 billion in 2025 and maintain a Compound Annual Growth Rate (CAGR) of 10.04% from 2025 to 2033. This expansion is driven by several key factors. The increasing complexity of telecommunication networks, fueled by the rise of 5G, IoT, and cloud-based services, necessitates sophisticated assurance solutions to ensure optimal performance and minimize service disruptions. Furthermore, the growing demand for enhanced customer experience and the need for proactive network management are significant drivers. The market is segmented by component type (system and services) and deployment type (on-premise and hosted). The services segment is expected to witness faster growth due to the increasing preference for outsourcing and the expertise offered by specialized service providers. Competition is intense, with major players like Accenture, IBM, Hewlett Packard Enterprise, and Cisco Systems vying for market share through technological innovation and strategic partnerships. Geographical expansion is also a key trend, with North America and Europe currently holding significant market share but Asia-Pacific exhibiting strong growth potential. The market faces some restraints, primarily related to the high initial investment costs associated with implementing advanced service assurance solutions. However, the long-term benefits in terms of improved operational efficiency and reduced downtime outweigh these costs, driving continued market growth.
The forecast period (2025-2033) anticipates continued growth fueled by the sustained adoption of advanced technologies such as AI and machine learning in service assurance. This will enable more proactive and predictive network management, further enhancing customer satisfaction and network performance. The ongoing digital transformation across various industries also contributes significantly to market expansion, as telecommunication networks become increasingly vital for supporting diverse applications and services. The competitive landscape will likely see further consolidation as companies strive to expand their service offerings and geographical reach. The hosted deployment model is expected to gain significant traction due to its cost-effectiveness and scalability. Continued focus on innovation in areas like network automation and analytics will shape future market dynamics.
This in-depth report provides a comprehensive analysis of the Telecom Service Assurance market, covering market size, growth drivers, challenges, opportunities, and key players. The study period spans from 2019 to 2033, with 2025 serving as the base and estimated year. The report leverages extensive data analysis and expert insights to offer actionable strategies for industry stakeholders.
Telecom Service Assurance Market Concentration & Innovation
The Telecom Service Assurance market exhibits a moderately concentrated landscape, with a handful of established players holding significant market share. Accenture PLC, IBM Corporation, Hewlett Packard Enterprise, and Cisco Systems Inc. are among the dominant players, collectively accounting for an estimated xx% of the market in 2025. However, the market also features several smaller, specialized vendors offering niche solutions. Market concentration is influenced by factors such as technological innovation, economies of scale, and strategic mergers and acquisitions (M&A). The average M&A deal value in the sector during 2020-2024 was approximately $xx Million, indicating strong consolidation activity.
Innovation is a key driver, with companies continually developing advanced analytics, AI-powered solutions, and cloud-based platforms to enhance service assurance capabilities. Regulatory frameworks, including data privacy regulations and cybersecurity standards, significantly impact market dynamics. The presence of substitute technologies, such as open-source solutions, creates competitive pressure. Finally, end-user trends, including the increasing adoption of 5G and IoT, are shaping demand for sophisticated service assurance solutions.
- Key Market Concentration Metrics:
- Top 5 players' combined market share (2025): xx%
- Average M&A deal value (2020-2024): $xx Million
- Number of M&A deals (2020-2024): xx
Telecom Service Assurance Market Industry Trends & Insights
The Telecom Service Assurance market is experiencing robust growth, driven by the escalating demand for high-quality network services and the increasing complexity of telecom networks. The market is projected to achieve a Compound Annual Growth Rate (CAGR) of xx% during the forecast period (2025-2033), expanding from $xx Million in 2025 to $xx Million by 2033. This growth is fueled by several key factors, including the proliferation of 5G networks, the increasing adoption of IoT devices, and the growing need for network optimization and automation. Technological disruptions, such as the integration of AI and machine learning, are transforming service assurance capabilities, enabling proactive network management and improved customer experience. Consumer preferences are shifting toward personalized and reliable services, further driving the demand for advanced service assurance solutions. Competitive dynamics are characterized by continuous innovation, strategic partnerships, and acquisitions, shaping market leadership. Market penetration of AI-driven service assurance solutions is projected to reach xx% by 2033.
Dominant Markets & Segments in Telecom Service Assurance Market
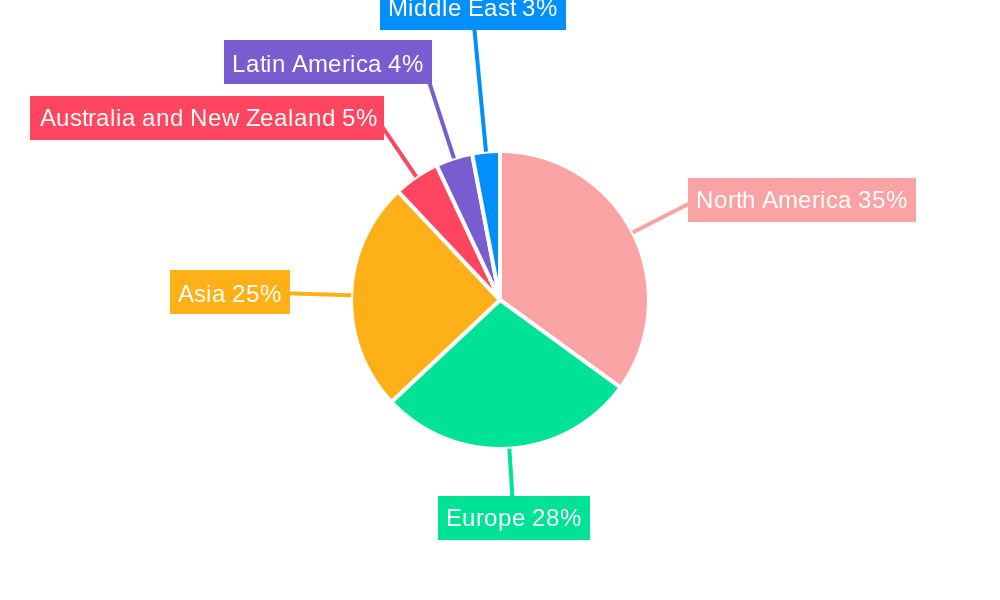
The North American region currently holds the largest market share in the Telecom Service Assurance sector, driven by strong investments in 5G infrastructure, the early adoption of advanced technologies, and a robust telecom industry. However, Asia-Pacific is projected to exhibit the highest growth rate during the forecast period due to rapid network expansion and increasing digitalization across the region.
By Component Type:
- System Type: The system type segment is projected to dominate, fueled by the need for comprehensive network monitoring and management tools.
- Other System Types: This segment includes specialized tools and platforms offering niche functionalities.
- Services Type: The services segment is expected to witness strong growth due to increasing demand for professional services and managed solutions.
By Deployment Type:
- On-Premise: On-premise deployments remain prevalent in large enterprises, offering greater control and customization.
- Hosted: The hosted deployment model is gaining traction due to its scalability, cost-effectiveness, and ease of deployment.
Key drivers for regional dominance include robust economic policies supporting digital infrastructure development, substantial government investments in telecom infrastructure, and a large and growing subscriber base.
Telecom Service Assurance Market Product Developments
Recent product innovations focus on AI-powered analytics, automation, and cloud-based solutions to enhance network visibility, optimize performance, and improve customer experience. The integration of machine learning algorithms enables proactive identification and resolution of network issues, minimizing service disruptions. These advanced capabilities provide a significant competitive advantage, attracting telcos seeking enhanced operational efficiency and improved customer satisfaction. The market fit is strong, particularly among operators deploying 5G and IoT technologies.
Report Scope & Segmentation Analysis
This report provides a comprehensive analysis of the Telecom Service Assurance market, segmented by component type (system type, other system types, services type) and deployment type (on-premise, hosted). Each segment's growth projections, market size estimations, and competitive dynamics are thoroughly analyzed. The market size for each segment is projected to grow significantly during the forecast period, reflecting the expanding demand for advanced service assurance solutions across various deployment models and functionalities. Competitive landscapes within each segment reveal a mix of established players and emerging vendors, vying for market share through innovation and strategic partnerships.
Key Drivers of Telecom Service Assurance Market Growth
Several factors fuel the growth of the Telecom Service Assurance market. Technological advancements, particularly in AI, machine learning, and big data analytics, are transforming network management and service assurance capabilities. The increasing adoption of 5G and IoT networks necessitates sophisticated service assurance solutions to ensure reliable performance and optimal customer experience. Furthermore, stringent regulatory requirements related to network performance and service quality drive the demand for robust monitoring and management tools.
Challenges in the Telecom Service Assurance Market Sector
The Telecom Service Assurance market faces several challenges. The high cost of implementation and maintenance of advanced service assurance solutions can be a barrier for smaller operators. Integration complexities between different service assurance systems and legacy network infrastructure can hinder efficient deployment. Furthermore, the intense competition among vendors necessitates continuous innovation and adaptation to market dynamics. These factors can collectively impact market growth and profitability for individual players.
Emerging Opportunities in Telecom Service Assurance Market
Emerging opportunities include the expansion into new markets, particularly in developing regions with rapidly growing telecom infrastructure. The increasing adoption of edge computing and network slicing presents opportunities for specialized service assurance solutions. The growing demand for AI-powered predictive analytics and proactive network management is further expanding market potential. These trends position the market for continued growth and innovation.
Leading Players in the Telecom Service Assurance Market Market
- Accenture PLC
- IBM Corporation
- Hewlett Packard Enterprise
- Viavi Solutions Inc
- Cisco Systems Inc
- Tata Consultancy Services Limited
- Telefonaktiebolaget LM Ericsson
- NEC Corporation
- Nokia Corporation
- Broadcom Inc (CA Technologies Inc)
Key Developments in Telecom Service Assurance Market Industry
- March 2024: ServiceNow partnered with NVIDIA to launch Now Assist for Telecommunications Service Management (TSM), leveraging GenAI for streamlined telco processes, impacting network management assurance.
- February 2024: MYCOM OSI enhanced its Experience Assurance and Analytics (EAA) suite, improving issue identification and resolution for mobile and fixed lines, driving faster troubleshooting and improved customer experience.
Strategic Outlook for Telecom Service Assurance Market Market
The Telecom Service Assurance market presents significant growth potential, fueled by ongoing technological advancements, expanding network infrastructure, and increasing demand for reliable and high-quality services. The convergence of AI, big data analytics, and cloud computing will continue to shape the market, enabling proactive network management, enhanced customer experience, and optimized operational efficiency. This presents significant opportunities for both established players and emerging vendors to capitalize on the growing demand for advanced service assurance solutions.
Telecom Service Assurance Market Segmentation
-
1. Component Type
-
1.1. System Type
- 1.1.1. Probe System
- 1.1.2. Network Management
- 1.1.3. Workforce Management
- 1.1.4. Fault Management
- 1.1.5. Quality Monitoring
- 1.1.6. Other System Types
-
1.2. Services Type
- 1.2.1. Professional Services
- 1.2.2. Managed Services
-
1.1. System Type
-
2. Deployment Type
- 2.1. On-Premise
- 2.2. Hosted
Telecom Service Assurance Market Segmentation By Geography
- 1. North America
- 2. Europe
- 3. Asia
- 4. Australia and New Zealand
- 5. Latin America
- 6. Middle East
Telecom Service Assurance Market REPORT HIGHLIGHTS
| Aspects | Details |
|---|---|
| Study Period | 2019-2033 |
| Base Year | 2024 |
| Estimated Year | 2025 |
| Forecast Period | 2025-2033 |
| Historical Period | 2019-2024 |
| Growth Rate | CAGR of 10.04% from 2019-2033 |
| Segmentation |
|
Table of Contents
- 1. Introduction
- 1.1. Research Scope
- 1.2. Market Segmentation
- 1.3. Research Methodology
- 1.4. Definitions and Assumptions
- 2. Executive Summary
- 2.1. Introduction
- 3. Market Dynamics
- 3.1. Introduction
- 3.2. Market Drivers
- 3.2.1. Increasing Demand for Service Quality; Significant Increase in the Number of Cellular Subscribers; Rising Need for High Optimization and Increased Saving Costs
- 3.3. Market Restrains
- 3.3.1. Data Privacy Concerns; Lack of Infrastructure in Emerging Economies
- 3.4. Market Trends
- 3.4.1. Network Management System Expected to Witness Significant Growth
- 4. Market Factor Analysis
- 4.1. Porters Five Forces
- 4.2. Supply/Value Chain
- 4.3. PESTEL analysis
- 4.4. Market Entropy
- 4.5. Patent/Trademark Analysis
- 5. Global Telecom Service Assurance Market Analysis, Insights and Forecast, 2019-2031
- 5.1. Market Analysis, Insights and Forecast - by Component Type
- 5.1.1. System Type
- 5.1.1.1. Probe System
- 5.1.1.2. Network Management
- 5.1.1.3. Workforce Management
- 5.1.1.4. Fault Management
- 5.1.1.5. Quality Monitoring
- 5.1.1.6. Other System Types
- 5.1.2. Services Type
- 5.1.2.1. Professional Services
- 5.1.2.2. Managed Services
- 5.1.1. System Type
- 5.2. Market Analysis, Insights and Forecast - by Deployment Type
- 5.2.1. On-Premise
- 5.2.2. Hosted
- 5.3. Market Analysis, Insights and Forecast - by Region
- 5.3.1. North America
- 5.3.2. Europe
- 5.3.3. Asia
- 5.3.4. Australia and New Zealand
- 5.3.5. Latin America
- 5.3.6. Middle East
- 5.1. Market Analysis, Insights and Forecast - by Component Type
- 6. North America Telecom Service Assurance Market Analysis, Insights and Forecast, 2019-2031
- 6.1. Market Analysis, Insights and Forecast - by Component Type
- 6.1.1. System Type
- 6.1.1.1. Probe System
- 6.1.1.2. Network Management
- 6.1.1.3. Workforce Management
- 6.1.1.4. Fault Management
- 6.1.1.5. Quality Monitoring
- 6.1.1.6. Other System Types
- 6.1.2. Services Type
- 6.1.2.1. Professional Services
- 6.1.2.2. Managed Services
- 6.1.1. System Type
- 6.2. Market Analysis, Insights and Forecast - by Deployment Type
- 6.2.1. On-Premise
- 6.2.2. Hosted
- 6.1. Market Analysis, Insights and Forecast - by Component Type
- 7. Europe Telecom Service Assurance Market Analysis, Insights and Forecast, 2019-2031
- 7.1. Market Analysis, Insights and Forecast - by Component Type
- 7.1.1. System Type
- 7.1.1.1. Probe System
- 7.1.1.2. Network Management
- 7.1.1.3. Workforce Management
- 7.1.1.4. Fault Management
- 7.1.1.5. Quality Monitoring
- 7.1.1.6. Other System Types
- 7.1.2. Services Type
- 7.1.2.1. Professional Services
- 7.1.2.2. Managed Services
- 7.1.1. System Type
- 7.2. Market Analysis, Insights and Forecast - by Deployment Type
- 7.2.1. On-Premise
- 7.2.2. Hosted
- 7.1. Market Analysis, Insights and Forecast - by Component Type
- 8. Asia Telecom Service Assurance Market Analysis, Insights and Forecast, 2019-2031
- 8.1. Market Analysis, Insights and Forecast - by Component Type
- 8.1.1. System Type
- 8.1.1.1. Probe System
- 8.1.1.2. Network Management
- 8.1.1.3. Workforce Management
- 8.1.1.4. Fault Management
- 8.1.1.5. Quality Monitoring
- 8.1.1.6. Other System Types
- 8.1.2. Services Type
- 8.1.2.1. Professional Services
- 8.1.2.2. Managed Services
- 8.1.1. System Type
- 8.2. Market Analysis, Insights and Forecast - by Deployment Type
- 8.2.1. On-Premise
- 8.2.2. Hosted
- 8.1. Market Analysis, Insights and Forecast - by Component Type
- 9. Australia and New Zealand Telecom Service Assurance Market Analysis, Insights and Forecast, 2019-2031
- 9.1. Market Analysis, Insights and Forecast - by Component Type
- 9.1.1. System Type
- 9.1.1.1. Probe System
- 9.1.1.2. Network Management
- 9.1.1.3. Workforce Management
- 9.1.1.4. Fault Management
- 9.1.1.5. Quality Monitoring
- 9.1.1.6. Other System Types
- 9.1.2. Services Type
- 9.1.2.1. Professional Services
- 9.1.2.2. Managed Services
- 9.1.1. System Type
- 9.2. Market Analysis, Insights and Forecast - by Deployment Type
- 9.2.1. On-Premise
- 9.2.2. Hosted
- 9.1. Market Analysis, Insights and Forecast - by Component Type
- 10. Latin America Telecom Service Assurance Market Analysis, Insights and Forecast, 2019-2031
- 10.1. Market Analysis, Insights and Forecast - by Component Type
- 10.1.1. System Type
- 10.1.1.1. Probe System
- 10.1.1.2. Network Management
- 10.1.1.3. Workforce Management
- 10.1.1.4. Fault Management
- 10.1.1.5. Quality Monitoring
- 10.1.1.6. Other System Types
- 10.1.2. Services Type
- 10.1.2.1. Professional Services
- 10.1.2.2. Managed Services
- 10.1.1. System Type
- 10.2. Market Analysis, Insights and Forecast - by Deployment Type
- 10.2.1. On-Premise
- 10.2.2. Hosted
- 10.1. Market Analysis, Insights and Forecast - by Component Type
- 11. Middle East Telecom Service Assurance Market Analysis, Insights and Forecast, 2019-2031
- 11.1. Market Analysis, Insights and Forecast - by Component Type
- 11.1.1. System Type
- 11.1.1.1. Probe System
- 11.1.1.2. Network Management
- 11.1.1.3. Workforce Management
- 11.1.1.4. Fault Management
- 11.1.1.5. Quality Monitoring
- 11.1.1.6. Other System Types
- 11.1.2. Services Type
- 11.1.2.1. Professional Services
- 11.1.2.2. Managed Services
- 11.1.1. System Type
- 11.2. Market Analysis, Insights and Forecast - by Deployment Type
- 11.2.1. On-Premise
- 11.2.2. Hosted
- 11.1. Market Analysis, Insights and Forecast - by Component Type
- 12. North America Telecom Service Assurance Market Analysis, Insights and Forecast, 2019-2031
- 12.1. Market Analysis, Insights and Forecast - By Country/Sub-region
- 12.1.1.
- 13. Europe Telecom Service Assurance Market Analysis, Insights and Forecast, 2019-2031
- 13.1. Market Analysis, Insights and Forecast - By Country/Sub-region
- 13.1.1.
- 14. Asia Telecom Service Assurance Market Analysis, Insights and Forecast, 2019-2031
- 14.1. Market Analysis, Insights and Forecast - By Country/Sub-region
- 14.1.1.
- 15. Australia and New Zealand Telecom Service Assurance Market Analysis, Insights and Forecast, 2019-2031
- 15.1. Market Analysis, Insights and Forecast - By Country/Sub-region
- 15.1.1.
- 16. Latin America Telecom Service Assurance Market Analysis, Insights and Forecast, 2019-2031
- 16.1. Market Analysis, Insights and Forecast - By Country/Sub-region
- 16.1.1.
- 17. Middle East Telecom Service Assurance Market Analysis, Insights and Forecast, 2019-2031
- 17.1. Market Analysis, Insights and Forecast - By Country/Sub-region
- 17.1.1.
- 18. Competitive Analysis
- 18.1. Global Market Share Analysis 2024
- 18.2. Company Profiles
- 18.2.1 Accenture PLC
- 18.2.1.1. Overview
- 18.2.1.2. Products
- 18.2.1.3. SWOT Analysis
- 18.2.1.4. Recent Developments
- 18.2.1.5. Financials (Based on Availability)
- 18.2.2 IBM Corporation
- 18.2.2.1. Overview
- 18.2.2.2. Products
- 18.2.2.3. SWOT Analysis
- 18.2.2.4. Recent Developments
- 18.2.2.5. Financials (Based on Availability)
- 18.2.3 Hewlett Packard Enterprise
- 18.2.3.1. Overview
- 18.2.3.2. Products
- 18.2.3.3. SWOT Analysis
- 18.2.3.4. Recent Developments
- 18.2.3.5. Financials (Based on Availability)
- 18.2.4 Viavi Solutions Inc
- 18.2.4.1. Overview
- 18.2.4.2. Products
- 18.2.4.3. SWOT Analysis
- 18.2.4.4. Recent Developments
- 18.2.4.5. Financials (Based on Availability)
- 18.2.5 Cisco Systems Inc
- 18.2.5.1. Overview
- 18.2.5.2. Products
- 18.2.5.3. SWOT Analysis
- 18.2.5.4. Recent Developments
- 18.2.5.5. Financials (Based on Availability)
- 18.2.6 Tata Consultancy Services Limited
- 18.2.6.1. Overview
- 18.2.6.2. Products
- 18.2.6.3. SWOT Analysis
- 18.2.6.4. Recent Developments
- 18.2.6.5. Financials (Based on Availability)
- 18.2.7 Telefonaktiebolaget LM Ericsso
- 18.2.7.1. Overview
- 18.2.7.2. Products
- 18.2.7.3. SWOT Analysis
- 18.2.7.4. Recent Developments
- 18.2.7.5. Financials (Based on Availability)
- 18.2.8 NEC Corporation
- 18.2.8.1. Overview
- 18.2.8.2. Products
- 18.2.8.3. SWOT Analysis
- 18.2.8.4. Recent Developments
- 18.2.8.5. Financials (Based on Availability)
- 18.2.9 Nokia Corporation
- 18.2.9.1. Overview
- 18.2.9.2. Products
- 18.2.9.3. SWOT Analysis
- 18.2.9.4. Recent Developments
- 18.2.9.5. Financials (Based on Availability)
- 18.2.10 Broadcom Inc (CA Technologies Inc )
- 18.2.10.1. Overview
- 18.2.10.2. Products
- 18.2.10.3. SWOT Analysis
- 18.2.10.4. Recent Developments
- 18.2.10.5. Financials (Based on Availability)
- 18.2.1 Accenture PLC
List of Figures
- Figure 1: Global Telecom Service Assurance Market Revenue Breakdown (Million, %) by Region 2024 & 2032
- Figure 2: North America Telecom Service Assurance Market Revenue (Million), by Country 2024 & 2032
- Figure 3: North America Telecom Service Assurance Market Revenue Share (%), by Country 2024 & 2032
- Figure 4: Europe Telecom Service Assurance Market Revenue (Million), by Country 2024 & 2032
- Figure 5: Europe Telecom Service Assurance Market Revenue Share (%), by Country 2024 & 2032
- Figure 6: Asia Telecom Service Assurance Market Revenue (Million), by Country 2024 & 2032
- Figure 7: Asia Telecom Service Assurance Market Revenue Share (%), by Country 2024 & 2032
- Figure 8: Australia and New Zealand Telecom Service Assurance Market Revenue (Million), by Country 2024 & 2032
- Figure 9: Australia and New Zealand Telecom Service Assurance Market Revenue Share (%), by Country 2024 & 2032
- Figure 10: Latin America Telecom Service Assurance Market Revenue (Million), by Country 2024 & 2032
- Figure 11: Latin America Telecom Service Assurance Market Revenue Share (%), by Country 2024 & 2032
- Figure 12: Middle East Telecom Service Assurance Market Revenue (Million), by Country 2024 & 2032
- Figure 13: Middle East Telecom Service Assurance Market Revenue Share (%), by Country 2024 & 2032
- Figure 14: North America Telecom Service Assurance Market Revenue (Million), by Component Type 2024 & 2032
- Figure 15: North America Telecom Service Assurance Market Revenue Share (%), by Component Type 2024 & 2032
- Figure 16: North America Telecom Service Assurance Market Revenue (Million), by Deployment Type 2024 & 2032
- Figure 17: North America Telecom Service Assurance Market Revenue Share (%), by Deployment Type 2024 & 2032
- Figure 18: North America Telecom Service Assurance Market Revenue (Million), by Country 2024 & 2032
- Figure 19: North America Telecom Service Assurance Market Revenue Share (%), by Country 2024 & 2032
- Figure 20: Europe Telecom Service Assurance Market Revenue (Million), by Component Type 2024 & 2032
- Figure 21: Europe Telecom Service Assurance Market Revenue Share (%), by Component Type 2024 & 2032
- Figure 22: Europe Telecom Service Assurance Market Revenue (Million), by Deployment Type 2024 & 2032
- Figure 23: Europe Telecom Service Assurance Market Revenue Share (%), by Deployment Type 2024 & 2032
- Figure 24: Europe Telecom Service Assurance Market Revenue (Million), by Country 2024 & 2032
- Figure 25: Europe Telecom Service Assurance Market Revenue Share (%), by Country 2024 & 2032
- Figure 26: Asia Telecom Service Assurance Market Revenue (Million), by Component Type 2024 & 2032
- Figure 27: Asia Telecom Service Assurance Market Revenue Share (%), by Component Type 2024 & 2032
- Figure 28: Asia Telecom Service Assurance Market Revenue (Million), by Deployment Type 2024 & 2032
- Figure 29: Asia Telecom Service Assurance Market Revenue Share (%), by Deployment Type 2024 & 2032
- Figure 30: Asia Telecom Service Assurance Market Revenue (Million), by Country 2024 & 2032
- Figure 31: Asia Telecom Service Assurance Market Revenue Share (%), by Country 2024 & 2032
- Figure 32: Australia and New Zealand Telecom Service Assurance Market Revenue (Million), by Component Type 2024 & 2032
- Figure 33: Australia and New Zealand Telecom Service Assurance Market Revenue Share (%), by Component Type 2024 & 2032
- Figure 34: Australia and New Zealand Telecom Service Assurance Market Revenue (Million), by Deployment Type 2024 & 2032
- Figure 35: Australia and New Zealand Telecom Service Assurance Market Revenue Share (%), by Deployment Type 2024 & 2032
- Figure 36: Australia and New Zealand Telecom Service Assurance Market Revenue (Million), by Country 2024 & 2032
- Figure 37: Australia and New Zealand Telecom Service Assurance Market Revenue Share (%), by Country 2024 & 2032
- Figure 38: Latin America Telecom Service Assurance Market Revenue (Million), by Component Type 2024 & 2032
- Figure 39: Latin America Telecom Service Assurance Market Revenue Share (%), by Component Type 2024 & 2032
- Figure 40: Latin America Telecom Service Assurance Market Revenue (Million), by Deployment Type 2024 & 2032
- Figure 41: Latin America Telecom Service Assurance Market Revenue Share (%), by Deployment Type 2024 & 2032
- Figure 42: Latin America Telecom Service Assurance Market Revenue (Million), by Country 2024 & 2032
- Figure 43: Latin America Telecom Service Assurance Market Revenue Share (%), by Country 2024 & 2032
- Figure 44: Middle East Telecom Service Assurance Market Revenue (Million), by Component Type 2024 & 2032
- Figure 45: Middle East Telecom Service Assurance Market Revenue Share (%), by Component Type 2024 & 2032
- Figure 46: Middle East Telecom Service Assurance Market Revenue (Million), by Deployment Type 2024 & 2032
- Figure 47: Middle East Telecom Service Assurance Market Revenue Share (%), by Deployment Type 2024 & 2032
- Figure 48: Middle East Telecom Service Assurance Market Revenue (Million), by Country 2024 & 2032
- Figure 49: Middle East Telecom Service Assurance Market Revenue Share (%), by Country 2024 & 2032
List of Tables
- Table 1: Global Telecom Service Assurance Market Revenue Million Forecast, by Region 2019 & 2032
- Table 2: Global Telecom Service Assurance Market Revenue Million Forecast, by Component Type 2019 & 2032
- Table 3: Global Telecom Service Assurance Market Revenue Million Forecast, by Deployment Type 2019 & 2032
- Table 4: Global Telecom Service Assurance Market Revenue Million Forecast, by Region 2019 & 2032
- Table 5: Global Telecom Service Assurance Market Revenue Million Forecast, by Country 2019 & 2032
- Table 6: Telecom Service Assurance Market Revenue (Million) Forecast, by Application 2019 & 2032
- Table 7: Global Telecom Service Assurance Market Revenue Million Forecast, by Country 2019 & 2032
- Table 8: Telecom Service Assurance Market Revenue (Million) Forecast, by Application 2019 & 2032
- Table 9: Global Telecom Service Assurance Market Revenue Million Forecast, by Country 2019 & 2032
- Table 10: Telecom Service Assurance Market Revenue (Million) Forecast, by Application 2019 & 2032
- Table 11: Global Telecom Service Assurance Market Revenue Million Forecast, by Country 2019 & 2032
- Table 12: Telecom Service Assurance Market Revenue (Million) Forecast, by Application 2019 & 2032
- Table 13: Global Telecom Service Assurance Market Revenue Million Forecast, by Country 2019 & 2032
- Table 14: Telecom Service Assurance Market Revenue (Million) Forecast, by Application 2019 & 2032
- Table 15: Global Telecom Service Assurance Market Revenue Million Forecast, by Country 2019 & 2032
- Table 16: Telecom Service Assurance Market Revenue (Million) Forecast, by Application 2019 & 2032
- Table 17: Global Telecom Service Assurance Market Revenue Million Forecast, by Component Type 2019 & 2032
- Table 18: Global Telecom Service Assurance Market Revenue Million Forecast, by Deployment Type 2019 & 2032
- Table 19: Global Telecom Service Assurance Market Revenue Million Forecast, by Country 2019 & 2032
- Table 20: Global Telecom Service Assurance Market Revenue Million Forecast, by Component Type 2019 & 2032
- Table 21: Global Telecom Service Assurance Market Revenue Million Forecast, by Deployment Type 2019 & 2032
- Table 22: Global Telecom Service Assurance Market Revenue Million Forecast, by Country 2019 & 2032
- Table 23: Global Telecom Service Assurance Market Revenue Million Forecast, by Component Type 2019 & 2032
- Table 24: Global Telecom Service Assurance Market Revenue Million Forecast, by Deployment Type 2019 & 2032
- Table 25: Global Telecom Service Assurance Market Revenue Million Forecast, by Country 2019 & 2032
- Table 26: Global Telecom Service Assurance Market Revenue Million Forecast, by Component Type 2019 & 2032
- Table 27: Global Telecom Service Assurance Market Revenue Million Forecast, by Deployment Type 2019 & 2032
- Table 28: Global Telecom Service Assurance Market Revenue Million Forecast, by Country 2019 & 2032
- Table 29: Global Telecom Service Assurance Market Revenue Million Forecast, by Component Type 2019 & 2032
- Table 30: Global Telecom Service Assurance Market Revenue Million Forecast, by Deployment Type 2019 & 2032
- Table 31: Global Telecom Service Assurance Market Revenue Million Forecast, by Country 2019 & 2032
- Table 32: Global Telecom Service Assurance Market Revenue Million Forecast, by Component Type 2019 & 2032
- Table 33: Global Telecom Service Assurance Market Revenue Million Forecast, by Deployment Type 2019 & 2032
- Table 34: Global Telecom Service Assurance Market Revenue Million Forecast, by Country 2019 & 2032
Frequently Asked Questions
1. What is the projected Compound Annual Growth Rate (CAGR) of the Telecom Service Assurance Market?
The projected CAGR is approximately 10.04%.
2. Which companies are prominent players in the Telecom Service Assurance Market?
Key companies in the market include Accenture PLC, IBM Corporation, Hewlett Packard Enterprise, Viavi Solutions Inc, Cisco Systems Inc, Tata Consultancy Services Limited, Telefonaktiebolaget LM Ericsso, NEC Corporation, Nokia Corporation, Broadcom Inc (CA Technologies Inc ).
3. What are the main segments of the Telecom Service Assurance Market?
The market segments include Component Type, Deployment Type.
4. Can you provide details about the market size?
The market size is estimated to be USD 11.13 Million as of 2022.
5. What are some drivers contributing to market growth?
Increasing Demand for Service Quality; Significant Increase in the Number of Cellular Subscribers; Rising Need for High Optimization and Increased Saving Costs.
6. What are the notable trends driving market growth?
Network Management System Expected to Witness Significant Growth.
7. Are there any restraints impacting market growth?
Data Privacy Concerns; Lack of Infrastructure in Emerging Economies.
8. Can you provide examples of recent developments in the market?
March 2024: ServiceNow deepened its collaboration with NVIDIA, focusing on delivering industry-specific GenAI for telcos. Their initial offering, called Now Assist for Telecommunications Service Management (TSM), harnesses NVIDIA AI on the Now Platform, streamlining AI-driven and automated processes, especially in critical telco use cases like network management assurance.
9. What pricing options are available for accessing the report?
Pricing options include single-user, multi-user, and enterprise licenses priced at USD 4750, USD 5250, and USD 8750 respectively.
10. Is the market size provided in terms of value or volume?
The market size is provided in terms of value, measured in Million.
11. Are there any specific market keywords associated with the report?
Yes, the market keyword associated with the report is "Telecom Service Assurance Market," which aids in identifying and referencing the specific market segment covered.
12. How do I determine which pricing option suits my needs best?
The pricing options vary based on user requirements and access needs. Individual users may opt for single-user licenses, while businesses requiring broader access may choose multi-user or enterprise licenses for cost-effective access to the report.
13. Are there any additional resources or data provided in the Telecom Service Assurance Market report?
While the report offers comprehensive insights, it's advisable to review the specific contents or supplementary materials provided to ascertain if additional resources or data are available.
14. How can I stay updated on further developments or reports in the Telecom Service Assurance Market?
To stay informed about further developments, trends, and reports in the Telecom Service Assurance Market, consider subscribing to industry newsletters, following relevant companies and organizations, or regularly checking reputable industry news sources and publications.
Methodology
Step 1 - Identification of Relevant Samples Size from Population Database


Step 2 - Approaches for Defining Global Market Size (Value, Volume* & Price*)

Note*: In applicable scenarios
Step 3 - Data Sources
Primary Research
- Web Analytics
- Survey Reports
- Research Institute
- Latest Research Reports
- Opinion Leaders
Secondary Research
- Annual Reports
- White Paper
- Latest Press Release
- Industry Association
- Paid Database
- Investor Presentations

Step 4 - Data Triangulation
Involves using different sources of information in order to increase the validity of a study
These sources are likely to be stakeholders in a program - participants, other researchers, program staff, other community members, and so on.
Then we put all data in single framework & apply various statistical tools to find out the dynamic on the market.
During the analysis stage, feedback from the stakeholder groups would be compared to determine areas of agreement as well as areas of divergence


