
Key Insights
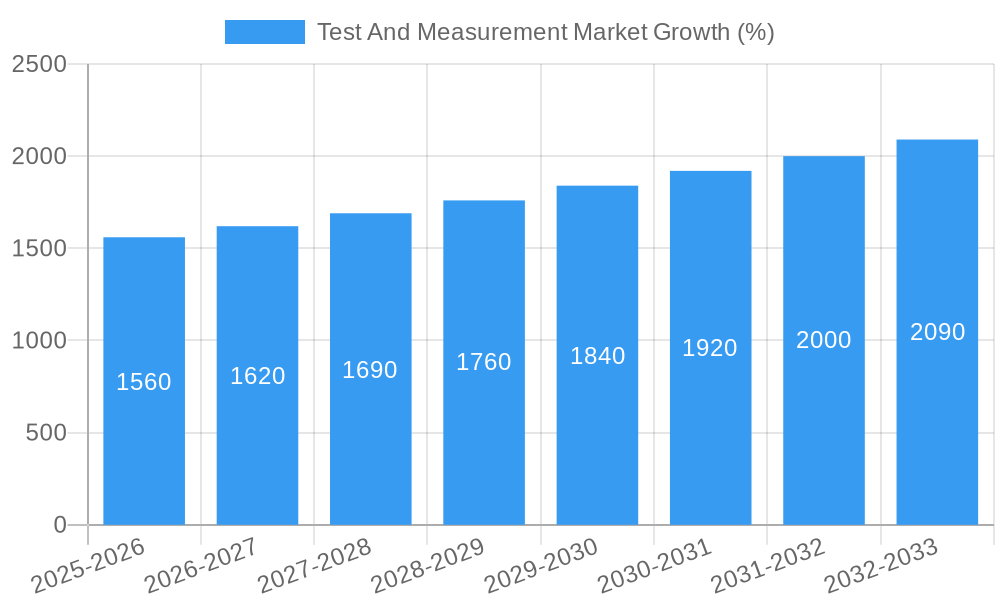
The Test and Measurement market is experiencing robust growth, projected to reach \$30.14 billion in 2025 and maintain a Compound Annual Growth Rate (CAGR) of 5.10% from 2025 to 2033. This expansion is driven by several key factors. The increasing adoption of automation and digitalization across various industries, particularly in electronics manufacturing, automotive, and telecommunications, fuels the demand for sophisticated test and measurement equipment. Furthermore, the rising need for quality assurance and product reliability, coupled with stringent regulatory compliance requirements, is driving investments in advanced testing solutions. The miniaturization of electronic components and the emergence of 5G and IoT technologies are also significant contributing factors, necessitating precise and efficient testing methodologies. Competition within the market is intense, with established players like National Instruments, Yokogawa Electric, and Keysight Technologies vying for market share alongside innovative smaller companies. Technological advancements, particularly in areas like AI-powered testing and cloud-based solutions, are reshaping the competitive landscape and presenting new opportunities for market entrants.
The market segmentation reveals a diverse landscape, with varying levels of growth across different equipment types and geographical regions. While precise segment-specific data is unavailable, it can be reasonably inferred that segments like electronic test equipment, optical instruments, and software-based testing solutions are experiencing above-average growth due to the trends mentioned earlier. Similarly, regions with robust manufacturing and technological hubs—such as North America, Europe, and Asia-Pacific— likely represent the largest market shares, although precise figures require further investigation. However, emerging economies in Asia and other regions also present significant growth potential, driven by increasing industrialization and infrastructure development. The continued emphasis on R&D within the test and measurement sector and the development of more sophisticated testing technologies suggest sustained market growth for the foreseeable future.

Test & Measurement Market: A Comprehensive Report (2019-2033)
This detailed report provides a comprehensive analysis of the Test & Measurement market, offering invaluable insights for industry stakeholders, investors, and strategic decision-makers. With a study period spanning 2019-2033, a base year of 2025, and a forecast period of 2025-2033, this report meticulously examines market dynamics, technological advancements, and competitive landscapes. The report’s value is further enhanced by incorporating real-world examples of recent industry developments, providing a tangible understanding of the market's evolution. Expected market size values (in Millions) are provided where data is available, otherwise estimations are used.
Test And Measurement Market Market Concentration & Innovation
The Test & Measurement market exhibits a moderately concentrated landscape, with several key players dominating significant market share. National Instruments Corporation, Keysight Technologies Inc, and Rohde & Schwarz GmbH & Co KG consistently hold leading positions. However, the market also features a number of smaller, specialized companies catering to niche segments. Innovation is a significant driver, with continuous advancements in technologies like artificial intelligence (AI), machine learning (ML), and automation impacting product development and market penetration. Regulatory frameworks, particularly those related to safety and standards compliance, play a crucial role in shaping market practices and product specifications. The existence of substitute technologies and the emergence of new materials impact market competition. End-user trends, particularly towards higher precision, faster testing speeds, and reduced testing times, are reshaping market demands. Mergers and acquisitions (M&A) are relatively frequent, with deal values varying depending on the size and strategic importance of the acquired companies. For example, a significant M&A deal in xx could represent xx Million, influencing market consolidation.
- Market Share (Estimated 2025): Keysight Technologies Inc (xx%), National Instruments Corporation (xx%), Rohde & Schwarz GmbH & Co KG (xx%), Others (xx%).
- M&A Activity (2019-2024): xx major acquisitions with a total estimated value of xx Million.
Test And Measurement Market Industry Trends & Insights
The Test & Measurement market is experiencing robust growth, driven by several factors. The increasing demand for higher-quality products across various industries, especially in electronics, automotive, and telecommunications, fuels the need for advanced testing and measurement solutions. Technological disruptions, such as the integration of AI and ML in test equipment, are transforming testing processes, enabling faster, more accurate, and automated testing. Consumer preferences are shifting towards more user-friendly, versatile, and cost-effective instruments. Competitive dynamics are intense, with companies continuously innovating to maintain a competitive edge and cater to evolving customer needs. The market is projected to witness a CAGR of xx% during the forecast period (2025-2033), with significant market penetration anticipated in emerging economies. The global market size is estimated to reach xx Million by 2033.
Dominant Markets & Segments in Test And Measurement Market
The North American region currently holds the largest market share in the Test & Measurement market, driven by factors including robust R&D investments, strong technological infrastructure, and a high concentration of key players. However, the Asia-Pacific region is poised for significant growth in the coming years, fueled by rapid industrialization, rising disposable incomes, and increasing adoption of advanced technologies. Europe also maintains a significant presence, benefiting from established industries and technological innovation.
- Key Drivers for North American Dominance:
- Strong R&D investments by leading companies.
- Well-developed technological infrastructure.
- High concentration of key players.
- Key Drivers for Asia-Pacific Growth:
- Rapid industrialization and economic growth.
- Increasing adoption of advanced technologies.
- Favorable government policies promoting technological advancement.
Test And Measurement Market Product Developments
Recent product innovations emphasize miniaturization, increased accuracy, and integration of advanced features like AI and machine learning. New applications are emerging across diverse sectors like automotive, aerospace, and renewable energy. The competitive advantages lie in offering superior accuracy, faster testing speeds, ease of use, and cost-effectiveness. Technological trends point towards wireless connectivity, cloud-based data analysis, and greater automation in testing processes. These advancements improve efficiency and allow for real-time data analysis, enhancing productivity and reliability of testing processes.
Report Scope & Segmentation Analysis
This report segments the Test & Measurement market based on product type (oscilloscope, spectrum analyzer, power meter, etc.), application (electronics, automotive, healthcare etc.), and geography. Each segment's market size, growth projections, and competitive dynamics are thoroughly analyzed. For example, the Oscilloscope segment is projected to experience significant growth due to increased demand in the electronics industry, while the Asia Pacific region is expected to exhibit higher growth rates compared to other regions. The competitive landscape within each segment is varied, with some segments being dominated by a few key players, while others show a more fragmented structure.
Key Drivers of Test And Measurement Market Growth
Several factors contribute to the Test & Measurement market's growth trajectory. Technological advancements, such as the introduction of high-speed digital oscilloscopes with enhanced bandwidth and AI-powered data analysis tools, increase testing capabilities. The robust growth of industries, including electronics, automotive, and telecommunications, fuels the demand for reliable testing and measurement equipment. Favorable government regulations, promoting the adoption of advanced technologies, create a supportive market environment. For instance, investments in infrastructure development in emerging economies further stimulate market growth.
Challenges in the Test And Measurement Market Sector
The Test & Measurement market faces challenges such as increasing raw material costs, causing fluctuations in product prices. Supply chain disruptions, especially those experienced in the recent years, can impact the availability of components. Intense competition among established players and new entrants necessitates continuous innovation to stay competitive. Strict regulatory compliance requirements necessitate investment in meeting standards, potentially raising operating costs. These combined factors can lead to decreased profitability for some market participants if not managed effectively.
Emerging Opportunities in Test And Measurement Market
Emerging opportunities exist in the development of specialized test equipment for niche applications, like the automotive sector’s increasing reliance on autonomous driving. The integration of 5G and IoT technologies expands opportunities for testing high-frequency signals and complex networks. There's also growth potential in developing cost-effective and user-friendly equipment for small and medium-sized enterprises (SMEs). The expansion into emerging economies, such as those in Africa and Latin America, presents significant untapped markets.
Leading Players in the Test And Measurement Market Market
- National Instruments Corporation
- Yokogawa Electric Corporation
- Rohde & Schwarz GmbH & Co KG
- Fortive Corp
- Advantest Corporation
- Keysight Technologies Inc
- Anritsu Corporation
- Teradyne Inc
- Accurex Measurement
- VIAVI Solutions Inc
Key Developments in Test And Measurement Market Industry
- June 2024: Accurex Measurement launched the LYNX2 visual inspection system, revolutionizing automated machine vision inspections in aerostructure manufacturing.
- March 2024: GW Instek unveiled the MPO-2000 series programmable oscilloscopes, integrating Python programming for advanced testing capabilities.
Strategic Outlook for Test And Measurement Market Market
The Test & Measurement market is projected to experience sustained growth, driven by technological advancements, increasing demand across various industries, and expansion into new markets. Opportunities abound in areas like AI-powered testing solutions, IoT-related testing, and specialized equipment for emerging technologies. Companies focusing on innovation, strategic partnerships, and efficient supply chain management are expected to gain a competitive advantage. The continued emphasis on improving accuracy, speed, and user-friendliness of testing equipment will remain a pivotal driver for market growth in the years ahead.
Test And Measurement Market Segmentation
-
1. Product
- 1.1. General Purpose Test Equipment (GPTE)
- 1.2. Mechanical Test Equipment (MTE)
-
2. Service Type
- 2.1. Calibration Services
- 2.2. Repair Services/After Sales Services
-
3. End-user Industry
- 3.1. Automotive and Transportation
- 3.2. Aerospace and Defense
- 3.3. IT and Telecommunication
- 3.4. Education
- 3.5. Semiconductor and Electronics
- 3.6. Other End-user Industries
Test And Measurement Market Segmentation By Geography
- 1. North America
- 2. Europe
- 3. Asia
- 4. Australia and New Zealand
- 5. Latin America
- 6. Middle East and Africa

Test And Measurement Market REPORT HIGHLIGHTS
| Aspects | Details |
|---|---|
| Study Period | 2019-2033 |
| Base Year | 2024 |
| Estimated Year | 2025 |
| Forecast Period | 2025-2033 |
| Historical Period | 2019-2024 |
| Growth Rate | CAGR of 5.10% from 2019-2033 |
| Segmentation |
|
Table of Contents
- 1. Introduction
- 1.1. Research Scope
- 1.2. Market Segmentation
- 1.3. Research Methodology
- 1.4. Definitions and Assumptions
- 2. Executive Summary
- 2.1. Introduction
- 3. Market Dynamics
- 3.1. Introduction
- 3.2. Market Drivers
- 3.2.1. Technological Advancements Leading to the Need for Test and Measurement Equipment; Emerging Trend of Electric and Hybrid Vehicle
- 3.3. Market Restrains
- 3.3.1. Technological Advancements Leading to the Need for Test and Measurement Equipment; Emerging Trend of Electric and Hybrid Vehicle
- 3.4. Market Trends
- 3.4.1. Semiconductor and Electronics Expected to Hold Major Major Market Share
- 4. Market Factor Analysis
- 4.1. Porters Five Forces
- 4.2. Supply/Value Chain
- 4.3. PESTEL analysis
- 4.4. Market Entropy
- 4.5. Patent/Trademark Analysis
- 5. Global Test And Measurement Market Analysis, Insights and Forecast, 2019-2031
- 5.1. Market Analysis, Insights and Forecast - by Product
- 5.1.1. General Purpose Test Equipment (GPTE)
- 5.1.2. Mechanical Test Equipment (MTE)
- 5.2. Market Analysis, Insights and Forecast - by Service Type
- 5.2.1. Calibration Services
- 5.2.2. Repair Services/After Sales Services
- 5.3. Market Analysis, Insights and Forecast - by End-user Industry
- 5.3.1. Automotive and Transportation
- 5.3.2. Aerospace and Defense
- 5.3.3. IT and Telecommunication
- 5.3.4. Education
- 5.3.5. Semiconductor and Electronics
- 5.3.6. Other End-user Industries
- 5.4. Market Analysis, Insights and Forecast - by Region
- 5.4.1. North America
- 5.4.2. Europe
- 5.4.3. Asia
- 5.4.4. Australia and New Zealand
- 5.4.5. Latin America
- 5.4.6. Middle East and Africa
- 5.1. Market Analysis, Insights and Forecast - by Product
- 6. North America Test And Measurement Market Analysis, Insights and Forecast, 2019-2031
- 6.1. Market Analysis, Insights and Forecast - by Product
- 6.1.1. General Purpose Test Equipment (GPTE)
- 6.1.2. Mechanical Test Equipment (MTE)
- 6.2. Market Analysis, Insights and Forecast - by Service Type
- 6.2.1. Calibration Services
- 6.2.2. Repair Services/After Sales Services
- 6.3. Market Analysis, Insights and Forecast - by End-user Industry
- 6.3.1. Automotive and Transportation
- 6.3.2. Aerospace and Defense
- 6.3.3. IT and Telecommunication
- 6.3.4. Education
- 6.3.5. Semiconductor and Electronics
- 6.3.6. Other End-user Industries
- 6.1. Market Analysis, Insights and Forecast - by Product
- 7. Europe Test And Measurement Market Analysis, Insights and Forecast, 2019-2031
- 7.1. Market Analysis, Insights and Forecast - by Product
- 7.1.1. General Purpose Test Equipment (GPTE)
- 7.1.2. Mechanical Test Equipment (MTE)
- 7.2. Market Analysis, Insights and Forecast - by Service Type
- 7.2.1. Calibration Services
- 7.2.2. Repair Services/After Sales Services
- 7.3. Market Analysis, Insights and Forecast - by End-user Industry
- 7.3.1. Automotive and Transportation
- 7.3.2. Aerospace and Defense
- 7.3.3. IT and Telecommunication
- 7.3.4. Education
- 7.3.5. Semiconductor and Electronics
- 7.3.6. Other End-user Industries
- 7.1. Market Analysis, Insights and Forecast - by Product
- 8. Asia Test And Measurement Market Analysis, Insights and Forecast, 2019-2031
- 8.1. Market Analysis, Insights and Forecast - by Product
- 8.1.1. General Purpose Test Equipment (GPTE)
- 8.1.2. Mechanical Test Equipment (MTE)
- 8.2. Market Analysis, Insights and Forecast - by Service Type
- 8.2.1. Calibration Services
- 8.2.2. Repair Services/After Sales Services
- 8.3. Market Analysis, Insights and Forecast - by End-user Industry
- 8.3.1. Automotive and Transportation
- 8.3.2. Aerospace and Defense
- 8.3.3. IT and Telecommunication
- 8.3.4. Education
- 8.3.5. Semiconductor and Electronics
- 8.3.6. Other End-user Industries
- 8.1. Market Analysis, Insights and Forecast - by Product
- 9. Australia and New Zealand Test And Measurement Market Analysis, Insights and Forecast, 2019-2031
- 9.1. Market Analysis, Insights and Forecast - by Product
- 9.1.1. General Purpose Test Equipment (GPTE)
- 9.1.2. Mechanical Test Equipment (MTE)
- 9.2. Market Analysis, Insights and Forecast - by Service Type
- 9.2.1. Calibration Services
- 9.2.2. Repair Services/After Sales Services
- 9.3. Market Analysis, Insights and Forecast - by End-user Industry
- 9.3.1. Automotive and Transportation
- 9.3.2. Aerospace and Defense
- 9.3.3. IT and Telecommunication
- 9.3.4. Education
- 9.3.5. Semiconductor and Electronics
- 9.3.6. Other End-user Industries
- 9.1. Market Analysis, Insights and Forecast - by Product
- 10. Latin America Test And Measurement Market Analysis, Insights and Forecast, 2019-2031
- 10.1. Market Analysis, Insights and Forecast - by Product
- 10.1.1. General Purpose Test Equipment (GPTE)
- 10.1.2. Mechanical Test Equipment (MTE)
- 10.2. Market Analysis, Insights and Forecast - by Service Type
- 10.2.1. Calibration Services
- 10.2.2. Repair Services/After Sales Services
- 10.3. Market Analysis, Insights and Forecast - by End-user Industry
- 10.3.1. Automotive and Transportation
- 10.3.2. Aerospace and Defense
- 10.3.3. IT and Telecommunication
- 10.3.4. Education
- 10.3.5. Semiconductor and Electronics
- 10.3.6. Other End-user Industries
- 10.1. Market Analysis, Insights and Forecast - by Product
- 11. Middle East and Africa Test And Measurement Market Analysis, Insights and Forecast, 2019-2031
- 11.1. Market Analysis, Insights and Forecast - by Product
- 11.1.1. General Purpose Test Equipment (GPTE)
- 11.1.2. Mechanical Test Equipment (MTE)
- 11.2. Market Analysis, Insights and Forecast - by Service Type
- 11.2.1. Calibration Services
- 11.2.2. Repair Services/After Sales Services
- 11.3. Market Analysis, Insights and Forecast - by End-user Industry
- 11.3.1. Automotive and Transportation
- 11.3.2. Aerospace and Defense
- 11.3.3. IT and Telecommunication
- 11.3.4. Education
- 11.3.5. Semiconductor and Electronics
- 11.3.6. Other End-user Industries
- 11.1. Market Analysis, Insights and Forecast - by Product
- 12. Competitive Analysis
- 12.1. Global Market Share Analysis 2024
- 12.2. Company Profiles
- 12.2.1 National Instruments Corporation
- 12.2.1.1. Overview
- 12.2.1.2. Products
- 12.2.1.3. SWOT Analysis
- 12.2.1.4. Recent Developments
- 12.2.1.5. Financials (Based on Availability)
- 12.2.2 Yokogawa Electric Corporation
- 12.2.2.1. Overview
- 12.2.2.2. Products
- 12.2.2.3. SWOT Analysis
- 12.2.2.4. Recent Developments
- 12.2.2.5. Financials (Based on Availability)
- 12.2.3 Rohde & Schwarz GmbH & Co KG
- 12.2.3.1. Overview
- 12.2.3.2. Products
- 12.2.3.3. SWOT Analysis
- 12.2.3.4. Recent Developments
- 12.2.3.5. Financials (Based on Availability)
- 12.2.4 Fortive Corp
- 12.2.4.1. Overview
- 12.2.4.2. Products
- 12.2.4.3. SWOT Analysis
- 12.2.4.4. Recent Developments
- 12.2.4.5. Financials (Based on Availability)
- 12.2.5 Advantest Corporation
- 12.2.5.1. Overview
- 12.2.5.2. Products
- 12.2.5.3. SWOT Analysis
- 12.2.5.4. Recent Developments
- 12.2.5.5. Financials (Based on Availability)
- 12.2.6 Keysight Technologies Inc
- 12.2.6.1. Overview
- 12.2.6.2. Products
- 12.2.6.3. SWOT Analysis
- 12.2.6.4. Recent Developments
- 12.2.6.5. Financials (Based on Availability)
- 12.2.7 Anritsu Corporation
- 12.2.7.1. Overview
- 12.2.7.2. Products
- 12.2.7.3. SWOT Analysis
- 12.2.7.4. Recent Developments
- 12.2.7.5. Financials (Based on Availability)
- 12.2.8 Teradyne Inc
- 12.2.8.1. Overview
- 12.2.8.2. Products
- 12.2.8.3. SWOT Analysis
- 12.2.8.4. Recent Developments
- 12.2.8.5. Financials (Based on Availability)
- 12.2.9 Accurex Measurement
- 12.2.9.1. Overview
- 12.2.9.2. Products
- 12.2.9.3. SWOT Analysis
- 12.2.9.4. Recent Developments
- 12.2.9.5. Financials (Based on Availability)
- 12.2.10 VIAVI Solutions Inc
- 12.2.10.1. Overview
- 12.2.10.2. Products
- 12.2.10.3. SWOT Analysis
- 12.2.10.4. Recent Developments
- 12.2.10.5. Financials (Based on Availability)
- 12.2.1 National Instruments Corporation
List of Figures
- Figure 1: Global Test And Measurement Market Revenue Breakdown (Million, %) by Region 2024 & 2032
- Figure 2: Global Test And Measurement Market Volume Breakdown (Billion, %) by Region 2024 & 2032
- Figure 3: North America Test And Measurement Market Revenue (Million), by Product 2024 & 2032
- Figure 4: North America Test And Measurement Market Volume (Billion), by Product 2024 & 2032
- Figure 5: North America Test And Measurement Market Revenue Share (%), by Product 2024 & 2032
- Figure 6: North America Test And Measurement Market Volume Share (%), by Product 2024 & 2032
- Figure 7: North America Test And Measurement Market Revenue (Million), by Service Type 2024 & 2032
- Figure 8: North America Test And Measurement Market Volume (Billion), by Service Type 2024 & 2032
- Figure 9: North America Test And Measurement Market Revenue Share (%), by Service Type 2024 & 2032
- Figure 10: North America Test And Measurement Market Volume Share (%), by Service Type 2024 & 2032
- Figure 11: North America Test And Measurement Market Revenue (Million), by End-user Industry 2024 & 2032
- Figure 12: North America Test And Measurement Market Volume (Billion), by End-user Industry 2024 & 2032
- Figure 13: North America Test And Measurement Market Revenue Share (%), by End-user Industry 2024 & 2032
- Figure 14: North America Test And Measurement Market Volume Share (%), by End-user Industry 2024 & 2032
- Figure 15: North America Test And Measurement Market Revenue (Million), by Country 2024 & 2032
- Figure 16: North America Test And Measurement Market Volume (Billion), by Country 2024 & 2032
- Figure 17: North America Test And Measurement Market Revenue Share (%), by Country 2024 & 2032
- Figure 18: North America Test And Measurement Market Volume Share (%), by Country 2024 & 2032
- Figure 19: Europe Test And Measurement Market Revenue (Million), by Product 2024 & 2032
- Figure 20: Europe Test And Measurement Market Volume (Billion), by Product 2024 & 2032
- Figure 21: Europe Test And Measurement Market Revenue Share (%), by Product 2024 & 2032
- Figure 22: Europe Test And Measurement Market Volume Share (%), by Product 2024 & 2032
- Figure 23: Europe Test And Measurement Market Revenue (Million), by Service Type 2024 & 2032
- Figure 24: Europe Test And Measurement Market Volume (Billion), by Service Type 2024 & 2032
- Figure 25: Europe Test And Measurement Market Revenue Share (%), by Service Type 2024 & 2032
- Figure 26: Europe Test And Measurement Market Volume Share (%), by Service Type 2024 & 2032
- Figure 27: Europe Test And Measurement Market Revenue (Million), by End-user Industry 2024 & 2032
- Figure 28: Europe Test And Measurement Market Volume (Billion), by End-user Industry 2024 & 2032
- Figure 29: Europe Test And Measurement Market Revenue Share (%), by End-user Industry 2024 & 2032
- Figure 30: Europe Test And Measurement Market Volume Share (%), by End-user Industry 2024 & 2032
- Figure 31: Europe Test And Measurement Market Revenue (Million), by Country 2024 & 2032
- Figure 32: Europe Test And Measurement Market Volume (Billion), by Country 2024 & 2032
- Figure 33: Europe Test And Measurement Market Revenue Share (%), by Country 2024 & 2032
- Figure 34: Europe Test And Measurement Market Volume Share (%), by Country 2024 & 2032
- Figure 35: Asia Test And Measurement Market Revenue (Million), by Product 2024 & 2032
- Figure 36: Asia Test And Measurement Market Volume (Billion), by Product 2024 & 2032
- Figure 37: Asia Test And Measurement Market Revenue Share (%), by Product 2024 & 2032
- Figure 38: Asia Test And Measurement Market Volume Share (%), by Product 2024 & 2032
- Figure 39: Asia Test And Measurement Market Revenue (Million), by Service Type 2024 & 2032
- Figure 40: Asia Test And Measurement Market Volume (Billion), by Service Type 2024 & 2032
- Figure 41: Asia Test And Measurement Market Revenue Share (%), by Service Type 2024 & 2032
- Figure 42: Asia Test And Measurement Market Volume Share (%), by Service Type 2024 & 2032
- Figure 43: Asia Test And Measurement Market Revenue (Million), by End-user Industry 2024 & 2032
- Figure 44: Asia Test And Measurement Market Volume (Billion), by End-user Industry 2024 & 2032
- Figure 45: Asia Test And Measurement Market Revenue Share (%), by End-user Industry 2024 & 2032
- Figure 46: Asia Test And Measurement Market Volume Share (%), by End-user Industry 2024 & 2032
- Figure 47: Asia Test And Measurement Market Revenue (Million), by Country 2024 & 2032
- Figure 48: Asia Test And Measurement Market Volume (Billion), by Country 2024 & 2032
- Figure 49: Asia Test And Measurement Market Revenue Share (%), by Country 2024 & 2032
- Figure 50: Asia Test And Measurement Market Volume Share (%), by Country 2024 & 2032
- Figure 51: Australia and New Zealand Test And Measurement Market Revenue (Million), by Product 2024 & 2032
- Figure 52: Australia and New Zealand Test And Measurement Market Volume (Billion), by Product 2024 & 2032
- Figure 53: Australia and New Zealand Test And Measurement Market Revenue Share (%), by Product 2024 & 2032
- Figure 54: Australia and New Zealand Test And Measurement Market Volume Share (%), by Product 2024 & 2032
- Figure 55: Australia and New Zealand Test And Measurement Market Revenue (Million), by Service Type 2024 & 2032
- Figure 56: Australia and New Zealand Test And Measurement Market Volume (Billion), by Service Type 2024 & 2032
- Figure 57: Australia and New Zealand Test And Measurement Market Revenue Share (%), by Service Type 2024 & 2032
- Figure 58: Australia and New Zealand Test And Measurement Market Volume Share (%), by Service Type 2024 & 2032
- Figure 59: Australia and New Zealand Test And Measurement Market Revenue (Million), by End-user Industry 2024 & 2032
- Figure 60: Australia and New Zealand Test And Measurement Market Volume (Billion), by End-user Industry 2024 & 2032
- Figure 61: Australia and New Zealand Test And Measurement Market Revenue Share (%), by End-user Industry 2024 & 2032
- Figure 62: Australia and New Zealand Test And Measurement Market Volume Share (%), by End-user Industry 2024 & 2032
- Figure 63: Australia and New Zealand Test And Measurement Market Revenue (Million), by Country 2024 & 2032
- Figure 64: Australia and New Zealand Test And Measurement Market Volume (Billion), by Country 2024 & 2032
- Figure 65: Australia and New Zealand Test And Measurement Market Revenue Share (%), by Country 2024 & 2032
- Figure 66: Australia and New Zealand Test And Measurement Market Volume Share (%), by Country 2024 & 2032
- Figure 67: Latin America Test And Measurement Market Revenue (Million), by Product 2024 & 2032
- Figure 68: Latin America Test And Measurement Market Volume (Billion), by Product 2024 & 2032
- Figure 69: Latin America Test And Measurement Market Revenue Share (%), by Product 2024 & 2032
- Figure 70: Latin America Test And Measurement Market Volume Share (%), by Product 2024 & 2032
- Figure 71: Latin America Test And Measurement Market Revenue (Million), by Service Type 2024 & 2032
- Figure 72: Latin America Test And Measurement Market Volume (Billion), by Service Type 2024 & 2032
- Figure 73: Latin America Test And Measurement Market Revenue Share (%), by Service Type 2024 & 2032
- Figure 74: Latin America Test And Measurement Market Volume Share (%), by Service Type 2024 & 2032
- Figure 75: Latin America Test And Measurement Market Revenue (Million), by End-user Industry 2024 & 2032
- Figure 76: Latin America Test And Measurement Market Volume (Billion), by End-user Industry 2024 & 2032
- Figure 77: Latin America Test And Measurement Market Revenue Share (%), by End-user Industry 2024 & 2032
- Figure 78: Latin America Test And Measurement Market Volume Share (%), by End-user Industry 2024 & 2032
- Figure 79: Latin America Test And Measurement Market Revenue (Million), by Country 2024 & 2032
- Figure 80: Latin America Test And Measurement Market Volume (Billion), by Country 2024 & 2032
- Figure 81: Latin America Test And Measurement Market Revenue Share (%), by Country 2024 & 2032
- Figure 82: Latin America Test And Measurement Market Volume Share (%), by Country 2024 & 2032
- Figure 83: Middle East and Africa Test And Measurement Market Revenue (Million), by Product 2024 & 2032
- Figure 84: Middle East and Africa Test And Measurement Market Volume (Billion), by Product 2024 & 2032
- Figure 85: Middle East and Africa Test And Measurement Market Revenue Share (%), by Product 2024 & 2032
- Figure 86: Middle East and Africa Test And Measurement Market Volume Share (%), by Product 2024 & 2032
- Figure 87: Middle East and Africa Test And Measurement Market Revenue (Million), by Service Type 2024 & 2032
- Figure 88: Middle East and Africa Test And Measurement Market Volume (Billion), by Service Type 2024 & 2032
- Figure 89: Middle East and Africa Test And Measurement Market Revenue Share (%), by Service Type 2024 & 2032
- Figure 90: Middle East and Africa Test And Measurement Market Volume Share (%), by Service Type 2024 & 2032
- Figure 91: Middle East and Africa Test And Measurement Market Revenue (Million), by End-user Industry 2024 & 2032
- Figure 92: Middle East and Africa Test And Measurement Market Volume (Billion), by End-user Industry 2024 & 2032
- Figure 93: Middle East and Africa Test And Measurement Market Revenue Share (%), by End-user Industry 2024 & 2032
- Figure 94: Middle East and Africa Test And Measurement Market Volume Share (%), by End-user Industry 2024 & 2032
- Figure 95: Middle East and Africa Test And Measurement Market Revenue (Million), by Country 2024 & 2032
- Figure 96: Middle East and Africa Test And Measurement Market Volume (Billion), by Country 2024 & 2032
- Figure 97: Middle East and Africa Test And Measurement Market Revenue Share (%), by Country 2024 & 2032
- Figure 98: Middle East and Africa Test And Measurement Market Volume Share (%), by Country 2024 & 2032
List of Tables
- Table 1: Global Test And Measurement Market Revenue Million Forecast, by Region 2019 & 2032
- Table 2: Global Test And Measurement Market Volume Billion Forecast, by Region 2019 & 2032
- Table 3: Global Test And Measurement Market Revenue Million Forecast, by Product 2019 & 2032
- Table 4: Global Test And Measurement Market Volume Billion Forecast, by Product 2019 & 2032
- Table 5: Global Test And Measurement Market Revenue Million Forecast, by Service Type 2019 & 2032
- Table 6: Global Test And Measurement Market Volume Billion Forecast, by Service Type 2019 & 2032
- Table 7: Global Test And Measurement Market Revenue Million Forecast, by End-user Industry 2019 & 2032
- Table 8: Global Test And Measurement Market Volume Billion Forecast, by End-user Industry 2019 & 2032
- Table 9: Global Test And Measurement Market Revenue Million Forecast, by Region 2019 & 2032
- Table 10: Global Test And Measurement Market Volume Billion Forecast, by Region 2019 & 2032
- Table 11: Global Test And Measurement Market Revenue Million Forecast, by Product 2019 & 2032
- Table 12: Global Test And Measurement Market Volume Billion Forecast, by Product 2019 & 2032
- Table 13: Global Test And Measurement Market Revenue Million Forecast, by Service Type 2019 & 2032
- Table 14: Global Test And Measurement Market Volume Billion Forecast, by Service Type 2019 & 2032
- Table 15: Global Test And Measurement Market Revenue Million Forecast, by End-user Industry 2019 & 2032
- Table 16: Global Test And Measurement Market Volume Billion Forecast, by End-user Industry 2019 & 2032
- Table 17: Global Test And Measurement Market Revenue Million Forecast, by Country 2019 & 2032
- Table 18: Global Test And Measurement Market Volume Billion Forecast, by Country 2019 & 2032
- Table 19: Global Test And Measurement Market Revenue Million Forecast, by Product 2019 & 2032
- Table 20: Global Test And Measurement Market Volume Billion Forecast, by Product 2019 & 2032
- Table 21: Global Test And Measurement Market Revenue Million Forecast, by Service Type 2019 & 2032
- Table 22: Global Test And Measurement Market Volume Billion Forecast, by Service Type 2019 & 2032
- Table 23: Global Test And Measurement Market Revenue Million Forecast, by End-user Industry 2019 & 2032
- Table 24: Global Test And Measurement Market Volume Billion Forecast, by End-user Industry 2019 & 2032
- Table 25: Global Test And Measurement Market Revenue Million Forecast, by Country 2019 & 2032
- Table 26: Global Test And Measurement Market Volume Billion Forecast, by Country 2019 & 2032
- Table 27: Global Test And Measurement Market Revenue Million Forecast, by Product 2019 & 2032
- Table 28: Global Test And Measurement Market Volume Billion Forecast, by Product 2019 & 2032
- Table 29: Global Test And Measurement Market Revenue Million Forecast, by Service Type 2019 & 2032
- Table 30: Global Test And Measurement Market Volume Billion Forecast, by Service Type 2019 & 2032
- Table 31: Global Test And Measurement Market Revenue Million Forecast, by End-user Industry 2019 & 2032
- Table 32: Global Test And Measurement Market Volume Billion Forecast, by End-user Industry 2019 & 2032
- Table 33: Global Test And Measurement Market Revenue Million Forecast, by Country 2019 & 2032
- Table 34: Global Test And Measurement Market Volume Billion Forecast, by Country 2019 & 2032
- Table 35: Global Test And Measurement Market Revenue Million Forecast, by Product 2019 & 2032
- Table 36: Global Test And Measurement Market Volume Billion Forecast, by Product 2019 & 2032
- Table 37: Global Test And Measurement Market Revenue Million Forecast, by Service Type 2019 & 2032
- Table 38: Global Test And Measurement Market Volume Billion Forecast, by Service Type 2019 & 2032
- Table 39: Global Test And Measurement Market Revenue Million Forecast, by End-user Industry 2019 & 2032
- Table 40: Global Test And Measurement Market Volume Billion Forecast, by End-user Industry 2019 & 2032
- Table 41: Global Test And Measurement Market Revenue Million Forecast, by Country 2019 & 2032
- Table 42: Global Test And Measurement Market Volume Billion Forecast, by Country 2019 & 2032
- Table 43: Global Test And Measurement Market Revenue Million Forecast, by Product 2019 & 2032
- Table 44: Global Test And Measurement Market Volume Billion Forecast, by Product 2019 & 2032
- Table 45: Global Test And Measurement Market Revenue Million Forecast, by Service Type 2019 & 2032
- Table 46: Global Test And Measurement Market Volume Billion Forecast, by Service Type 2019 & 2032
- Table 47: Global Test And Measurement Market Revenue Million Forecast, by End-user Industry 2019 & 2032
- Table 48: Global Test And Measurement Market Volume Billion Forecast, by End-user Industry 2019 & 2032
- Table 49: Global Test And Measurement Market Revenue Million Forecast, by Country 2019 & 2032
- Table 50: Global Test And Measurement Market Volume Billion Forecast, by Country 2019 & 2032
- Table 51: Global Test And Measurement Market Revenue Million Forecast, by Product 2019 & 2032
- Table 52: Global Test And Measurement Market Volume Billion Forecast, by Product 2019 & 2032
- Table 53: Global Test And Measurement Market Revenue Million Forecast, by Service Type 2019 & 2032
- Table 54: Global Test And Measurement Market Volume Billion Forecast, by Service Type 2019 & 2032
- Table 55: Global Test And Measurement Market Revenue Million Forecast, by End-user Industry 2019 & 2032
- Table 56: Global Test And Measurement Market Volume Billion Forecast, by End-user Industry 2019 & 2032
- Table 57: Global Test And Measurement Market Revenue Million Forecast, by Country 2019 & 2032
- Table 58: Global Test And Measurement Market Volume Billion Forecast, by Country 2019 & 2032
Frequently Asked Questions
1. What is the projected Compound Annual Growth Rate (CAGR) of the Test And Measurement Market?
The projected CAGR is approximately 5.10%.
2. Which companies are prominent players in the Test And Measurement Market?
Key companies in the market include National Instruments Corporation, Yokogawa Electric Corporation, Rohde & Schwarz GmbH & Co KG, Fortive Corp, Advantest Corporation, Keysight Technologies Inc, Anritsu Corporation, Teradyne Inc, Accurex Measurement, VIAVI Solutions Inc.
3. What are the main segments of the Test And Measurement Market?
The market segments include Product, Service Type, End-user Industry.
4. Can you provide details about the market size?
The market size is estimated to be USD 30.14 Million as of 2022.
5. What are some drivers contributing to market growth?
Technological Advancements Leading to the Need for Test and Measurement Equipment; Emerging Trend of Electric and Hybrid Vehicle.
6. What are the notable trends driving market growth?
Semiconductor and Electronics Expected to Hold Major Major Market Share.
7. Are there any restraints impacting market growth?
Technological Advancements Leading to the Need for Test and Measurement Equipment; Emerging Trend of Electric and Hybrid Vehicle.
8. Can you provide examples of recent developments in the market?
June 2024: Accurex Measurement unveiled its latest innovation, the LYNX2 visual inspection system. Aptly named for its advanced capabilities and feline-like precision, the LYNX2 seeks to revolutionize automated machine vision inspections in the manufacturing of aerostructures and other sizable assemblies. Equipped with a high-resolution camera, optical zoom, and a digital projector, the LYNX2 captures intricate images to identify manufacturing discrepancies. Its articulating field of vision enables it to scrutinize thousands of components on products extending up to 10 meters in length.
9. What pricing options are available for accessing the report?
Pricing options include single-user, multi-user, and enterprise licenses priced at USD 4750, USD 5250, and USD 8750 respectively.
10. Is the market size provided in terms of value or volume?
The market size is provided in terms of value, measured in Million and volume, measured in Billion.
11. Are there any specific market keywords associated with the report?
Yes, the market keyword associated with the report is "Test And Measurement Market," which aids in identifying and referencing the specific market segment covered.
12. How do I determine which pricing option suits my needs best?
The pricing options vary based on user requirements and access needs. Individual users may opt for single-user licenses, while businesses requiring broader access may choose multi-user or enterprise licenses for cost-effective access to the report.
13. Are there any additional resources or data provided in the Test And Measurement Market report?
While the report offers comprehensive insights, it's advisable to review the specific contents or supplementary materials provided to ascertain if additional resources or data are available.
14. How can I stay updated on further developments or reports in the Test And Measurement Market?
To stay informed about further developments, trends, and reports in the Test And Measurement Market, consider subscribing to industry newsletters, following relevant companies and organizations, or regularly checking reputable industry news sources and publications.
Methodology
Step 1 - Identification of Relevant Samples Size from Population Database


Step 2 - Approaches for Defining Global Market Size (Value, Volume* & Price*)

Note*: In applicable scenarios
Step 3 - Data Sources
Primary Research
- Web Analytics
- Survey Reports
- Research Institute
- Latest Research Reports
- Opinion Leaders
Secondary Research
- Annual Reports
- White Paper
- Latest Press Release
- Industry Association
- Paid Database
- Investor Presentations

Step 4 - Data Triangulation
Involves using different sources of information in order to increase the validity of a study
These sources are likely to be stakeholders in a program - participants, other researchers, program staff, other community members, and so on.
Then we put all data in single framework & apply various statistical tools to find out the dynamic on the market.
During the analysis stage, feedback from the stakeholder groups would be compared to determine areas of agreement as well as areas of divergence


