
Key Insights
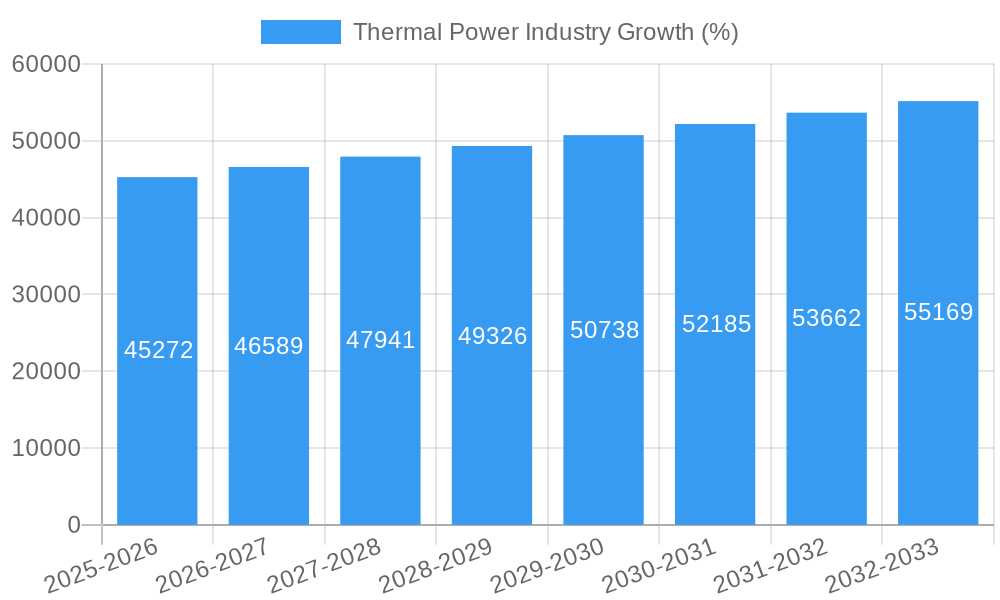
The global thermal power industry, valued at $1,475.40 billion in 2025, is projected to experience steady growth, driven primarily by consistent energy demand in developing economies and the established infrastructure supporting coal and gas-fired plants. A Compound Annual Growth Rate (CAGR) of 3% from 2025 to 2033 indicates a gradual expansion, influenced by factors such as increasing urbanization and industrialization. However, this growth is tempered by rising concerns regarding greenhouse gas emissions and the global push towards renewable energy sources. The industry is actively diversifying, with a focus on cleaner technologies within thermal generation, such as advanced coal combustion and combined cycle gas turbines, aimed at improving efficiency and reducing emissions. Government regulations and environmental policies play a significant role in shaping the industry's trajectory, impacting investments and technological advancements. The market segmentation reveals a substantial reliance on coal and gas, although the share of nuclear and other renewable thermal sources (like geothermal) is expected to gradually increase due to stricter emission standards and a growing awareness of environmental sustainability. Key players, including Iberdrola, EDF, Siemens, and others, are strategizing to navigate the evolving landscape by investing in both traditional thermal plants and exploring cleaner technologies, ensuring their long-term viability in a decarbonizing world.
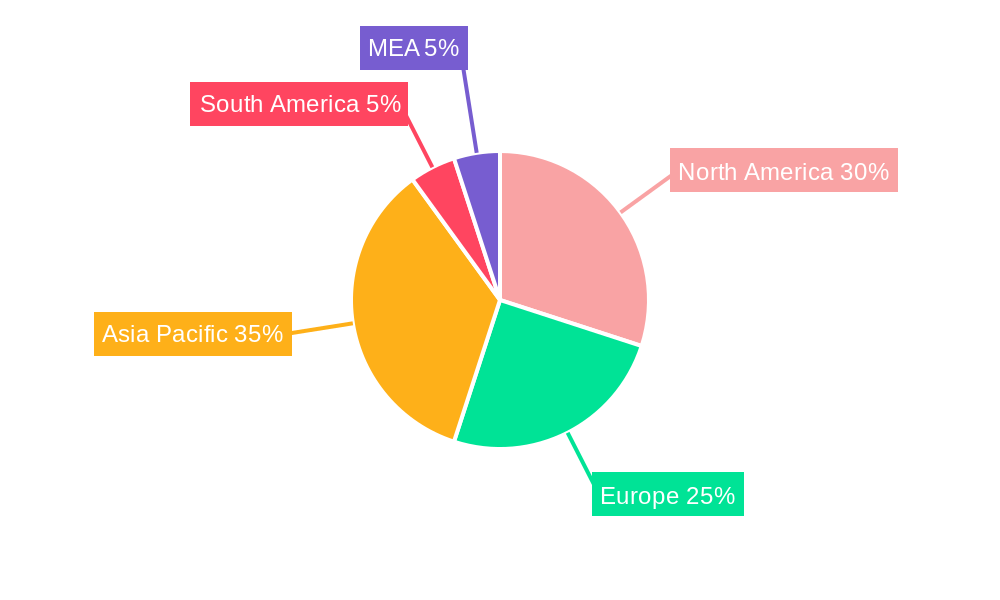
The regional distribution of the thermal power market reflects varying levels of industrialization and energy consumption patterns. North America and Asia-Pacific are anticipated to dominate, owing to their large economies and substantial energy demands. Europe, while having a more established renewable energy sector, will likely maintain a significant share, driven by the continued reliance on gas-fired power plants during the energy transition. Emerging markets in regions like South America and the Middle East and Africa show potential for growth, albeit at a slower pace compared to more developed regions, largely due to infrastructural limitations and economic factors. Competitive pressures are intense, with established players facing competition from both emerging thermal power companies and the increasing prominence of renewable energy providers. Technological innovation focused on carbon capture, utilization, and storage (CCUS) will likely become increasingly important in the future for ensuring the continued relevance of thermal power generation in a sustainable energy mix.

Thermal Power Industry: A Comprehensive Market Analysis (2019-2033)
This in-depth report provides a comprehensive analysis of the global thermal power industry, offering invaluable insights for stakeholders across the value chain. The study covers the period from 2019 to 2033, with a focus on the forecast period 2025-2033, using 2025 as the base and estimated year. The report leverages robust data and methodologies to deliver actionable intelligence, enabling informed decision-making and strategic planning. The global thermal power market is projected to reach USD xx Billion by 2033, exhibiting a CAGR of xx% during the forecast period.
Thermal Power Industry Market Concentration & Innovation
The thermal power industry exhibits a moderately concentrated market structure, with a few major players holding significant market share. Companies like Iberdrola S.A., Electricite de France S.A., Siemens AG, Tokyo Electric Power Company, ENGIE, National Thermal Power Corporation Limited, General Electric Company, Chubu Electric Power Co Inc, ABB, and Bharat Heavy Electricals Limited (BHEL) dominate the landscape. However, the market is dynamic, with ongoing mergers and acquisitions (M&A) reshaping the competitive landscape. Recent M&A activity has involved deal values totaling USD xx Billion, primarily driven by strategies to consolidate market share and access new technologies.
Market share is unevenly distributed, with the top five players accounting for approximately xx% of the global market. Innovation is driven by the need for increased efficiency, reduced emissions, and enhanced reliability. Stringent environmental regulations are a key catalyst for innovation, pushing companies to adopt cleaner technologies and fuels. The industry also faces pressure from substitute technologies, including renewable energy sources, which are increasingly competitive in certain regions. End-user trends towards sustainable energy solutions further impact market dynamics.
Thermal Power Industry Industry Trends & Insights
The thermal power industry is experiencing a period of significant transformation, influenced by several key trends. Market growth is driven primarily by increasing energy demand in developing economies, particularly in Asia and Africa. However, this growth is tempered by the increasing adoption of renewable energy sources and stricter environmental regulations. The CAGR for the industry during the forecast period is projected to be xx%, with market penetration steadily increasing in emerging markets. Technological disruptions, such as the development of advanced combustion technologies and carbon capture and storage (CCS) solutions, are reshaping the industry landscape. Consumer preferences are shifting towards cleaner energy sources, putting pressure on thermal power companies to reduce their environmental impact. Competitive dynamics are intensified by the entrance of new players offering innovative technologies and business models. The industry is witnessing a gradual shift towards decentralized power generation and smart grids, enhancing efficiency and reliability.
Dominant Markets & Segments in Thermal Power Industry
Coal remains the dominant fuel type in the thermal power industry, holding approximately xx% of the market share in 2025. This dominance is primarily concentrated in Asia, particularly in China and India, driven by robust economic growth and substantial coal reserves. Key drivers include readily available and relatively low-cost coal resources, established infrastructure, and supportive government policies. However, stricter environmental regulations are gradually shifting the balance towards natural gas and other cleaner fuel sources.
- Coal: Abundant reserves, established infrastructure, cost-effectiveness.
- Gas: Increasingly attractive due to lower emissions compared to coal, better efficiency, and government incentives.
- Nuclear: Significant role in certain regions due to high power output and low greenhouse gas emissions, but safety concerns and high capital costs hinder wider adoption.
- Others: This segment includes biomass, geothermal, and solar thermal technologies, with growth driven by government incentives, improving technology, and environmental concerns. These segments are gaining traction due to increased awareness of sustainability.
The dominance of coal is expected to decline gradually over the forecast period due to environmental concerns and the rising cost of compliance with emission regulations. Natural gas is anticipated to experience significant growth, driven by its relatively lower emissions compared to coal and supportive government policies in many regions.
Thermal Power Industry Product Developments
Recent product innovations focus on enhancing efficiency, reducing emissions, and improving reliability. Advanced combustion technologies, such as supercritical and ultra-supercritical boilers, are being deployed to improve thermal efficiency. Carbon capture and storage (CCS) solutions are gaining traction as a means of mitigating greenhouse gas emissions. The integration of smart grid technologies is improving grid management and enhancing the overall reliability of the power system. These advancements improve the market fit by addressing the growing concerns around sustainability and increasing the operational efficiency of thermal power plants.
Report Scope & Segmentation Analysis
This report segments the thermal power market based on fuel type: Coal, Gas, Nuclear, and Others. Each segment is analyzed in detail, covering market size, growth projections, and competitive dynamics. The Coal segment, currently the largest, is expected to see moderate growth, while the Gas segment is projected to experience faster growth due to its relatively cleaner profile. The Nuclear segment holds a stable market share, but its growth is limited by safety concerns and regulatory hurdles. The “Others” segment, comprising renewable thermal technologies, is poised for substantial growth due to rising environmental awareness and supportive government policies. Each segment's growth trajectory is deeply intertwined with regional policy, technological advancements, and international collaborations.
Key Drivers of Thermal Power Industry Growth
The growth of the thermal power industry is driven by several key factors. Firstly, the increasing global energy demand, especially in developing economies, fuels the need for reliable and affordable electricity. Secondly, the relatively lower initial cost compared to renewable energy sources makes thermal power attractive, particularly in regions with abundant fossil fuel resources. Thirdly, technological advancements in efficiency and emissions reduction technologies are making thermal power a more sustainable option. Government policies supporting energy security also play a vital role in driving the growth of this industry.
Challenges in the Thermal Power Industry Sector
The thermal power industry faces numerous challenges, including increasingly stringent environmental regulations that necessitate expensive upgrades and compliance measures. The fluctuating prices of fossil fuels pose significant risks to profitability, and supply chain disruptions can impact operations. Intense competition from renewable energy sources also poses a major threat, further exacerbated by the pressure to achieve carbon neutrality. These challenges impose significant financial burdens on the industry, necessitating strategic adaptation and technological innovation.
Emerging Opportunities in Thermal Power Industry
Despite the challenges, the thermal power industry presents several promising opportunities. The development of advanced technologies, such as CCS and hydrogen-based power generation, offers pathways to reduce emissions and enhance sustainability. The integration of smart grid technologies can improve operational efficiency and reliability. Furthermore, exploring new markets in developing economies with growing energy needs and favorable government policies presents substantial growth potential.
Leading Players in the Thermal Power Industry Market
- Iberdrola S A
- Electricite de France S A
- Siemens AG
- Tokyo Electric Power Company
- ENGIE
- National Thermal Power Corporation Limited
- General Electric Company
- Chubu Electric Power Co Inc
- ABB
- Bharat Heavy Electricals Limited (BHEL)
Key Developments in Thermal Power Industry Industry
- 2020: Several major thermal power companies announced investments in CCS technologies.
- 2021: Stricter emission standards were implemented in several countries, leading to plant closures and upgrades.
- 2022: Significant mergers and acquisitions took place, reshaping the industry landscape.
- 2023: Increased focus on the development of hydrogen-based power generation.
- Ongoing: Continuous development of more efficient and cleaner thermal power technologies.
Strategic Outlook for Thermal Power Industry Market
The future of the thermal power industry is inextricably linked to the global transition towards cleaner energy sources. While the industry will continue to play a vital role in meeting global energy demands, it must adapt by investing in cleaner technologies, improving efficiency, and addressing environmental concerns. The market's long-term growth hinges on its ability to balance energy security with sustainability goals. Opportunities lie in leveraging advanced technologies and collaborating on innovative solutions to minimize environmental impact.
Thermal Power Industry Segmentation
-
1. Fuel Type
- 1.1. Coal
- 1.2. Gas
- 1.3. Nuclear
- 1.4. Others
Thermal Power Industry Segmentation By Geography
- 1. North America
- 2. Asia Pacific
- 3. Europe
- 4. South America
- 5. Middle East and Africa
Thermal Power Industry REPORT HIGHLIGHTS
| Aspects | Details |
|---|---|
| Study Period | 2019-2033 |
| Base Year | 2024 |
| Estimated Year | 2025 |
| Forecast Period | 2025-2033 |
| Historical Period | 2019-2024 |
| Growth Rate | CAGR of 3% from 2019-2033 |
| Segmentation |
|
Table of Contents
- 1. Introduction
- 1.1. Research Scope
- 1.2. Market Segmentation
- 1.3. Research Methodology
- 1.4. Definitions and Assumptions
- 2. Executive Summary
- 2.1. Introduction
- 3. Market Dynamics
- 3.1. Introduction
- 3.2. Market Drivers
- 3.2.1. 4.; Increasing investment in the Midstream Sector4.; Increasing Production of Oil and Natural Gas
- 3.3. Market Restrains
- 3.3.1. 4.; Inadequate Infrastructure in the Country
- 3.4. Market Trends
- 3.4.1. Natural Gas Power Plants to Witness Significant Growth
- 4. Market Factor Analysis
- 4.1. Porters Five Forces
- 4.2. Supply/Value Chain
- 4.3. PESTEL analysis
- 4.4. Market Entropy
- 4.5. Patent/Trademark Analysis
- 5. Global Thermal Power Industry Analysis, Insights and Forecast, 2019-2031
- 5.1. Market Analysis, Insights and Forecast - by Fuel Type
- 5.1.1. Coal
- 5.1.2. Gas
- 5.1.3. Nuclear
- 5.1.4. Others
- 5.2. Market Analysis, Insights and Forecast - by Region
- 5.2.1. North America
- 5.2.2. Asia Pacific
- 5.2.3. Europe
- 5.2.4. South America
- 5.2.5. Middle East and Africa
- 5.1. Market Analysis, Insights and Forecast - by Fuel Type
- 6. North America Thermal Power Industry Analysis, Insights and Forecast, 2019-2031
- 6.1. Market Analysis, Insights and Forecast - by Fuel Type
- 6.1.1. Coal
- 6.1.2. Gas
- 6.1.3. Nuclear
- 6.1.4. Others
- 6.1. Market Analysis, Insights and Forecast - by Fuel Type
- 7. Asia Pacific Thermal Power Industry Analysis, Insights and Forecast, 2019-2031
- 7.1. Market Analysis, Insights and Forecast - by Fuel Type
- 7.1.1. Coal
- 7.1.2. Gas
- 7.1.3. Nuclear
- 7.1.4. Others
- 7.1. Market Analysis, Insights and Forecast - by Fuel Type
- 8. Europe Thermal Power Industry Analysis, Insights and Forecast, 2019-2031
- 8.1. Market Analysis, Insights and Forecast - by Fuel Type
- 8.1.1. Coal
- 8.1.2. Gas
- 8.1.3. Nuclear
- 8.1.4. Others
- 8.1. Market Analysis, Insights and Forecast - by Fuel Type
- 9. South America Thermal Power Industry Analysis, Insights and Forecast, 2019-2031
- 9.1. Market Analysis, Insights and Forecast - by Fuel Type
- 9.1.1. Coal
- 9.1.2. Gas
- 9.1.3. Nuclear
- 9.1.4. Others
- 9.1. Market Analysis, Insights and Forecast - by Fuel Type
- 10. Middle East and Africa Thermal Power Industry Analysis, Insights and Forecast, 2019-2031
- 10.1. Market Analysis, Insights and Forecast - by Fuel Type
- 10.1.1. Coal
- 10.1.2. Gas
- 10.1.3. Nuclear
- 10.1.4. Others
- 10.1. Market Analysis, Insights and Forecast - by Fuel Type
- 11. North America Thermal Power Industry Analysis, Insights and Forecast, 2019-2031
- 11.1. Market Analysis, Insights and Forecast - By Country/Sub-region
- 11.1.1 United States
- 11.1.2 Canada
- 11.1.3 Mexico
- 12. Europe Thermal Power Industry Analysis, Insights and Forecast, 2019-2031
- 12.1. Market Analysis, Insights and Forecast - By Country/Sub-region
- 12.1.1 Germany
- 12.1.2 United Kingdom
- 12.1.3 France
- 12.1.4 Spain
- 12.1.5 Italy
- 12.1.6 Spain
- 12.1.7 Belgium
- 12.1.8 Netherland
- 12.1.9 Nordics
- 12.1.10 Rest of Europe
- 13. Asia Pacific Thermal Power Industry Analysis, Insights and Forecast, 2019-2031
- 13.1. Market Analysis, Insights and Forecast - By Country/Sub-region
- 13.1.1 China
- 13.1.2 Japan
- 13.1.3 India
- 13.1.4 South Korea
- 13.1.5 Southeast Asia
- 13.1.6 Australia
- 13.1.7 Indonesia
- 13.1.8 Phillipes
- 13.1.9 Singapore
- 13.1.10 Thailandc
- 13.1.11 Rest of Asia Pacific
- 14. South America Thermal Power Industry Analysis, Insights and Forecast, 2019-2031
- 14.1. Market Analysis, Insights and Forecast - By Country/Sub-region
- 14.1.1 Brazil
- 14.1.2 Argentina
- 14.1.3 Peru
- 14.1.4 Chile
- 14.1.5 Colombia
- 14.1.6 Ecuador
- 14.1.7 Venezuela
- 14.1.8 Rest of South America
- 15. North America Thermal Power Industry Analysis, Insights and Forecast, 2019-2031
- 15.1. Market Analysis, Insights and Forecast - By Country/Sub-region
- 15.1.1 United States
- 15.1.2 Canada
- 15.1.3 Mexico
- 16. MEA Thermal Power Industry Analysis, Insights and Forecast, 2019-2031
- 16.1. Market Analysis, Insights and Forecast - By Country/Sub-region
- 16.1.1 United Arab Emirates
- 16.1.2 Saudi Arabia
- 16.1.3 South Africa
- 16.1.4 Rest of Middle East and Africa
- 17. Competitive Analysis
- 17.1. Global Market Share Analysis 2024
- 17.2. Company Profiles
- 17.2.1 Iberdrola S A
- 17.2.1.1. Overview
- 17.2.1.2. Products
- 17.2.1.3. SWOT Analysis
- 17.2.1.4. Recent Developments
- 17.2.1.5. Financials (Based on Availability)
- 17.2.2 Electricite de France S A
- 17.2.2.1. Overview
- 17.2.2.2. Products
- 17.2.2.3. SWOT Analysis
- 17.2.2.4. Recent Developments
- 17.2.2.5. Financials (Based on Availability)
- 17.2.3 Siemens AG
- 17.2.3.1. Overview
- 17.2.3.2. Products
- 17.2.3.3. SWOT Analysis
- 17.2.3.4. Recent Developments
- 17.2.3.5. Financials (Based on Availability)
- 17.2.4 Tokyo Electric Power Company*List Not Exhaustive
- 17.2.4.1. Overview
- 17.2.4.2. Products
- 17.2.4.3. SWOT Analysis
- 17.2.4.4. Recent Developments
- 17.2.4.5. Financials (Based on Availability)
- 17.2.5 ENGIE
- 17.2.5.1. Overview
- 17.2.5.2. Products
- 17.2.5.3. SWOT Analysis
- 17.2.5.4. Recent Developments
- 17.2.5.5. Financials (Based on Availability)
- 17.2.6 National Thermal Power Corporation Limited
- 17.2.6.1. Overview
- 17.2.6.2. Products
- 17.2.6.3. SWOT Analysis
- 17.2.6.4. Recent Developments
- 17.2.6.5. Financials (Based on Availability)
- 17.2.7 General Electric Company
- 17.2.7.1. Overview
- 17.2.7.2. Products
- 17.2.7.3. SWOT Analysis
- 17.2.7.4. Recent Developments
- 17.2.7.5. Financials (Based on Availability)
- 17.2.8 Chubu Electric Power Co Inc
- 17.2.8.1. Overview
- 17.2.8.2. Products
- 17.2.8.3. SWOT Analysis
- 17.2.8.4. Recent Developments
- 17.2.8.5. Financials (Based on Availability)
- 17.2.9 ABB
- 17.2.9.1. Overview
- 17.2.9.2. Products
- 17.2.9.3. SWOT Analysis
- 17.2.9.4. Recent Developments
- 17.2.9.5. Financials (Based on Availability)
- 17.2.10 Bharat Heavy Electricals Limited (BHEL)
- 17.2.10.1. Overview
- 17.2.10.2. Products
- 17.2.10.3. SWOT Analysis
- 17.2.10.4. Recent Developments
- 17.2.10.5. Financials (Based on Availability)
- 17.2.1 Iberdrola S A
List of Figures
- Figure 1: Global Thermal Power Industry Revenue Breakdown (USD Billion, %) by Region 2024 & 2032
- Figure 2: Global Thermal Power Industry Volume Breakdown (Megawatt, %) by Region 2024 & 2032
- Figure 3: North America Thermal Power Industry Revenue (USD Billion), by Country 2024 & 2032
- Figure 4: North America Thermal Power Industry Volume (Megawatt), by Country 2024 & 2032
- Figure 5: North America Thermal Power Industry Revenue Share (%), by Country 2024 & 2032
- Figure 6: North America Thermal Power Industry Volume Share (%), by Country 2024 & 2032
- Figure 7: Europe Thermal Power Industry Revenue (USD Billion), by Country 2024 & 2032
- Figure 8: Europe Thermal Power Industry Volume (Megawatt), by Country 2024 & 2032
- Figure 9: Europe Thermal Power Industry Revenue Share (%), by Country 2024 & 2032
- Figure 10: Europe Thermal Power Industry Volume Share (%), by Country 2024 & 2032
- Figure 11: Asia Pacific Thermal Power Industry Revenue (USD Billion), by Country 2024 & 2032
- Figure 12: Asia Pacific Thermal Power Industry Volume (Megawatt), by Country 2024 & 2032
- Figure 13: Asia Pacific Thermal Power Industry Revenue Share (%), by Country 2024 & 2032
- Figure 14: Asia Pacific Thermal Power Industry Volume Share (%), by Country 2024 & 2032
- Figure 15: South America Thermal Power Industry Revenue (USD Billion), by Country 2024 & 2032
- Figure 16: South America Thermal Power Industry Volume (Megawatt), by Country 2024 & 2032
- Figure 17: South America Thermal Power Industry Revenue Share (%), by Country 2024 & 2032
- Figure 18: South America Thermal Power Industry Volume Share (%), by Country 2024 & 2032
- Figure 19: North America Thermal Power Industry Revenue (USD Billion), by Country 2024 & 2032
- Figure 20: North America Thermal Power Industry Volume (Megawatt), by Country 2024 & 2032
- Figure 21: North America Thermal Power Industry Revenue Share (%), by Country 2024 & 2032
- Figure 22: North America Thermal Power Industry Volume Share (%), by Country 2024 & 2032
- Figure 23: MEA Thermal Power Industry Revenue (USD Billion), by Country 2024 & 2032
- Figure 24: MEA Thermal Power Industry Volume (Megawatt), by Country 2024 & 2032
- Figure 25: MEA Thermal Power Industry Revenue Share (%), by Country 2024 & 2032
- Figure 26: MEA Thermal Power Industry Volume Share (%), by Country 2024 & 2032
- Figure 27: North America Thermal Power Industry Revenue (USD Billion), by Fuel Type 2024 & 2032
- Figure 28: North America Thermal Power Industry Volume (Megawatt), by Fuel Type 2024 & 2032
- Figure 29: North America Thermal Power Industry Revenue Share (%), by Fuel Type 2024 & 2032
- Figure 30: North America Thermal Power Industry Volume Share (%), by Fuel Type 2024 & 2032
- Figure 31: North America Thermal Power Industry Revenue (USD Billion), by Country 2024 & 2032
- Figure 32: North America Thermal Power Industry Volume (Megawatt), by Country 2024 & 2032
- Figure 33: North America Thermal Power Industry Revenue Share (%), by Country 2024 & 2032
- Figure 34: North America Thermal Power Industry Volume Share (%), by Country 2024 & 2032
- Figure 35: Asia Pacific Thermal Power Industry Revenue (USD Billion), by Fuel Type 2024 & 2032
- Figure 36: Asia Pacific Thermal Power Industry Volume (Megawatt), by Fuel Type 2024 & 2032
- Figure 37: Asia Pacific Thermal Power Industry Revenue Share (%), by Fuel Type 2024 & 2032
- Figure 38: Asia Pacific Thermal Power Industry Volume Share (%), by Fuel Type 2024 & 2032
- Figure 39: Asia Pacific Thermal Power Industry Revenue (USD Billion), by Country 2024 & 2032
- Figure 40: Asia Pacific Thermal Power Industry Volume (Megawatt), by Country 2024 & 2032
- Figure 41: Asia Pacific Thermal Power Industry Revenue Share (%), by Country 2024 & 2032
- Figure 42: Asia Pacific Thermal Power Industry Volume Share (%), by Country 2024 & 2032
- Figure 43: Europe Thermal Power Industry Revenue (USD Billion), by Fuel Type 2024 & 2032
- Figure 44: Europe Thermal Power Industry Volume (Megawatt), by Fuel Type 2024 & 2032
- Figure 45: Europe Thermal Power Industry Revenue Share (%), by Fuel Type 2024 & 2032
- Figure 46: Europe Thermal Power Industry Volume Share (%), by Fuel Type 2024 & 2032
- Figure 47: Europe Thermal Power Industry Revenue (USD Billion), by Country 2024 & 2032
- Figure 48: Europe Thermal Power Industry Volume (Megawatt), by Country 2024 & 2032
- Figure 49: Europe Thermal Power Industry Revenue Share (%), by Country 2024 & 2032
- Figure 50: Europe Thermal Power Industry Volume Share (%), by Country 2024 & 2032
- Figure 51: South America Thermal Power Industry Revenue (USD Billion), by Fuel Type 2024 & 2032
- Figure 52: South America Thermal Power Industry Volume (Megawatt), by Fuel Type 2024 & 2032
- Figure 53: South America Thermal Power Industry Revenue Share (%), by Fuel Type 2024 & 2032
- Figure 54: South America Thermal Power Industry Volume Share (%), by Fuel Type 2024 & 2032
- Figure 55: South America Thermal Power Industry Revenue (USD Billion), by Country 2024 & 2032
- Figure 56: South America Thermal Power Industry Volume (Megawatt), by Country 2024 & 2032
- Figure 57: South America Thermal Power Industry Revenue Share (%), by Country 2024 & 2032
- Figure 58: South America Thermal Power Industry Volume Share (%), by Country 2024 & 2032
- Figure 59: Middle East and Africa Thermal Power Industry Revenue (USD Billion), by Fuel Type 2024 & 2032
- Figure 60: Middle East and Africa Thermal Power Industry Volume (Megawatt), by Fuel Type 2024 & 2032
- Figure 61: Middle East and Africa Thermal Power Industry Revenue Share (%), by Fuel Type 2024 & 2032
- Figure 62: Middle East and Africa Thermal Power Industry Volume Share (%), by Fuel Type 2024 & 2032
- Figure 63: Middle East and Africa Thermal Power Industry Revenue (USD Billion), by Country 2024 & 2032
- Figure 64: Middle East and Africa Thermal Power Industry Volume (Megawatt), by Country 2024 & 2032
- Figure 65: Middle East and Africa Thermal Power Industry Revenue Share (%), by Country 2024 & 2032
- Figure 66: Middle East and Africa Thermal Power Industry Volume Share (%), by Country 2024 & 2032
List of Tables
- Table 1: Global Thermal Power Industry Revenue USD Billion Forecast, by Region 2019 & 2032
- Table 2: Global Thermal Power Industry Volume Megawatt Forecast, by Region 2019 & 2032
- Table 3: Global Thermal Power Industry Revenue USD Billion Forecast, by Fuel Type 2019 & 2032
- Table 4: Global Thermal Power Industry Volume Megawatt Forecast, by Fuel Type 2019 & 2032
- Table 5: Global Thermal Power Industry Revenue USD Billion Forecast, by Region 2019 & 2032
- Table 6: Global Thermal Power Industry Volume Megawatt Forecast, by Region 2019 & 2032
- Table 7: Global Thermal Power Industry Revenue USD Billion Forecast, by Country 2019 & 2032
- Table 8: Global Thermal Power Industry Volume Megawatt Forecast, by Country 2019 & 2032
- Table 9: United States Thermal Power Industry Revenue (USD Billion) Forecast, by Application 2019 & 2032
- Table 10: United States Thermal Power Industry Volume (Megawatt) Forecast, by Application 2019 & 2032
- Table 11: Canada Thermal Power Industry Revenue (USD Billion) Forecast, by Application 2019 & 2032
- Table 12: Canada Thermal Power Industry Volume (Megawatt) Forecast, by Application 2019 & 2032
- Table 13: Mexico Thermal Power Industry Revenue (USD Billion) Forecast, by Application 2019 & 2032
- Table 14: Mexico Thermal Power Industry Volume (Megawatt) Forecast, by Application 2019 & 2032
- Table 15: Global Thermal Power Industry Revenue USD Billion Forecast, by Country 2019 & 2032
- Table 16: Global Thermal Power Industry Volume Megawatt Forecast, by Country 2019 & 2032
- Table 17: Germany Thermal Power Industry Revenue (USD Billion) Forecast, by Application 2019 & 2032
- Table 18: Germany Thermal Power Industry Volume (Megawatt) Forecast, by Application 2019 & 2032
- Table 19: United Kingdom Thermal Power Industry Revenue (USD Billion) Forecast, by Application 2019 & 2032
- Table 20: United Kingdom Thermal Power Industry Volume (Megawatt) Forecast, by Application 2019 & 2032
- Table 21: France Thermal Power Industry Revenue (USD Billion) Forecast, by Application 2019 & 2032
- Table 22: France Thermal Power Industry Volume (Megawatt) Forecast, by Application 2019 & 2032
- Table 23: Spain Thermal Power Industry Revenue (USD Billion) Forecast, by Application 2019 & 2032
- Table 24: Spain Thermal Power Industry Volume (Megawatt) Forecast, by Application 2019 & 2032
- Table 25: Italy Thermal Power Industry Revenue (USD Billion) Forecast, by Application 2019 & 2032
- Table 26: Italy Thermal Power Industry Volume (Megawatt) Forecast, by Application 2019 & 2032
- Table 27: Spain Thermal Power Industry Revenue (USD Billion) Forecast, by Application 2019 & 2032
- Table 28: Spain Thermal Power Industry Volume (Megawatt) Forecast, by Application 2019 & 2032
- Table 29: Belgium Thermal Power Industry Revenue (USD Billion) Forecast, by Application 2019 & 2032
- Table 30: Belgium Thermal Power Industry Volume (Megawatt) Forecast, by Application 2019 & 2032
- Table 31: Netherland Thermal Power Industry Revenue (USD Billion) Forecast, by Application 2019 & 2032
- Table 32: Netherland Thermal Power Industry Volume (Megawatt) Forecast, by Application 2019 & 2032
- Table 33: Nordics Thermal Power Industry Revenue (USD Billion) Forecast, by Application 2019 & 2032
- Table 34: Nordics Thermal Power Industry Volume (Megawatt) Forecast, by Application 2019 & 2032
- Table 35: Rest of Europe Thermal Power Industry Revenue (USD Billion) Forecast, by Application 2019 & 2032
- Table 36: Rest of Europe Thermal Power Industry Volume (Megawatt) Forecast, by Application 2019 & 2032
- Table 37: Global Thermal Power Industry Revenue USD Billion Forecast, by Country 2019 & 2032
- Table 38: Global Thermal Power Industry Volume Megawatt Forecast, by Country 2019 & 2032
- Table 39: China Thermal Power Industry Revenue (USD Billion) Forecast, by Application 2019 & 2032
- Table 40: China Thermal Power Industry Volume (Megawatt) Forecast, by Application 2019 & 2032
- Table 41: Japan Thermal Power Industry Revenue (USD Billion) Forecast, by Application 2019 & 2032
- Table 42: Japan Thermal Power Industry Volume (Megawatt) Forecast, by Application 2019 & 2032
- Table 43: India Thermal Power Industry Revenue (USD Billion) Forecast, by Application 2019 & 2032
- Table 44: India Thermal Power Industry Volume (Megawatt) Forecast, by Application 2019 & 2032
- Table 45: South Korea Thermal Power Industry Revenue (USD Billion) Forecast, by Application 2019 & 2032
- Table 46: South Korea Thermal Power Industry Volume (Megawatt) Forecast, by Application 2019 & 2032
- Table 47: Southeast Asia Thermal Power Industry Revenue (USD Billion) Forecast, by Application 2019 & 2032
- Table 48: Southeast Asia Thermal Power Industry Volume (Megawatt) Forecast, by Application 2019 & 2032
- Table 49: Australia Thermal Power Industry Revenue (USD Billion) Forecast, by Application 2019 & 2032
- Table 50: Australia Thermal Power Industry Volume (Megawatt) Forecast, by Application 2019 & 2032
- Table 51: Indonesia Thermal Power Industry Revenue (USD Billion) Forecast, by Application 2019 & 2032
- Table 52: Indonesia Thermal Power Industry Volume (Megawatt) Forecast, by Application 2019 & 2032
- Table 53: Phillipes Thermal Power Industry Revenue (USD Billion) Forecast, by Application 2019 & 2032
- Table 54: Phillipes Thermal Power Industry Volume (Megawatt) Forecast, by Application 2019 & 2032
- Table 55: Singapore Thermal Power Industry Revenue (USD Billion) Forecast, by Application 2019 & 2032
- Table 56: Singapore Thermal Power Industry Volume (Megawatt) Forecast, by Application 2019 & 2032
- Table 57: Thailandc Thermal Power Industry Revenue (USD Billion) Forecast, by Application 2019 & 2032
- Table 58: Thailandc Thermal Power Industry Volume (Megawatt) Forecast, by Application 2019 & 2032
- Table 59: Rest of Asia Pacific Thermal Power Industry Revenue (USD Billion) Forecast, by Application 2019 & 2032
- Table 60: Rest of Asia Pacific Thermal Power Industry Volume (Megawatt) Forecast, by Application 2019 & 2032
- Table 61: Global Thermal Power Industry Revenue USD Billion Forecast, by Country 2019 & 2032
- Table 62: Global Thermal Power Industry Volume Megawatt Forecast, by Country 2019 & 2032
- Table 63: Brazil Thermal Power Industry Revenue (USD Billion) Forecast, by Application 2019 & 2032
- Table 64: Brazil Thermal Power Industry Volume (Megawatt) Forecast, by Application 2019 & 2032
- Table 65: Argentina Thermal Power Industry Revenue (USD Billion) Forecast, by Application 2019 & 2032
- Table 66: Argentina Thermal Power Industry Volume (Megawatt) Forecast, by Application 2019 & 2032
- Table 67: Peru Thermal Power Industry Revenue (USD Billion) Forecast, by Application 2019 & 2032
- Table 68: Peru Thermal Power Industry Volume (Megawatt) Forecast, by Application 2019 & 2032
- Table 69: Chile Thermal Power Industry Revenue (USD Billion) Forecast, by Application 2019 & 2032
- Table 70: Chile Thermal Power Industry Volume (Megawatt) Forecast, by Application 2019 & 2032
- Table 71: Colombia Thermal Power Industry Revenue (USD Billion) Forecast, by Application 2019 & 2032
- Table 72: Colombia Thermal Power Industry Volume (Megawatt) Forecast, by Application 2019 & 2032
- Table 73: Ecuador Thermal Power Industry Revenue (USD Billion) Forecast, by Application 2019 & 2032
- Table 74: Ecuador Thermal Power Industry Volume (Megawatt) Forecast, by Application 2019 & 2032
- Table 75: Venezuela Thermal Power Industry Revenue (USD Billion) Forecast, by Application 2019 & 2032
- Table 76: Venezuela Thermal Power Industry Volume (Megawatt) Forecast, by Application 2019 & 2032
- Table 77: Rest of South America Thermal Power Industry Revenue (USD Billion) Forecast, by Application 2019 & 2032
- Table 78: Rest of South America Thermal Power Industry Volume (Megawatt) Forecast, by Application 2019 & 2032
- Table 79: Global Thermal Power Industry Revenue USD Billion Forecast, by Country 2019 & 2032
- Table 80: Global Thermal Power Industry Volume Megawatt Forecast, by Country 2019 & 2032
- Table 81: United States Thermal Power Industry Revenue (USD Billion) Forecast, by Application 2019 & 2032
- Table 82: United States Thermal Power Industry Volume (Megawatt) Forecast, by Application 2019 & 2032
- Table 83: Canada Thermal Power Industry Revenue (USD Billion) Forecast, by Application 2019 & 2032
- Table 84: Canada Thermal Power Industry Volume (Megawatt) Forecast, by Application 2019 & 2032
- Table 85: Mexico Thermal Power Industry Revenue (USD Billion) Forecast, by Application 2019 & 2032
- Table 86: Mexico Thermal Power Industry Volume (Megawatt) Forecast, by Application 2019 & 2032
- Table 87: Global Thermal Power Industry Revenue USD Billion Forecast, by Country 2019 & 2032
- Table 88: Global Thermal Power Industry Volume Megawatt Forecast, by Country 2019 & 2032
- Table 89: United Arab Emirates Thermal Power Industry Revenue (USD Billion) Forecast, by Application 2019 & 2032
- Table 90: United Arab Emirates Thermal Power Industry Volume (Megawatt) Forecast, by Application 2019 & 2032
- Table 91: Saudi Arabia Thermal Power Industry Revenue (USD Billion) Forecast, by Application 2019 & 2032
- Table 92: Saudi Arabia Thermal Power Industry Volume (Megawatt) Forecast, by Application 2019 & 2032
- Table 93: South Africa Thermal Power Industry Revenue (USD Billion) Forecast, by Application 2019 & 2032
- Table 94: South Africa Thermal Power Industry Volume (Megawatt) Forecast, by Application 2019 & 2032
- Table 95: Rest of Middle East and Africa Thermal Power Industry Revenue (USD Billion) Forecast, by Application 2019 & 2032
- Table 96: Rest of Middle East and Africa Thermal Power Industry Volume (Megawatt) Forecast, by Application 2019 & 2032
- Table 97: Global Thermal Power Industry Revenue USD Billion Forecast, by Fuel Type 2019 & 2032
- Table 98: Global Thermal Power Industry Volume Megawatt Forecast, by Fuel Type 2019 & 2032
- Table 99: Global Thermal Power Industry Revenue USD Billion Forecast, by Country 2019 & 2032
- Table 100: Global Thermal Power Industry Volume Megawatt Forecast, by Country 2019 & 2032
- Table 101: Global Thermal Power Industry Revenue USD Billion Forecast, by Fuel Type 2019 & 2032
- Table 102: Global Thermal Power Industry Volume Megawatt Forecast, by Fuel Type 2019 & 2032
- Table 103: Global Thermal Power Industry Revenue USD Billion Forecast, by Country 2019 & 2032
- Table 104: Global Thermal Power Industry Volume Megawatt Forecast, by Country 2019 & 2032
- Table 105: Global Thermal Power Industry Revenue USD Billion Forecast, by Fuel Type 2019 & 2032
- Table 106: Global Thermal Power Industry Volume Megawatt Forecast, by Fuel Type 2019 & 2032
- Table 107: Global Thermal Power Industry Revenue USD Billion Forecast, by Country 2019 & 2032
- Table 108: Global Thermal Power Industry Volume Megawatt Forecast, by Country 2019 & 2032
- Table 109: Global Thermal Power Industry Revenue USD Billion Forecast, by Fuel Type 2019 & 2032
- Table 110: Global Thermal Power Industry Volume Megawatt Forecast, by Fuel Type 2019 & 2032
- Table 111: Global Thermal Power Industry Revenue USD Billion Forecast, by Country 2019 & 2032
- Table 112: Global Thermal Power Industry Volume Megawatt Forecast, by Country 2019 & 2032
- Table 113: Global Thermal Power Industry Revenue USD Billion Forecast, by Fuel Type 2019 & 2032
- Table 114: Global Thermal Power Industry Volume Megawatt Forecast, by Fuel Type 2019 & 2032
- Table 115: Global Thermal Power Industry Revenue USD Billion Forecast, by Country 2019 & 2032
- Table 116: Global Thermal Power Industry Volume Megawatt Forecast, by Country 2019 & 2032
Frequently Asked Questions
1. What is the projected Compound Annual Growth Rate (CAGR) of the Thermal Power Industry?
The projected CAGR is approximately 3%.
2. Which companies are prominent players in the Thermal Power Industry?
Key companies in the market include Iberdrola S A, Electricite de France S A, Siemens AG, Tokyo Electric Power Company*List Not Exhaustive, ENGIE, National Thermal Power Corporation Limited, General Electric Company, Chubu Electric Power Co Inc, ABB , Bharat Heavy Electricals Limited (BHEL).
3. What are the main segments of the Thermal Power Industry?
The market segments include Fuel Type.
4. Can you provide details about the market size?
The market size is estimated to be USD 1,475.40 USD Billion as of 2022.
5. What are some drivers contributing to market growth?
4.; Increasing investment in the Midstream Sector4.; Increasing Production of Oil and Natural Gas.
6. What are the notable trends driving market growth?
Natural Gas Power Plants to Witness Significant Growth.
7. Are there any restraints impacting market growth?
4.; Inadequate Infrastructure in the Country.
8. Can you provide examples of recent developments in the market?
The development of new, more efficient thermal power technologies
9. What pricing options are available for accessing the report?
Pricing options include single-user, multi-user, and enterprise licenses priced at USD 4750, USD 5250, and USD 8750 respectively.
10. Is the market size provided in terms of value or volume?
The market size is provided in terms of value, measured in USD Billion and volume, measured in Megawatt.
11. Are there any specific market keywords associated with the report?
Yes, the market keyword associated with the report is "Thermal Power Industry," which aids in identifying and referencing the specific market segment covered.
12. How do I determine which pricing option suits my needs best?
The pricing options vary based on user requirements and access needs. Individual users may opt for single-user licenses, while businesses requiring broader access may choose multi-user or enterprise licenses for cost-effective access to the report.
13. Are there any additional resources or data provided in the Thermal Power Industry report?
While the report offers comprehensive insights, it's advisable to review the specific contents or supplementary materials provided to ascertain if additional resources or data are available.
14. How can I stay updated on further developments or reports in the Thermal Power Industry?
To stay informed about further developments, trends, and reports in the Thermal Power Industry, consider subscribing to industry newsletters, following relevant companies and organizations, or regularly checking reputable industry news sources and publications.
Methodology
Step 1 - Identification of Relevant Samples Size from Population Database


Step 2 - Approaches for Defining Global Market Size (Value, Volume* & Price*)

Note*: In applicable scenarios
Step 3 - Data Sources
Primary Research
- Web Analytics
- Survey Reports
- Research Institute
- Latest Research Reports
- Opinion Leaders
Secondary Research
- Annual Reports
- White Paper
- Latest Press Release
- Industry Association
- Paid Database
- Investor Presentations

Step 4 - Data Triangulation
Involves using different sources of information in order to increase the validity of a study
These sources are likely to be stakeholders in a program - participants, other researchers, program staff, other community members, and so on.
Then we put all data in single framework & apply various statistical tools to find out the dynamic on the market.
During the analysis stage, feedback from the stakeholder groups would be compared to determine areas of agreement as well as areas of divergence


