
Key Insights
The global connected toys market, valued at $34.52 billion in 2025, is projected to experience robust growth, driven by several key factors. Technological advancements, particularly in areas like artificial intelligence (AI), augmented reality (AR), and improved connectivity (Wi-Fi, Bluetooth, NFC), are enhancing the interactive and educational capabilities of toys. This is leading to increased demand for sophisticated, digitally-enabled play experiences that engage children for longer periods and foster learning through play. The rising penetration of smartphones and tablets, particularly among younger demographics, further fuels market expansion, as these devices serve as crucial interfaces for connected toys. Parents' growing awareness of the educational benefits of technology-integrated toys and a willingness to invest in enriching playtime also contribute significantly to market growth. The market is segmented by technology (Wi-Fi, Bluetooth, NFC/RFID), distribution channel (online, specialty, convenience stores), and interfacing devices (smartphones, tablets, consoles). While online stores are currently dominant, the growth of omnichannel strategies is expected to broaden distribution avenues. Key players like Mattel, Lego, and Sega Toys are investing heavily in R&D to innovate and capture market share, resulting in a competitive landscape characterized by continuous product launches and strategic partnerships.
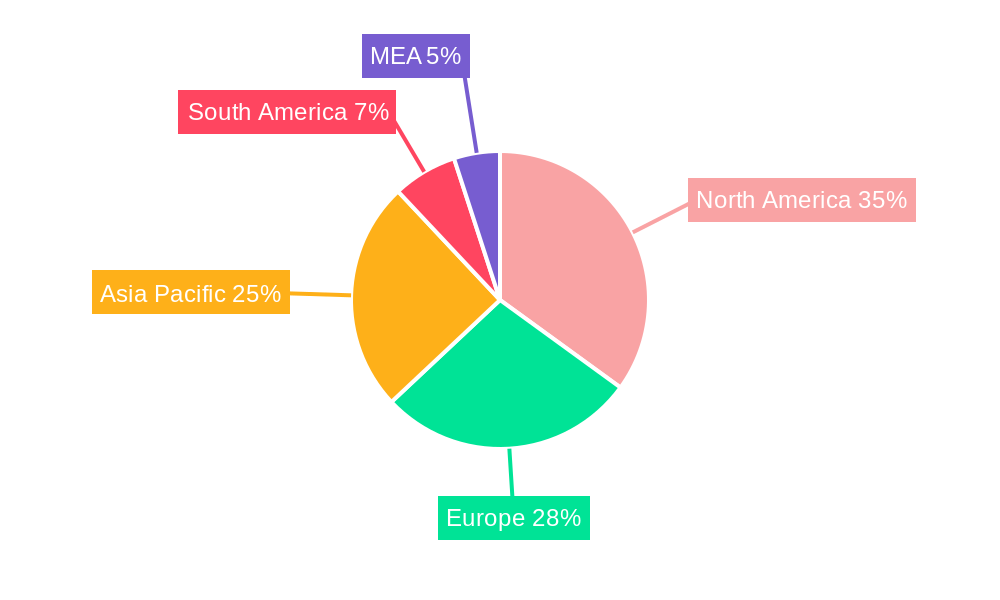
However, challenges remain. Pricing considerations can be a barrier to entry for some consumers, particularly in developing economies. Concerns about children's screen time and potential data privacy issues related to connected toys pose significant restraints. Furthermore, ensuring the robustness and security of connected toys to protect against cyber threats is crucial for maintaining consumer confidence and driving sustained market growth. The market's future trajectory will largely depend on effective addressing of these challenges while capitalizing on emerging technological innovations and expanding into new geographical markets. The Asia-Pacific region, with its large and growing child population, is expected to witness particularly strong growth in the coming years. This is due to a combination of rising disposable incomes, increasing internet penetration and adoption of smart devices. North America is also a key market and will continue its significant market presence.
Toys Industry Market Report: 2019-2033
This comprehensive report provides a detailed analysis of the global toys industry, offering invaluable insights for stakeholders seeking to navigate this dynamic market. Covering the period from 2019 to 2033, with a focus on 2025, this report examines market concentration, innovation, trends, dominant segments, and key players, projecting future growth and highlighting emerging opportunities. The report utilizes a robust methodology, incorporating both historical data (2019-2024) and forecast data (2025-2033), delivering actionable intelligence to support informed decision-making. The global toys market is projected to reach xx Million by 2033.
Toys Industry Market Concentration & Innovation
This section analyzes the competitive landscape of the toys industry, examining market concentration, innovation drivers, regulatory frameworks, product substitutes, end-user trends, and merger & acquisition (M&A) activities.
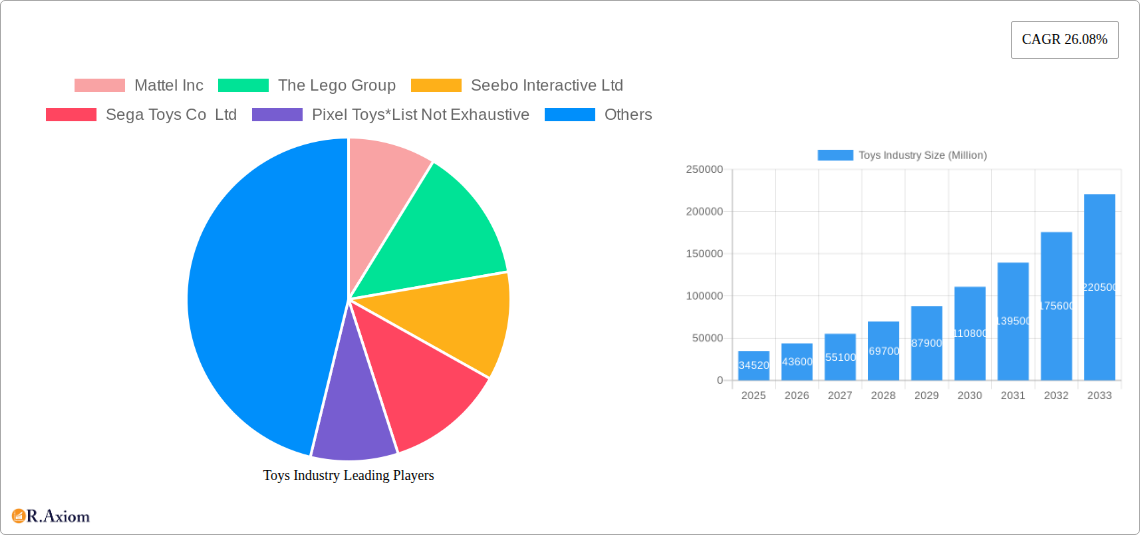
The toys industry exhibits a moderately concentrated market structure, with a few major players holding significant market share. Mattel Inc. and The Lego Group are prominent examples, commanding xx% and xx% of the market, respectively, in 2024. However, the market also accommodates numerous smaller players specializing in niche segments. Innovation is a crucial driver, fueled by technological advancements, changing consumer preferences, and the need for engaging and educational toys. Key innovation areas include incorporating augmented reality (AR), virtual reality (VR), and artificial intelligence (AI) into toys. Regulatory frameworks concerning toy safety and compliance significantly impact market dynamics. The increasing prevalence of substitute products, such as digital games and entertainment, presents a challenge to traditional toy manufacturers. Consumer preferences are shifting towards interactive, educational, and sustainable toys, shaping product development strategies. The M&A landscape has witnessed notable activity in recent years, with deal values totaling xx Million in 2024. These activities often involve consolidation within the industry and expansion into new markets.
- Market Share (2024): Mattel Inc. (xx%), The Lego Group (xx%), Others (xx%)
- M&A Deal Value (2024): xx Million
Toys Industry Industry Trends & Insights
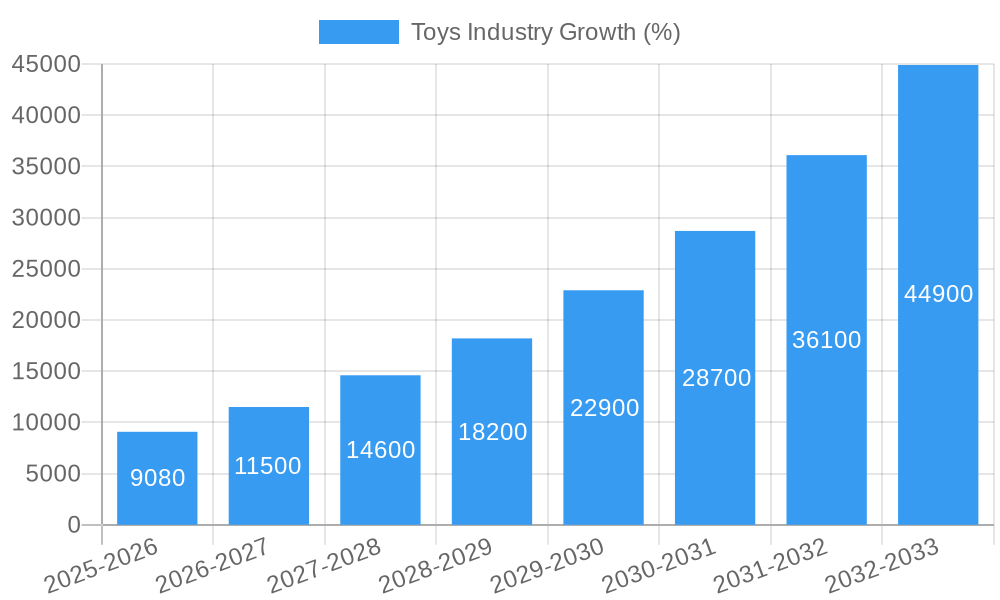
This section explores key trends and insights shaping the global toys market. The industry is experiencing robust growth, driven by several factors. Increasing disposable incomes, particularly in emerging economies, are fueling demand. Technological advancements, such as the integration of smart technologies into toys, have broadened the appeal and functionality of toys. Changing consumer preferences toward educational and interactive toys are driving innovation. The growing popularity of online retail channels is also impacting distribution strategies. Competitive dynamics are intense, with companies vying for market share through product differentiation, innovation, and strategic partnerships. The Compound Annual Growth Rate (CAGR) for the global toys market is projected to be xx% during the forecast period (2025-2033). Market penetration for smart toys is estimated to reach xx% by 2033.
Dominant Markets & Segments in Toys Industry
This section identifies the leading regions, countries, and segments within the toys industry.
By Technology: The smartphone-connected segment dominates the market, driven by increased smartphone penetration and the growing preference for interactive toys. Bluetooth technology is also widely used, offering seamless connectivity and user-friendly features. Other technologies like NFC and RFID are gaining traction but have lower market penetration compared to Wi-Fi and Bluetooth.
By Distribution Channel: Online stores are emerging as a dominant distribution channel due to their convenience, wide reach, and increasing consumer preference for online shopping. Specialty stores retain a significant presence, focusing on a curated selection of high-quality toys. Convenience stores have a smaller share, largely catering to impulse purchases.
By Interfacing Devices: Smartphone-connected toys command the largest market segment, reflecting widespread smartphone usage. Tablet-connected toys also hold a significant share. Console-connected toys represent a smaller segment.
- Key Drivers (for Dominant Segments):
- Smartphone-Connected Toys: High smartphone penetration, user-friendly interfaces, expanding app ecosystem.
- Online Stores: Convenience, wider reach, cost-effectiveness for consumers and businesses.
Toys Industry Product Developments
Recent product innovations showcase a significant focus on integrating technology into toys to enhance engagement and educational value. Smart toys with interactive features, augmented reality elements, and educational apps are gaining popularity. The competitive advantage lies in creating innovative, engaging experiences that cater to evolving consumer preferences. The market trends towards educational and sustainable toys.
Report Scope & Segmentation Analysis
This report segments the toys market by technology (Wi-Fi, Bluetooth, Other Technologies), distribution channel (Online Stores, Specialty Stores, Convenience Stores), and interfacing devices (Smartphone Connected, Tablet-Connected, Other Interfacing Devices). Each segment's market size, growth projections, and competitive dynamics are thoroughly analyzed. For instance, the smartphone-connected segment is anticipated to exhibit significant growth driven by rising smartphone adoption and preference for interactive play experiences. Online stores are forecasted to dominate the distribution channel, leveraging the growth in e-commerce.
Key Drivers of Toys Industry Growth
Several factors propel the growth of the toys industry. Technological advancements such as AI and AR integration enhance play experiences. Rising disposable incomes in developing nations stimulate demand. Favorable government regulations promoting child development through play contribute positively. The increasing adoption of online retail channels broadens market access.
Challenges in the Toys Industry Sector
The toys industry faces several challenges. Stringent safety regulations increase manufacturing costs. Supply chain disruptions impact product availability. Intense competition necessitates continuous innovation and marketing efforts to maintain market share. The rising popularity of digital entertainment poses a significant threat.
Emerging Opportunities in Toys Industry
Emerging opportunities include the expansion into new markets with growing disposable incomes. The integration of educational technologies in toys caters to growing parental interest in child development. The rising demand for sustainable and eco-friendly toys presents a niche market opportunity. Personalized toys, based on individual preferences, present a promising new sector.
Leading Players in the Toys Industry Market
- Mattel Inc
- The Lego Group
- Seebo Interactive Ltd
- Sega Toys Co Ltd
- Pixel Toys
- Playmobil (Brandstätter Group)
- Primo Toys
- Pillar Learning
- TOSY Robotics JSC
- Leapfrog Enterprises Inc
Key Developments in Toys Industry Industry
- November 2022: LeapFrog launched My Pal Scout and Violet Smarty Paws interactive plush toys, finalists for Toy of the Year, featuring touch-sensitive paws triggering various responses. This highlights the trend towards interactive and educational toys.
- February 2023: Mattel Inc. partnered with Velan Studios to launch Hot Wheels: Rift Rally, a mixed-reality racing experience using a digitally transforming RC car. This demonstrates the industry’s embrace of technological advancements for enhanced gameplay.
Strategic Outlook for Toys Industry Market
The toys industry presents a robust growth trajectory driven by technological integration, evolving consumer preferences, and expanding global markets. The focus on interactive, educational, and sustainable toys will define future success. Companies embracing innovation and adapting to changing market dynamics are poised for significant growth in the coming years.
Toys Industry Segmentation
-
1. Interfacing Devices
- 1.1. Smartphone Connected
- 1.2. Tablet-Connected
- 1.3. Other Interfacing Devices (Console-connected)
-
2. Technology
- 2.1. Wi-Fi
- 2.2. Bluetooth
- 2.3. Other Technologies (NFC and RFID)
-
3. Distribution Channel
- 3.1. Online Stores
- 3.2. Specialty Stores and Convenience Stores
Toys Industry Segmentation By Geography
- 1. North America
- 2. Europe
- 3. Asia Pacific
- 4. Rest of the World
Toys Industry REPORT HIGHLIGHTS
| Aspects | Details |
|---|---|
| Study Period | 2019-2033 |
| Base Year | 2024 |
| Estimated Year | 2025 |
| Forecast Period | 2025-2033 |
| Historical Period | 2019-2024 |
| Growth Rate | CAGR of 26.08% from 2019-2033 |
| Segmentation |
|
Table of Contents
- 1. Introduction
- 1.1. Research Scope
- 1.2. Market Segmentation
- 1.3. Research Methodology
- 1.4. Definitions and Assumptions
- 2. Executive Summary
- 2.1. Introduction
- 3. Market Dynamics
- 3.1. Introduction
- 3.2. Market Drivers
- 3.2.1 Increasing Awareness of Technology-Led Education; Increasing Adoption of Technologies like AI
- 3.2.2 IoT
- 3.2.3 Smart Homes
- 3.2.4 Cloud
- 3.2.5 and Connected Mobile Devices; Parents are Increasingly Willing to Invest Smart Toy Increase Usage To Drive the Market Growth
- 3.3. Market Restrains
- 3.3.1. Fragmented Market with Several Local Vendors
- 3.4. Market Trends
- 3.4.1. Increasing Awareness of Technology-Led Education to Witness the Growth
- 4. Market Factor Analysis
- 4.1. Porters Five Forces
- 4.2. Supply/Value Chain
- 4.3. PESTEL analysis
- 4.4. Market Entropy
- 4.5. Patent/Trademark Analysis
- 5. Global Toys Industry Analysis, Insights and Forecast, 2019-2031
- 5.1. Market Analysis, Insights and Forecast - by Interfacing Devices
- 5.1.1. Smartphone Connected
- 5.1.2. Tablet-Connected
- 5.1.3. Other Interfacing Devices (Console-connected)
- 5.2. Market Analysis, Insights and Forecast - by Technology
- 5.2.1. Wi-Fi
- 5.2.2. Bluetooth
- 5.2.3. Other Technologies (NFC and RFID)
- 5.3. Market Analysis, Insights and Forecast - by Distribution Channel
- 5.3.1. Online Stores
- 5.3.2. Specialty Stores and Convenience Stores
- 5.4. Market Analysis, Insights and Forecast - by Region
- 5.4.1. North America
- 5.4.2. Europe
- 5.4.3. Asia Pacific
- 5.4.4. Rest of the World
- 5.1. Market Analysis, Insights and Forecast - by Interfacing Devices
- 6. North America Toys Industry Analysis, Insights and Forecast, 2019-2031
- 6.1. Market Analysis, Insights and Forecast - by Interfacing Devices
- 6.1.1. Smartphone Connected
- 6.1.2. Tablet-Connected
- 6.1.3. Other Interfacing Devices (Console-connected)
- 6.2. Market Analysis, Insights and Forecast - by Technology
- 6.2.1. Wi-Fi
- 6.2.2. Bluetooth
- 6.2.3. Other Technologies (NFC and RFID)
- 6.3. Market Analysis, Insights and Forecast - by Distribution Channel
- 6.3.1. Online Stores
- 6.3.2. Specialty Stores and Convenience Stores
- 6.1. Market Analysis, Insights and Forecast - by Interfacing Devices
- 7. Europe Toys Industry Analysis, Insights and Forecast, 2019-2031
- 7.1. Market Analysis, Insights and Forecast - by Interfacing Devices
- 7.1.1. Smartphone Connected
- 7.1.2. Tablet-Connected
- 7.1.3. Other Interfacing Devices (Console-connected)
- 7.2. Market Analysis, Insights and Forecast - by Technology
- 7.2.1. Wi-Fi
- 7.2.2. Bluetooth
- 7.2.3. Other Technologies (NFC and RFID)
- 7.3. Market Analysis, Insights and Forecast - by Distribution Channel
- 7.3.1. Online Stores
- 7.3.2. Specialty Stores and Convenience Stores
- 7.1. Market Analysis, Insights and Forecast - by Interfacing Devices
- 8. Asia Pacific Toys Industry Analysis, Insights and Forecast, 2019-2031
- 8.1. Market Analysis, Insights and Forecast - by Interfacing Devices
- 8.1.1. Smartphone Connected
- 8.1.2. Tablet-Connected
- 8.1.3. Other Interfacing Devices (Console-connected)
- 8.2. Market Analysis, Insights and Forecast - by Technology
- 8.2.1. Wi-Fi
- 8.2.2. Bluetooth
- 8.2.3. Other Technologies (NFC and RFID)
- 8.3. Market Analysis, Insights and Forecast - by Distribution Channel
- 8.3.1. Online Stores
- 8.3.2. Specialty Stores and Convenience Stores
- 8.1. Market Analysis, Insights and Forecast - by Interfacing Devices
- 9. Rest of the World Toys Industry Analysis, Insights and Forecast, 2019-2031
- 9.1. Market Analysis, Insights and Forecast - by Interfacing Devices
- 9.1.1. Smartphone Connected
- 9.1.2. Tablet-Connected
- 9.1.3. Other Interfacing Devices (Console-connected)
- 9.2. Market Analysis, Insights and Forecast - by Technology
- 9.2.1. Wi-Fi
- 9.2.2. Bluetooth
- 9.2.3. Other Technologies (NFC and RFID)
- 9.3. Market Analysis, Insights and Forecast - by Distribution Channel
- 9.3.1. Online Stores
- 9.3.2. Specialty Stores and Convenience Stores
- 9.1. Market Analysis, Insights and Forecast - by Interfacing Devices
- 10. North America Toys Industry Analysis, Insights and Forecast, 2019-2031
- 10.1. Market Analysis, Insights and Forecast - By Country/Sub-region
- 10.1.1 United States
- 10.1.2 Canada
- 10.1.3 Mexico
- 11. Europe Toys Industry Analysis, Insights and Forecast, 2019-2031
- 11.1. Market Analysis, Insights and Forecast - By Country/Sub-region
- 11.1.1 Germany
- 11.1.2 United Kingdom
- 11.1.3 France
- 11.1.4 Spain
- 11.1.5 Italy
- 11.1.6 Spain
- 11.1.7 Belgium
- 11.1.8 Netherland
- 11.1.9 Nordics
- 11.1.10 Rest of Europe
- 12. Asia Pacific Toys Industry Analysis, Insights and Forecast, 2019-2031
- 12.1. Market Analysis, Insights and Forecast - By Country/Sub-region
- 12.1.1 China
- 12.1.2 Japan
- 12.1.3 India
- 12.1.4 South Korea
- 12.1.5 Southeast Asia
- 12.1.6 Australia
- 12.1.7 Indonesia
- 12.1.8 Phillipes
- 12.1.9 Singapore
- 12.1.10 Thailandc
- 12.1.11 Rest of Asia Pacific
- 13. South America Toys Industry Analysis, Insights and Forecast, 2019-2031
- 13.1. Market Analysis, Insights and Forecast - By Country/Sub-region
- 13.1.1 Brazil
- 13.1.2 Argentina
- 13.1.3 Peru
- 13.1.4 Chile
- 13.1.5 Colombia
- 13.1.6 Ecuador
- 13.1.7 Venezuela
- 13.1.8 Rest of South America
- 14. North America Toys Industry Analysis, Insights and Forecast, 2019-2031
- 14.1. Market Analysis, Insights and Forecast - By Country/Sub-region
- 14.1.1 United States
- 14.1.2 Canada
- 14.1.3 Mexico
- 15. MEA Toys Industry Analysis, Insights and Forecast, 2019-2031
- 15.1. Market Analysis, Insights and Forecast - By Country/Sub-region
- 15.1.1 United Arab Emirates
- 15.1.2 Saudi Arabia
- 15.1.3 South Africa
- 15.1.4 Rest of Middle East and Africa
- 16. Competitive Analysis
- 16.1. Global Market Share Analysis 2024
- 16.2. Company Profiles
- 16.2.1 Mattel Inc
- 16.2.1.1. Overview
- 16.2.1.2. Products
- 16.2.1.3. SWOT Analysis
- 16.2.1.4. Recent Developments
- 16.2.1.5. Financials (Based on Availability)
- 16.2.2 The Lego Group
- 16.2.2.1. Overview
- 16.2.2.2. Products
- 16.2.2.3. SWOT Analysis
- 16.2.2.4. Recent Developments
- 16.2.2.5. Financials (Based on Availability)
- 16.2.3 Seebo Interactive Ltd
- 16.2.3.1. Overview
- 16.2.3.2. Products
- 16.2.3.3. SWOT Analysis
- 16.2.3.4. Recent Developments
- 16.2.3.5. Financials (Based on Availability)
- 16.2.4 Sega Toys Co Ltd
- 16.2.4.1. Overview
- 16.2.4.2. Products
- 16.2.4.3. SWOT Analysis
- 16.2.4.4. Recent Developments
- 16.2.4.5. Financials (Based on Availability)
- 16.2.5 Pixel Toys*List Not Exhaustive
- 16.2.5.1. Overview
- 16.2.5.2. Products
- 16.2.5.3. SWOT Analysis
- 16.2.5.4. Recent Developments
- 16.2.5.5. Financials (Based on Availability)
- 16.2.6 Playmobil (Brandstätter Group)
- 16.2.6.1. Overview
- 16.2.6.2. Products
- 16.2.6.3. SWOT Analysis
- 16.2.6.4. Recent Developments
- 16.2.6.5. Financials (Based on Availability)
- 16.2.7 Primo Toys
- 16.2.7.1. Overview
- 16.2.7.2. Products
- 16.2.7.3. SWOT Analysis
- 16.2.7.4. Recent Developments
- 16.2.7.5. Financials (Based on Availability)
- 16.2.8 Pillar Learning
- 16.2.8.1. Overview
- 16.2.8.2. Products
- 16.2.8.3. SWOT Analysis
- 16.2.8.4. Recent Developments
- 16.2.8.5. Financials (Based on Availability)
- 16.2.9 TOSY Robotics JSC
- 16.2.9.1. Overview
- 16.2.9.2. Products
- 16.2.9.3. SWOT Analysis
- 16.2.9.4. Recent Developments
- 16.2.9.5. Financials (Based on Availability)
- 16.2.10 Leapfrog Enterprises Inc
- 16.2.10.1. Overview
- 16.2.10.2. Products
- 16.2.10.3. SWOT Analysis
- 16.2.10.4. Recent Developments
- 16.2.10.5. Financials (Based on Availability)
- 16.2.1 Mattel Inc
List of Figures
- Figure 1: Global Toys Industry Revenue Breakdown (Million, %) by Region 2024 & 2032
- Figure 2: North America Toys Industry Revenue (Million), by Country 2024 & 2032
- Figure 3: North America Toys Industry Revenue Share (%), by Country 2024 & 2032
- Figure 4: Europe Toys Industry Revenue (Million), by Country 2024 & 2032
- Figure 5: Europe Toys Industry Revenue Share (%), by Country 2024 & 2032
- Figure 6: Asia Pacific Toys Industry Revenue (Million), by Country 2024 & 2032
- Figure 7: Asia Pacific Toys Industry Revenue Share (%), by Country 2024 & 2032
- Figure 8: South America Toys Industry Revenue (Million), by Country 2024 & 2032
- Figure 9: South America Toys Industry Revenue Share (%), by Country 2024 & 2032
- Figure 10: North America Toys Industry Revenue (Million), by Country 2024 & 2032
- Figure 11: North America Toys Industry Revenue Share (%), by Country 2024 & 2032
- Figure 12: MEA Toys Industry Revenue (Million), by Country 2024 & 2032
- Figure 13: MEA Toys Industry Revenue Share (%), by Country 2024 & 2032
- Figure 14: North America Toys Industry Revenue (Million), by Interfacing Devices 2024 & 2032
- Figure 15: North America Toys Industry Revenue Share (%), by Interfacing Devices 2024 & 2032
- Figure 16: North America Toys Industry Revenue (Million), by Technology 2024 & 2032
- Figure 17: North America Toys Industry Revenue Share (%), by Technology 2024 & 2032
- Figure 18: North America Toys Industry Revenue (Million), by Distribution Channel 2024 & 2032
- Figure 19: North America Toys Industry Revenue Share (%), by Distribution Channel 2024 & 2032
- Figure 20: North America Toys Industry Revenue (Million), by Country 2024 & 2032
- Figure 21: North America Toys Industry Revenue Share (%), by Country 2024 & 2032
- Figure 22: Europe Toys Industry Revenue (Million), by Interfacing Devices 2024 & 2032
- Figure 23: Europe Toys Industry Revenue Share (%), by Interfacing Devices 2024 & 2032
- Figure 24: Europe Toys Industry Revenue (Million), by Technology 2024 & 2032
- Figure 25: Europe Toys Industry Revenue Share (%), by Technology 2024 & 2032
- Figure 26: Europe Toys Industry Revenue (Million), by Distribution Channel 2024 & 2032
- Figure 27: Europe Toys Industry Revenue Share (%), by Distribution Channel 2024 & 2032
- Figure 28: Europe Toys Industry Revenue (Million), by Country 2024 & 2032
- Figure 29: Europe Toys Industry Revenue Share (%), by Country 2024 & 2032
- Figure 30: Asia Pacific Toys Industry Revenue (Million), by Interfacing Devices 2024 & 2032
- Figure 31: Asia Pacific Toys Industry Revenue Share (%), by Interfacing Devices 2024 & 2032
- Figure 32: Asia Pacific Toys Industry Revenue (Million), by Technology 2024 & 2032
- Figure 33: Asia Pacific Toys Industry Revenue Share (%), by Technology 2024 & 2032
- Figure 34: Asia Pacific Toys Industry Revenue (Million), by Distribution Channel 2024 & 2032
- Figure 35: Asia Pacific Toys Industry Revenue Share (%), by Distribution Channel 2024 & 2032
- Figure 36: Asia Pacific Toys Industry Revenue (Million), by Country 2024 & 2032
- Figure 37: Asia Pacific Toys Industry Revenue Share (%), by Country 2024 & 2032
- Figure 38: Rest of the World Toys Industry Revenue (Million), by Interfacing Devices 2024 & 2032
- Figure 39: Rest of the World Toys Industry Revenue Share (%), by Interfacing Devices 2024 & 2032
- Figure 40: Rest of the World Toys Industry Revenue (Million), by Technology 2024 & 2032
- Figure 41: Rest of the World Toys Industry Revenue Share (%), by Technology 2024 & 2032
- Figure 42: Rest of the World Toys Industry Revenue (Million), by Distribution Channel 2024 & 2032
- Figure 43: Rest of the World Toys Industry Revenue Share (%), by Distribution Channel 2024 & 2032
- Figure 44: Rest of the World Toys Industry Revenue (Million), by Country 2024 & 2032
- Figure 45: Rest of the World Toys Industry Revenue Share (%), by Country 2024 & 2032
List of Tables
- Table 1: Global Toys Industry Revenue Million Forecast, by Region 2019 & 2032
- Table 2: Global Toys Industry Revenue Million Forecast, by Interfacing Devices 2019 & 2032
- Table 3: Global Toys Industry Revenue Million Forecast, by Technology 2019 & 2032
- Table 4: Global Toys Industry Revenue Million Forecast, by Distribution Channel 2019 & 2032
- Table 5: Global Toys Industry Revenue Million Forecast, by Region 2019 & 2032
- Table 6: Global Toys Industry Revenue Million Forecast, by Country 2019 & 2032
- Table 7: United States Toys Industry Revenue (Million) Forecast, by Application 2019 & 2032
- Table 8: Canada Toys Industry Revenue (Million) Forecast, by Application 2019 & 2032
- Table 9: Mexico Toys Industry Revenue (Million) Forecast, by Application 2019 & 2032
- Table 10: Global Toys Industry Revenue Million Forecast, by Country 2019 & 2032
- Table 11: Germany Toys Industry Revenue (Million) Forecast, by Application 2019 & 2032
- Table 12: United Kingdom Toys Industry Revenue (Million) Forecast, by Application 2019 & 2032
- Table 13: France Toys Industry Revenue (Million) Forecast, by Application 2019 & 2032
- Table 14: Spain Toys Industry Revenue (Million) Forecast, by Application 2019 & 2032
- Table 15: Italy Toys Industry Revenue (Million) Forecast, by Application 2019 & 2032
- Table 16: Spain Toys Industry Revenue (Million) Forecast, by Application 2019 & 2032
- Table 17: Belgium Toys Industry Revenue (Million) Forecast, by Application 2019 & 2032
- Table 18: Netherland Toys Industry Revenue (Million) Forecast, by Application 2019 & 2032
- Table 19: Nordics Toys Industry Revenue (Million) Forecast, by Application 2019 & 2032
- Table 20: Rest of Europe Toys Industry Revenue (Million) Forecast, by Application 2019 & 2032
- Table 21: Global Toys Industry Revenue Million Forecast, by Country 2019 & 2032
- Table 22: China Toys Industry Revenue (Million) Forecast, by Application 2019 & 2032
- Table 23: Japan Toys Industry Revenue (Million) Forecast, by Application 2019 & 2032
- Table 24: India Toys Industry Revenue (Million) Forecast, by Application 2019 & 2032
- Table 25: South Korea Toys Industry Revenue (Million) Forecast, by Application 2019 & 2032
- Table 26: Southeast Asia Toys Industry Revenue (Million) Forecast, by Application 2019 & 2032
- Table 27: Australia Toys Industry Revenue (Million) Forecast, by Application 2019 & 2032
- Table 28: Indonesia Toys Industry Revenue (Million) Forecast, by Application 2019 & 2032
- Table 29: Phillipes Toys Industry Revenue (Million) Forecast, by Application 2019 & 2032
- Table 30: Singapore Toys Industry Revenue (Million) Forecast, by Application 2019 & 2032
- Table 31: Thailandc Toys Industry Revenue (Million) Forecast, by Application 2019 & 2032
- Table 32: Rest of Asia Pacific Toys Industry Revenue (Million) Forecast, by Application 2019 & 2032
- Table 33: Global Toys Industry Revenue Million Forecast, by Country 2019 & 2032
- Table 34: Brazil Toys Industry Revenue (Million) Forecast, by Application 2019 & 2032
- Table 35: Argentina Toys Industry Revenue (Million) Forecast, by Application 2019 & 2032
- Table 36: Peru Toys Industry Revenue (Million) Forecast, by Application 2019 & 2032
- Table 37: Chile Toys Industry Revenue (Million) Forecast, by Application 2019 & 2032
- Table 38: Colombia Toys Industry Revenue (Million) Forecast, by Application 2019 & 2032
- Table 39: Ecuador Toys Industry Revenue (Million) Forecast, by Application 2019 & 2032
- Table 40: Venezuela Toys Industry Revenue (Million) Forecast, by Application 2019 & 2032
- Table 41: Rest of South America Toys Industry Revenue (Million) Forecast, by Application 2019 & 2032
- Table 42: Global Toys Industry Revenue Million Forecast, by Country 2019 & 2032
- Table 43: United States Toys Industry Revenue (Million) Forecast, by Application 2019 & 2032
- Table 44: Canada Toys Industry Revenue (Million) Forecast, by Application 2019 & 2032
- Table 45: Mexico Toys Industry Revenue (Million) Forecast, by Application 2019 & 2032
- Table 46: Global Toys Industry Revenue Million Forecast, by Country 2019 & 2032
- Table 47: United Arab Emirates Toys Industry Revenue (Million) Forecast, by Application 2019 & 2032
- Table 48: Saudi Arabia Toys Industry Revenue (Million) Forecast, by Application 2019 & 2032
- Table 49: South Africa Toys Industry Revenue (Million) Forecast, by Application 2019 & 2032
- Table 50: Rest of Middle East and Africa Toys Industry Revenue (Million) Forecast, by Application 2019 & 2032
- Table 51: Global Toys Industry Revenue Million Forecast, by Interfacing Devices 2019 & 2032
- Table 52: Global Toys Industry Revenue Million Forecast, by Technology 2019 & 2032
- Table 53: Global Toys Industry Revenue Million Forecast, by Distribution Channel 2019 & 2032
- Table 54: Global Toys Industry Revenue Million Forecast, by Country 2019 & 2032
- Table 55: Global Toys Industry Revenue Million Forecast, by Interfacing Devices 2019 & 2032
- Table 56: Global Toys Industry Revenue Million Forecast, by Technology 2019 & 2032
- Table 57: Global Toys Industry Revenue Million Forecast, by Distribution Channel 2019 & 2032
- Table 58: Global Toys Industry Revenue Million Forecast, by Country 2019 & 2032
- Table 59: Global Toys Industry Revenue Million Forecast, by Interfacing Devices 2019 & 2032
- Table 60: Global Toys Industry Revenue Million Forecast, by Technology 2019 & 2032
- Table 61: Global Toys Industry Revenue Million Forecast, by Distribution Channel 2019 & 2032
- Table 62: Global Toys Industry Revenue Million Forecast, by Country 2019 & 2032
- Table 63: Global Toys Industry Revenue Million Forecast, by Interfacing Devices 2019 & 2032
- Table 64: Global Toys Industry Revenue Million Forecast, by Technology 2019 & 2032
- Table 65: Global Toys Industry Revenue Million Forecast, by Distribution Channel 2019 & 2032
- Table 66: Global Toys Industry Revenue Million Forecast, by Country 2019 & 2032
Frequently Asked Questions
1. What is the projected Compound Annual Growth Rate (CAGR) of the Toys Industry?
The projected CAGR is approximately 26.08%.
2. Which companies are prominent players in the Toys Industry?
Key companies in the market include Mattel Inc, The Lego Group, Seebo Interactive Ltd, Sega Toys Co Ltd, Pixel Toys*List Not Exhaustive, Playmobil (Brandstätter Group), Primo Toys, Pillar Learning, TOSY Robotics JSC, Leapfrog Enterprises Inc.
3. What are the main segments of the Toys Industry?
The market segments include Interfacing Devices, Technology, Distribution Channel.
4. Can you provide details about the market size?
The market size is estimated to be USD 34.52 Million as of 2022.
5. What are some drivers contributing to market growth?
Increasing Awareness of Technology-Led Education; Increasing Adoption of Technologies like AI. IoT. Smart Homes. Cloud. and Connected Mobile Devices; Parents are Increasingly Willing to Invest Smart Toy Increase Usage To Drive the Market Growth.
6. What are the notable trends driving market growth?
Increasing Awareness of Technology-Led Education to Witness the Growth.
7. Are there any restraints impacting market growth?
Fragmented Market with Several Local Vendors.
8. Can you provide examples of recent developments in the market?
February 2023: Mattel, Inc, in partnership with Velan Studios, announced the launch of Hot Wheels: Rift Rally, an exciting mixed-reality racing experience that will be available on the App Store for iOS, PlayStation 4, and PlayStation 5. This immersive experience allows players to take control of their beloved Hot Wheels vehicles using the innovative Chameleon RC car, which can digitally transform into over 140 different vehicle variations. Players can race with iconic Hot Wheels models like Twin Mill, Bone Shaker, Mach Speeder, Gotta Go, and many other fan favorites. Get ready for an adrenaline-fueled adventure like never before.
9. What pricing options are available for accessing the report?
Pricing options include single-user, multi-user, and enterprise licenses priced at USD 4750, USD 5250, and USD 8750 respectively.
10. Is the market size provided in terms of value or volume?
The market size is provided in terms of value, measured in Million.
11. Are there any specific market keywords associated with the report?
Yes, the market keyword associated with the report is "Toys Industry," which aids in identifying and referencing the specific market segment covered.
12. How do I determine which pricing option suits my needs best?
The pricing options vary based on user requirements and access needs. Individual users may opt for single-user licenses, while businesses requiring broader access may choose multi-user or enterprise licenses for cost-effective access to the report.
13. Are there any additional resources or data provided in the Toys Industry report?
While the report offers comprehensive insights, it's advisable to review the specific contents or supplementary materials provided to ascertain if additional resources or data are available.
14. How can I stay updated on further developments or reports in the Toys Industry?
To stay informed about further developments, trends, and reports in the Toys Industry, consider subscribing to industry newsletters, following relevant companies and organizations, or regularly checking reputable industry news sources and publications.
Methodology
Step 1 - Identification of Relevant Samples Size from Population Database


Step 2 - Approaches for Defining Global Market Size (Value, Volume* & Price*)

Note*: In applicable scenarios
Step 3 - Data Sources
Primary Research
- Web Analytics
- Survey Reports
- Research Institute
- Latest Research Reports
- Opinion Leaders
Secondary Research
- Annual Reports
- White Paper
- Latest Press Release
- Industry Association
- Paid Database
- Investor Presentations

Step 4 - Data Triangulation
Involves using different sources of information in order to increase the validity of a study
These sources are likely to be stakeholders in a program - participants, other researchers, program staff, other community members, and so on.
Then we put all data in single framework & apply various statistical tools to find out the dynamic on the market.
During the analysis stage, feedback from the stakeholder groups would be compared to determine areas of agreement as well as areas of divergence


