

Key Insights
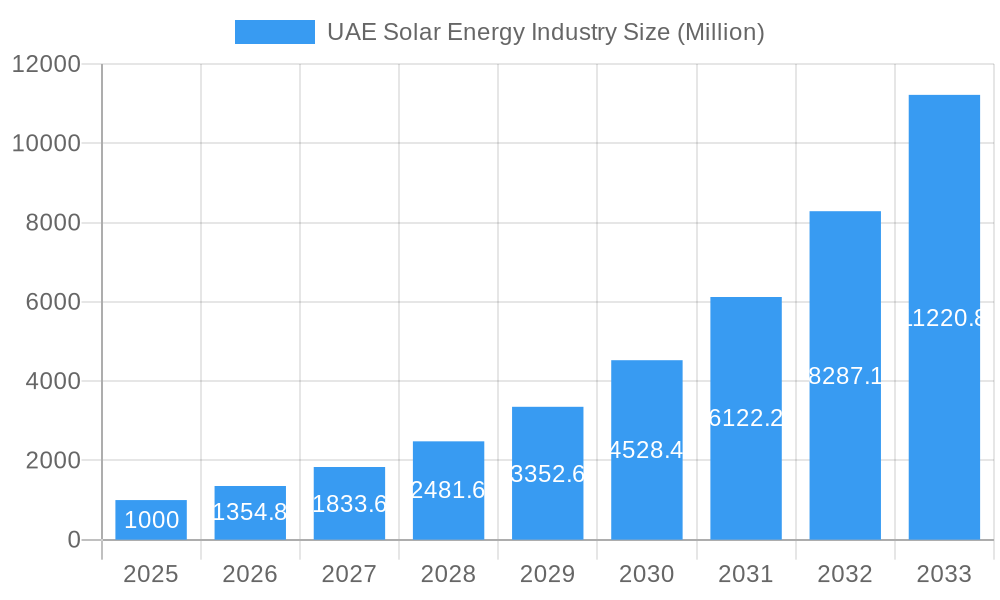
The United Arab Emirates (UAE) solar energy market is poised for substantial expansion, underpinned by the nation's clear sustainability objectives and exceptional solar irradiation levels. The market, projected to reach $10.3 billion by 2025, is anticipated to grow at a Compound Annual Growth Rate (CAGR) of 22.33%. This impressive growth trajectory is propelled by significant investments in utility-scale solar power initiatives, escalating demand for clean energy across utility, commercial, and industrial sectors, and government-backed programs encouraging residential rooftop solar adoption. The Photovoltaic (PV) segment currently leads technological adoption, with Concentrated Solar Power (CSP) also gaining traction in large-scale deployments. The UAE's strategic geographical position and favorable climate further bolster this market's ascent.
UAE Solar Energy Industry Market Size (In Billion)
Despite the positive outlook, potential headwinds include land acquisition for large-scale developments and grid integration complexities. Nevertheless, continuous technological advancements, supportive regulatory frameworks, and heightened environmental consciousness are expected to counterbalance these challenges. Prominent market participants such as JinkoSolar, Sunergy, Canadian Solar, and Masdar are instrumental in shaping the industry through innovation, project execution, and strategic alliances. Intensified competition is anticipated, fostering further innovation and cost optimization. Future market focus will likely center on advancing energy storage solutions and enhancing grid connectivity for a resilient and sustainable energy infrastructure. The residential sector, while presently smaller, presents considerable untapped growth potential, driven by evolving government incentives and public awareness campaigns promoting decentralized energy generation.
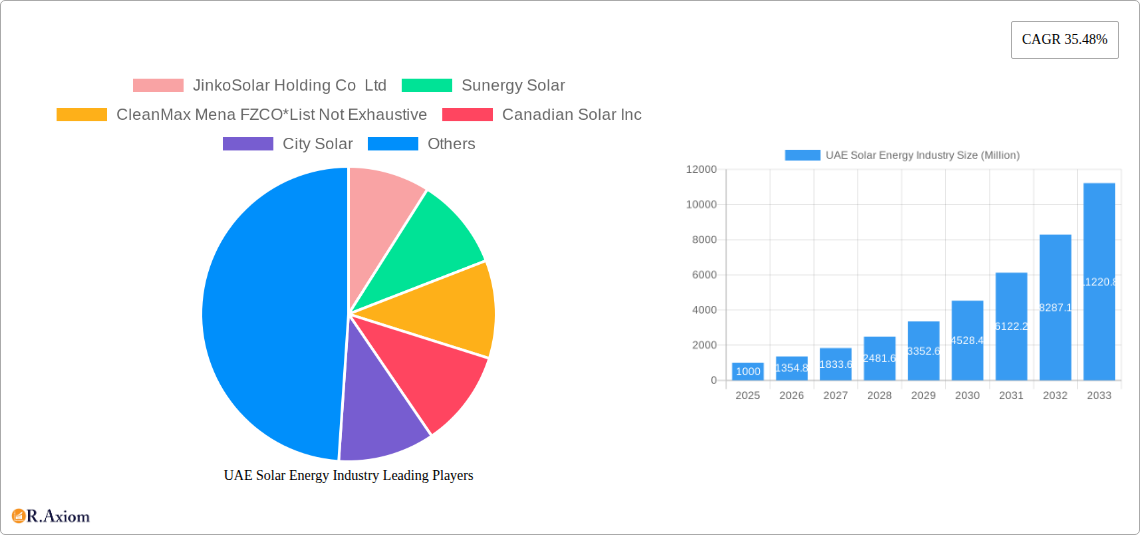
UAE Solar Energy Industry Company Market Share
UAE Solar Energy Industry: Market Analysis & Forecast Report (2019-2033)
This comprehensive report provides an in-depth analysis of the UAE solar energy industry, covering market size, growth drivers, technological advancements, competitive landscape, and future outlook. The report utilizes data from the historical period (2019-2024), the base year (2025), and projects the market forecast for 2025-2033. The study focuses on key segments including Photovoltaic (PV) and Concentrated Solar Power (CSP) technologies, as well as utility, commercial & industrial, and residential deployments. This report is crucial for stakeholders including investors, developers, technology providers, and policymakers seeking to understand the growth potential and dynamics of this rapidly evolving market.
UAE Solar Energy Industry Market Concentration & Innovation
The UAE solar energy market exhibits a moderately concentrated landscape with several key players controlling significant market share. While precise market share figures for individual companies remain confidential, Masdar, ACWA Power, and international players like JinkoSolar Holding Co Ltd and Canadian Solar Inc hold prominent positions. The market is characterized by ongoing innovation, driven by the UAE's commitment to renewable energy targets. Government initiatives such as the UAE Energy Strategy 2050 significantly influence market growth and incentivize technological advancements, particularly in PV technology. Regulatory frameworks, including streamlined permitting processes and attractive feed-in tariffs, further encourage investment. While no significant product substitutes currently challenge solar's dominance, technological innovations like improved solar panel efficiency and energy storage solutions continuously enhance the industry's competitiveness. End-user trends indicate a growing preference for renewable energy sources, particularly among large-scale commercial and industrial consumers. Mergers and acquisitions (M&A) activity in the UAE solar sector has been steadily increasing, with deal values reaching approximately xx Million annually in recent years. This suggests consolidation and the emergence of larger, integrated players within the industry.
UAE Solar Energy Industry Industry Trends & Insights
The UAE solar energy market exhibits robust growth, driven by increasing energy demand, favorable government policies, and decreasing technology costs. The Compound Annual Growth Rate (CAGR) for the forecast period (2025-2033) is projected at xx%, exceeding xx% during the historical period. This growth is fueled by large-scale solar power projects, coupled with the increasing adoption of solar PV systems in the commercial and industrial sectors. Technological disruptions, such as advancements in PV efficiency and the integration of smart grids, are further accelerating market expansion. Consumer preferences are shifting towards sustainable energy solutions, influencing residential solar adoption. The competitive dynamics are shaped by the presence of both established international players and local companies, fostering both healthy competition and opportunities for collaboration. Market penetration of solar energy in the total energy mix is currently at xx% and is projected to increase to xx% by 2033.
Dominant Markets & Segments in UAE Solar Energy Industry
The UAE’s utility-scale solar projects represent the dominant segment within the country's solar energy market. This is largely driven by substantial government investment and supportive policies, aimed at meeting long-term energy needs and diversifying the energy mix. Dubai and Abu Dhabi lead in solar energy deployment.
- Key Drivers for Utility-Scale Solar Dominance:
- Government support through subsidies and financial incentives.
- Significant land availability for large-scale projects.
- Focus on achieving renewable energy targets.
- Favorable regulatory environment.
- Economies of scale in large-scale projects.
While utility-scale projects dominate, the commercial and industrial (C&I) sector also shows substantial growth, driven by the decreasing cost of solar technology and corporate sustainability initiatives. The residential segment, while exhibiting slower growth compared to the utility and C&I segments, is witnessing increasing adoption driven by decreasing costs and government incentives. Photovoltaic (PV) technology currently accounts for the largest share of the market, primarily due to its cost-effectiveness and established technology. Concentrated Solar Power (CSP), while still a smaller segment, holds potential for future growth, particularly in large-scale power generation projects.
UAE Solar Energy Industry Product Developments
Recent product innovations focus on increasing efficiency, reducing costs, and improving the durability of solar panels. Advances in thin-film technology, bifacial panels (collecting light from both sides), and improved inverters contribute to higher energy yields and system reliability. The integration of energy storage solutions, like batteries, is increasingly crucial for maximizing solar energy utilization and grid stability. These advancements address various market needs, making solar energy increasingly competitive with traditional power sources.
Report Scope & Segmentation Analysis
This report segments the UAE solar energy market by technology (Photovoltaic and Concentrated Solar Power) and deployment (Utility, Commercial & Industrial, and Residential).
Photovoltaic (PV): This segment dominates the market, driven by cost-effectiveness and mature technology. We project significant growth driven by continuing cost reduction and improved efficiencies.
Concentrated Solar Power (CSP): This segment is smaller, but holds potential for growth in large-scale power generation projects, especially with advancements in thermal energy storage.
Utility: This is the largest segment, driven by government initiatives and large-scale solar power plants. Growth is projected to remain substantial throughout the forecast period.
Commercial & Industrial: This segment is experiencing rapid growth due to corporate sustainability goals and decreasing solar system costs.
Residential: Growth in this segment is slower compared to utility and C&I, but it's steadily increasing due to decreasing prices and government incentives.
Market sizes and competitive dynamics within each segment are extensively analyzed within the full report.
Key Drivers of UAE Solar Energy Industry Growth
The growth of the UAE solar energy industry is driven by several key factors: the UAE Energy Strategy 2050, which targets significant renewable energy contribution; government subsidies and incentives promoting solar adoption; decreasing solar technology costs, making it more competitive; increasing energy demand fueled by economic growth; and a supportive regulatory environment streamlining project development and deployment.
Challenges in the UAE Solar Energy Industry Sector
Challenges include land availability for large-scale projects, especially in densely populated areas; potential grid integration issues related to managing fluctuating solar power output; reliance on international supply chains for solar components creating potential vulnerability to disruptions; and intense competition among various solar energy companies.
Emerging Opportunities in UAE Solar Energy Industry
Emerging opportunities include the integration of solar energy with energy storage systems to provide reliable power supply; the growth of the C&I segment, driven by corporate sustainability initiatives; exploring floating solar technology for water resource utilization and expansion of solar energy in remote areas; and the development of innovative financing mechanisms to support solar energy projects.
Leading Players in the UAE Solar Energy Industry Market
- JinkoSolar Holding Co Ltd
- Sunergy Solar
- CleanMax Mena FZCO
- Canadian Solar Inc
- City Solar
- Masdar (Abu Dhabi Future Energy Company)
- MAYSUN SOLAR FZCO
- Enerwhere
- ACWA Power
Key Developments in UAE Solar Energy Industry Industry
- May 2023: ADNOC Distribution partnered with Emerge (EDF and Masdar JV) to install on-site solar power at its service stations, starting in Dubai. This signifies the expansion of solar adoption into new sectors.
- January 2023: Suntech supplied 680MW of solar modules for the Al Dhafra PV2 solar plant, highlighting significant project progress and confirming the continued growth of large-scale solar projects.
Strategic Outlook for UAE Solar Energy Industry Market
The UAE solar energy market holds substantial potential for growth driven by ambitious renewable energy targets, supportive government policies, technological advancements, and a growing demand for clean energy. Continued investment in large-scale solar projects, alongside the expansion of C&I and residential segments, will drive market expansion. The integration of energy storage and smart grid technologies will further enhance the reliability and efficiency of the solar energy sector. This presents significant opportunities for investors, technology providers, and developers in the coming years.
UAE Solar Energy Industry Segmentation
-
1. Technology
- 1.1. Photovoltaic
- 1.2. Concentrated Solar Power (CSP)
-
2. Deployment
- 2.1. Utility
- 2.2. Commercial and Industrial
- 2.3. Residential
UAE Solar Energy Industry Segmentation By Geography
-
1. North America
- 1.1. United States
- 1.2. Canada
- 1.3. Mexico
-
2. South America
- 2.1. Brazil
- 2.2. Argentina
- 2.3. Rest of South America
-
3. Europe
- 3.1. United Kingdom
- 3.2. Germany
- 3.3. France
- 3.4. Italy
- 3.5. Spain
- 3.6. Russia
- 3.7. Benelux
- 3.8. Nordics
- 3.9. Rest of Europe
-
4. Middle East & Africa
- 4.1. Turkey
- 4.2. Israel
- 4.3. GCC
- 4.4. North Africa
- 4.5. South Africa
- 4.6. Rest of Middle East & Africa
-
5. Asia Pacific
- 5.1. China
- 5.2. India
- 5.3. Japan
- 5.4. South Korea
- 5.5. ASEAN
- 5.6. Oceania
- 5.7. Rest of Asia Pacific
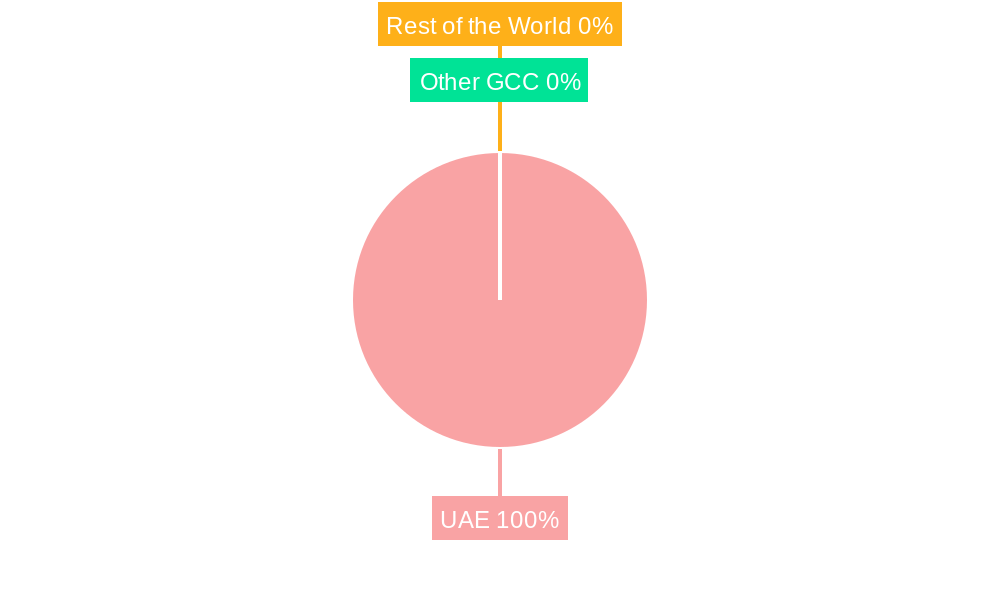
UAE Solar Energy Industry Regional Market Share
Geographic Coverage of UAE Solar Energy Industry
UAE Solar Energy Industry REPORT HIGHLIGHTS
| Aspects | Details |
|---|---|
| Study Period | 2020-2034 |
| Base Year | 2025 |
| Estimated Year | 2026 |
| Forecast Period | 2026-2034 |
| Historical Period | 2020-2025 |
| Growth Rate | CAGR of 22.33% from 2020-2034 |
| Segmentation |
|
Table of Contents
- 1. Introduction
- 1.1. Research Scope
- 1.2. Market Segmentation
- 1.3. Research Methodology
- 1.4. Definitions and Assumptions
- 2. Executive Summary
- 2.1. Introduction
- 3. Market Dynamics
- 3.1. Introduction
- 3.2. Market Drivers
- 3.2.1. 4.; Rising Government Policies to Support Solar PV Installation4.; Rising Installation of Renewable Energy to Reduce Dependency on Fossil Fuels
- 3.3. Market Restrains
- 3.3.1 4.; Rising Adoption of Alternative Clean Energy Sources such as Wind
- 3.3.2 Geothermal
- 3.3.3 Bioenergy
- 3.3.4 and Others
- 3.4. Market Trends
- 3.4.1. Solar Photovoltaic to Dominate the Market
- 4. Market Factor Analysis
- 4.1. Porters Five Forces
- 4.2. Supply/Value Chain
- 4.3. PESTEL analysis
- 4.4. Market Entropy
- 4.5. Patent/Trademark Analysis
- 5. Global UAE Solar Energy Industry Analysis, Insights and Forecast, 2020-2032
- 5.1. Market Analysis, Insights and Forecast - by Technology
- 5.1.1. Photovoltaic
- 5.1.2. Concentrated Solar Power (CSP)
- 5.2. Market Analysis, Insights and Forecast - by Deployment
- 5.2.1. Utility
- 5.2.2. Commercial and Industrial
- 5.2.3. Residential
- 5.3. Market Analysis, Insights and Forecast - by Region
- 5.3.1. North America
- 5.3.2. South America
- 5.3.3. Europe
- 5.3.4. Middle East & Africa
- 5.3.5. Asia Pacific
- 5.1. Market Analysis, Insights and Forecast - by Technology
- 6. North America UAE Solar Energy Industry Analysis, Insights and Forecast, 2020-2032
- 6.1. Market Analysis, Insights and Forecast - by Technology
- 6.1.1. Photovoltaic
- 6.1.2. Concentrated Solar Power (CSP)
- 6.2. Market Analysis, Insights and Forecast - by Deployment
- 6.2.1. Utility
- 6.2.2. Commercial and Industrial
- 6.2.3. Residential
- 6.1. Market Analysis, Insights and Forecast - by Technology
- 7. South America UAE Solar Energy Industry Analysis, Insights and Forecast, 2020-2032
- 7.1. Market Analysis, Insights and Forecast - by Technology
- 7.1.1. Photovoltaic
- 7.1.2. Concentrated Solar Power (CSP)
- 7.2. Market Analysis, Insights and Forecast - by Deployment
- 7.2.1. Utility
- 7.2.2. Commercial and Industrial
- 7.2.3. Residential
- 7.1. Market Analysis, Insights and Forecast - by Technology
- 8. Europe UAE Solar Energy Industry Analysis, Insights and Forecast, 2020-2032
- 8.1. Market Analysis, Insights and Forecast - by Technology
- 8.1.1. Photovoltaic
- 8.1.2. Concentrated Solar Power (CSP)
- 8.2. Market Analysis, Insights and Forecast - by Deployment
- 8.2.1. Utility
- 8.2.2. Commercial and Industrial
- 8.2.3. Residential
- 8.1. Market Analysis, Insights and Forecast - by Technology
- 9. Middle East & Africa UAE Solar Energy Industry Analysis, Insights and Forecast, 2020-2032
- 9.1. Market Analysis, Insights and Forecast - by Technology
- 9.1.1. Photovoltaic
- 9.1.2. Concentrated Solar Power (CSP)
- 9.2. Market Analysis, Insights and Forecast - by Deployment
- 9.2.1. Utility
- 9.2.2. Commercial and Industrial
- 9.2.3. Residential
- 9.1. Market Analysis, Insights and Forecast - by Technology
- 10. Asia Pacific UAE Solar Energy Industry Analysis, Insights and Forecast, 2020-2032
- 10.1. Market Analysis, Insights and Forecast - by Technology
- 10.1.1. Photovoltaic
- 10.1.2. Concentrated Solar Power (CSP)
- 10.2. Market Analysis, Insights and Forecast - by Deployment
- 10.2.1. Utility
- 10.2.2. Commercial and Industrial
- 10.2.3. Residential
- 10.1. Market Analysis, Insights and Forecast - by Technology
- 11. Competitive Analysis
- 11.1. Global Market Share Analysis 2025
- 11.2. Company Profiles
- 11.2.1 JinkoSolar Holding Co Ltd
- 11.2.1.1. Overview
- 11.2.1.2. Products
- 11.2.1.3. SWOT Analysis
- 11.2.1.4. Recent Developments
- 11.2.1.5. Financials (Based on Availability)
- 11.2.2 Sunergy Solar
- 11.2.2.1. Overview
- 11.2.2.2. Products
- 11.2.2.3. SWOT Analysis
- 11.2.2.4. Recent Developments
- 11.2.2.5. Financials (Based on Availability)
- 11.2.3 CleanMax Mena FZCO*List Not Exhaustive
- 11.2.3.1. Overview
- 11.2.3.2. Products
- 11.2.3.3. SWOT Analysis
- 11.2.3.4. Recent Developments
- 11.2.3.5. Financials (Based on Availability)
- 11.2.4 Canadian Solar Inc
- 11.2.4.1. Overview
- 11.2.4.2. Products
- 11.2.4.3. SWOT Analysis
- 11.2.4.4. Recent Developments
- 11.2.4.5. Financials (Based on Availability)
- 11.2.5 City Solar
- 11.2.5.1. Overview
- 11.2.5.2. Products
- 11.2.5.3. SWOT Analysis
- 11.2.5.4. Recent Developments
- 11.2.5.5. Financials (Based on Availability)
- 11.2.6 Masdar (Abu Dhabi Future Energy Company)
- 11.2.6.1. Overview
- 11.2.6.2. Products
- 11.2.6.3. SWOT Analysis
- 11.2.6.4. Recent Developments
- 11.2.6.5. Financials (Based on Availability)
- 11.2.7 MAYSUN SOLAR FZCO
- 11.2.7.1. Overview
- 11.2.7.2. Products
- 11.2.7.3. SWOT Analysis
- 11.2.7.4. Recent Developments
- 11.2.7.5. Financials (Based on Availability)
- 11.2.8 Enerwhere
- 11.2.8.1. Overview
- 11.2.8.2. Products
- 11.2.8.3. SWOT Analysis
- 11.2.8.4. Recent Developments
- 11.2.8.5. Financials (Based on Availability)
- 11.2.9 ACWA Power
- 11.2.9.1. Overview
- 11.2.9.2. Products
- 11.2.9.3. SWOT Analysis
- 11.2.9.4. Recent Developments
- 11.2.9.5. Financials (Based on Availability)
- 11.2.1 JinkoSolar Holding Co Ltd
List of Figures
- Figure 1: Global UAE Solar Energy Industry Revenue Breakdown (billion, %) by Region 2025 & 2033
- Figure 2: Global UAE Solar Energy Industry Volume Breakdown (gigawatt, %) by Region 2025 & 2033
- Figure 3: North America UAE Solar Energy Industry Revenue (billion), by Technology 2025 & 2033
- Figure 4: North America UAE Solar Energy Industry Volume (gigawatt), by Technology 2025 & 2033
- Figure 5: North America UAE Solar Energy Industry Revenue Share (%), by Technology 2025 & 2033
- Figure 6: North America UAE Solar Energy Industry Volume Share (%), by Technology 2025 & 2033
- Figure 7: North America UAE Solar Energy Industry Revenue (billion), by Deployment 2025 & 2033
- Figure 8: North America UAE Solar Energy Industry Volume (gigawatt), by Deployment 2025 & 2033
- Figure 9: North America UAE Solar Energy Industry Revenue Share (%), by Deployment 2025 & 2033
- Figure 10: North America UAE Solar Energy Industry Volume Share (%), by Deployment 2025 & 2033
- Figure 11: North America UAE Solar Energy Industry Revenue (billion), by Country 2025 & 2033
- Figure 12: North America UAE Solar Energy Industry Volume (gigawatt), by Country 2025 & 2033
- Figure 13: North America UAE Solar Energy Industry Revenue Share (%), by Country 2025 & 2033
- Figure 14: North America UAE Solar Energy Industry Volume Share (%), by Country 2025 & 2033
- Figure 15: South America UAE Solar Energy Industry Revenue (billion), by Technology 2025 & 2033
- Figure 16: South America UAE Solar Energy Industry Volume (gigawatt), by Technology 2025 & 2033
- Figure 17: South America UAE Solar Energy Industry Revenue Share (%), by Technology 2025 & 2033
- Figure 18: South America UAE Solar Energy Industry Volume Share (%), by Technology 2025 & 2033
- Figure 19: South America UAE Solar Energy Industry Revenue (billion), by Deployment 2025 & 2033
- Figure 20: South America UAE Solar Energy Industry Volume (gigawatt), by Deployment 2025 & 2033
- Figure 21: South America UAE Solar Energy Industry Revenue Share (%), by Deployment 2025 & 2033
- Figure 22: South America UAE Solar Energy Industry Volume Share (%), by Deployment 2025 & 2033
- Figure 23: South America UAE Solar Energy Industry Revenue (billion), by Country 2025 & 2033
- Figure 24: South America UAE Solar Energy Industry Volume (gigawatt), by Country 2025 & 2033
- Figure 25: South America UAE Solar Energy Industry Revenue Share (%), by Country 2025 & 2033
- Figure 26: South America UAE Solar Energy Industry Volume Share (%), by Country 2025 & 2033
- Figure 27: Europe UAE Solar Energy Industry Revenue (billion), by Technology 2025 & 2033
- Figure 28: Europe UAE Solar Energy Industry Volume (gigawatt), by Technology 2025 & 2033
- Figure 29: Europe UAE Solar Energy Industry Revenue Share (%), by Technology 2025 & 2033
- Figure 30: Europe UAE Solar Energy Industry Volume Share (%), by Technology 2025 & 2033
- Figure 31: Europe UAE Solar Energy Industry Revenue (billion), by Deployment 2025 & 2033
- Figure 32: Europe UAE Solar Energy Industry Volume (gigawatt), by Deployment 2025 & 2033
- Figure 33: Europe UAE Solar Energy Industry Revenue Share (%), by Deployment 2025 & 2033
- Figure 34: Europe UAE Solar Energy Industry Volume Share (%), by Deployment 2025 & 2033
- Figure 35: Europe UAE Solar Energy Industry Revenue (billion), by Country 2025 & 2033
- Figure 36: Europe UAE Solar Energy Industry Volume (gigawatt), by Country 2025 & 2033
- Figure 37: Europe UAE Solar Energy Industry Revenue Share (%), by Country 2025 & 2033
- Figure 38: Europe UAE Solar Energy Industry Volume Share (%), by Country 2025 & 2033
- Figure 39: Middle East & Africa UAE Solar Energy Industry Revenue (billion), by Technology 2025 & 2033
- Figure 40: Middle East & Africa UAE Solar Energy Industry Volume (gigawatt), by Technology 2025 & 2033
- Figure 41: Middle East & Africa UAE Solar Energy Industry Revenue Share (%), by Technology 2025 & 2033
- Figure 42: Middle East & Africa UAE Solar Energy Industry Volume Share (%), by Technology 2025 & 2033
- Figure 43: Middle East & Africa UAE Solar Energy Industry Revenue (billion), by Deployment 2025 & 2033
- Figure 44: Middle East & Africa UAE Solar Energy Industry Volume (gigawatt), by Deployment 2025 & 2033
- Figure 45: Middle East & Africa UAE Solar Energy Industry Revenue Share (%), by Deployment 2025 & 2033
- Figure 46: Middle East & Africa UAE Solar Energy Industry Volume Share (%), by Deployment 2025 & 2033
- Figure 47: Middle East & Africa UAE Solar Energy Industry Revenue (billion), by Country 2025 & 2033
- Figure 48: Middle East & Africa UAE Solar Energy Industry Volume (gigawatt), by Country 2025 & 2033
- Figure 49: Middle East & Africa UAE Solar Energy Industry Revenue Share (%), by Country 2025 & 2033
- Figure 50: Middle East & Africa UAE Solar Energy Industry Volume Share (%), by Country 2025 & 2033
- Figure 51: Asia Pacific UAE Solar Energy Industry Revenue (billion), by Technology 2025 & 2033
- Figure 52: Asia Pacific UAE Solar Energy Industry Volume (gigawatt), by Technology 2025 & 2033
- Figure 53: Asia Pacific UAE Solar Energy Industry Revenue Share (%), by Technology 2025 & 2033
- Figure 54: Asia Pacific UAE Solar Energy Industry Volume Share (%), by Technology 2025 & 2033
- Figure 55: Asia Pacific UAE Solar Energy Industry Revenue (billion), by Deployment 2025 & 2033
- Figure 56: Asia Pacific UAE Solar Energy Industry Volume (gigawatt), by Deployment 2025 & 2033
- Figure 57: Asia Pacific UAE Solar Energy Industry Revenue Share (%), by Deployment 2025 & 2033
- Figure 58: Asia Pacific UAE Solar Energy Industry Volume Share (%), by Deployment 2025 & 2033
- Figure 59: Asia Pacific UAE Solar Energy Industry Revenue (billion), by Country 2025 & 2033
- Figure 60: Asia Pacific UAE Solar Energy Industry Volume (gigawatt), by Country 2025 & 2033
- Figure 61: Asia Pacific UAE Solar Energy Industry Revenue Share (%), by Country 2025 & 2033
- Figure 62: Asia Pacific UAE Solar Energy Industry Volume Share (%), by Country 2025 & 2033
List of Tables
- Table 1: Global UAE Solar Energy Industry Revenue billion Forecast, by Technology 2020 & 2033
- Table 2: Global UAE Solar Energy Industry Volume gigawatt Forecast, by Technology 2020 & 2033
- Table 3: Global UAE Solar Energy Industry Revenue billion Forecast, by Deployment 2020 & 2033
- Table 4: Global UAE Solar Energy Industry Volume gigawatt Forecast, by Deployment 2020 & 2033
- Table 5: Global UAE Solar Energy Industry Revenue billion Forecast, by Region 2020 & 2033
- Table 6: Global UAE Solar Energy Industry Volume gigawatt Forecast, by Region 2020 & 2033
- Table 7: Global UAE Solar Energy Industry Revenue billion Forecast, by Technology 2020 & 2033
- Table 8: Global UAE Solar Energy Industry Volume gigawatt Forecast, by Technology 2020 & 2033
- Table 9: Global UAE Solar Energy Industry Revenue billion Forecast, by Deployment 2020 & 2033
- Table 10: Global UAE Solar Energy Industry Volume gigawatt Forecast, by Deployment 2020 & 2033
- Table 11: Global UAE Solar Energy Industry Revenue billion Forecast, by Country 2020 & 2033
- Table 12: Global UAE Solar Energy Industry Volume gigawatt Forecast, by Country 2020 & 2033
- Table 13: United States UAE Solar Energy Industry Revenue (billion) Forecast, by Application 2020 & 2033
- Table 14: United States UAE Solar Energy Industry Volume (gigawatt) Forecast, by Application 2020 & 2033
- Table 15: Canada UAE Solar Energy Industry Revenue (billion) Forecast, by Application 2020 & 2033
- Table 16: Canada UAE Solar Energy Industry Volume (gigawatt) Forecast, by Application 2020 & 2033
- Table 17: Mexico UAE Solar Energy Industry Revenue (billion) Forecast, by Application 2020 & 2033
- Table 18: Mexico UAE Solar Energy Industry Volume (gigawatt) Forecast, by Application 2020 & 2033
- Table 19: Global UAE Solar Energy Industry Revenue billion Forecast, by Technology 2020 & 2033
- Table 20: Global UAE Solar Energy Industry Volume gigawatt Forecast, by Technology 2020 & 2033
- Table 21: Global UAE Solar Energy Industry Revenue billion Forecast, by Deployment 2020 & 2033
- Table 22: Global UAE Solar Energy Industry Volume gigawatt Forecast, by Deployment 2020 & 2033
- Table 23: Global UAE Solar Energy Industry Revenue billion Forecast, by Country 2020 & 2033
- Table 24: Global UAE Solar Energy Industry Volume gigawatt Forecast, by Country 2020 & 2033
- Table 25: Brazil UAE Solar Energy Industry Revenue (billion) Forecast, by Application 2020 & 2033
- Table 26: Brazil UAE Solar Energy Industry Volume (gigawatt) Forecast, by Application 2020 & 2033
- Table 27: Argentina UAE Solar Energy Industry Revenue (billion) Forecast, by Application 2020 & 2033
- Table 28: Argentina UAE Solar Energy Industry Volume (gigawatt) Forecast, by Application 2020 & 2033
- Table 29: Rest of South America UAE Solar Energy Industry Revenue (billion) Forecast, by Application 2020 & 2033
- Table 30: Rest of South America UAE Solar Energy Industry Volume (gigawatt) Forecast, by Application 2020 & 2033
- Table 31: Global UAE Solar Energy Industry Revenue billion Forecast, by Technology 2020 & 2033
- Table 32: Global UAE Solar Energy Industry Volume gigawatt Forecast, by Technology 2020 & 2033
- Table 33: Global UAE Solar Energy Industry Revenue billion Forecast, by Deployment 2020 & 2033
- Table 34: Global UAE Solar Energy Industry Volume gigawatt Forecast, by Deployment 2020 & 2033
- Table 35: Global UAE Solar Energy Industry Revenue billion Forecast, by Country 2020 & 2033
- Table 36: Global UAE Solar Energy Industry Volume gigawatt Forecast, by Country 2020 & 2033
- Table 37: United Kingdom UAE Solar Energy Industry Revenue (billion) Forecast, by Application 2020 & 2033
- Table 38: United Kingdom UAE Solar Energy Industry Volume (gigawatt) Forecast, by Application 2020 & 2033
- Table 39: Germany UAE Solar Energy Industry Revenue (billion) Forecast, by Application 2020 & 2033
- Table 40: Germany UAE Solar Energy Industry Volume (gigawatt) Forecast, by Application 2020 & 2033
- Table 41: France UAE Solar Energy Industry Revenue (billion) Forecast, by Application 2020 & 2033
- Table 42: France UAE Solar Energy Industry Volume (gigawatt) Forecast, by Application 2020 & 2033
- Table 43: Italy UAE Solar Energy Industry Revenue (billion) Forecast, by Application 2020 & 2033
- Table 44: Italy UAE Solar Energy Industry Volume (gigawatt) Forecast, by Application 2020 & 2033
- Table 45: Spain UAE Solar Energy Industry Revenue (billion) Forecast, by Application 2020 & 2033
- Table 46: Spain UAE Solar Energy Industry Volume (gigawatt) Forecast, by Application 2020 & 2033
- Table 47: Russia UAE Solar Energy Industry Revenue (billion) Forecast, by Application 2020 & 2033
- Table 48: Russia UAE Solar Energy Industry Volume (gigawatt) Forecast, by Application 2020 & 2033
- Table 49: Benelux UAE Solar Energy Industry Revenue (billion) Forecast, by Application 2020 & 2033
- Table 50: Benelux UAE Solar Energy Industry Volume (gigawatt) Forecast, by Application 2020 & 2033
- Table 51: Nordics UAE Solar Energy Industry Revenue (billion) Forecast, by Application 2020 & 2033
- Table 52: Nordics UAE Solar Energy Industry Volume (gigawatt) Forecast, by Application 2020 & 2033
- Table 53: Rest of Europe UAE Solar Energy Industry Revenue (billion) Forecast, by Application 2020 & 2033
- Table 54: Rest of Europe UAE Solar Energy Industry Volume (gigawatt) Forecast, by Application 2020 & 2033
- Table 55: Global UAE Solar Energy Industry Revenue billion Forecast, by Technology 2020 & 2033
- Table 56: Global UAE Solar Energy Industry Volume gigawatt Forecast, by Technology 2020 & 2033
- Table 57: Global UAE Solar Energy Industry Revenue billion Forecast, by Deployment 2020 & 2033
- Table 58: Global UAE Solar Energy Industry Volume gigawatt Forecast, by Deployment 2020 & 2033
- Table 59: Global UAE Solar Energy Industry Revenue billion Forecast, by Country 2020 & 2033
- Table 60: Global UAE Solar Energy Industry Volume gigawatt Forecast, by Country 2020 & 2033
- Table 61: Turkey UAE Solar Energy Industry Revenue (billion) Forecast, by Application 2020 & 2033
- Table 62: Turkey UAE Solar Energy Industry Volume (gigawatt) Forecast, by Application 2020 & 2033
- Table 63: Israel UAE Solar Energy Industry Revenue (billion) Forecast, by Application 2020 & 2033
- Table 64: Israel UAE Solar Energy Industry Volume (gigawatt) Forecast, by Application 2020 & 2033
- Table 65: GCC UAE Solar Energy Industry Revenue (billion) Forecast, by Application 2020 & 2033
- Table 66: GCC UAE Solar Energy Industry Volume (gigawatt) Forecast, by Application 2020 & 2033
- Table 67: North Africa UAE Solar Energy Industry Revenue (billion) Forecast, by Application 2020 & 2033
- Table 68: North Africa UAE Solar Energy Industry Volume (gigawatt) Forecast, by Application 2020 & 2033
- Table 69: South Africa UAE Solar Energy Industry Revenue (billion) Forecast, by Application 2020 & 2033
- Table 70: South Africa UAE Solar Energy Industry Volume (gigawatt) Forecast, by Application 2020 & 2033
- Table 71: Rest of Middle East & Africa UAE Solar Energy Industry Revenue (billion) Forecast, by Application 2020 & 2033
- Table 72: Rest of Middle East & Africa UAE Solar Energy Industry Volume (gigawatt) Forecast, by Application 2020 & 2033
- Table 73: Global UAE Solar Energy Industry Revenue billion Forecast, by Technology 2020 & 2033
- Table 74: Global UAE Solar Energy Industry Volume gigawatt Forecast, by Technology 2020 & 2033
- Table 75: Global UAE Solar Energy Industry Revenue billion Forecast, by Deployment 2020 & 2033
- Table 76: Global UAE Solar Energy Industry Volume gigawatt Forecast, by Deployment 2020 & 2033
- Table 77: Global UAE Solar Energy Industry Revenue billion Forecast, by Country 2020 & 2033
- Table 78: Global UAE Solar Energy Industry Volume gigawatt Forecast, by Country 2020 & 2033
- Table 79: China UAE Solar Energy Industry Revenue (billion) Forecast, by Application 2020 & 2033
- Table 80: China UAE Solar Energy Industry Volume (gigawatt) Forecast, by Application 2020 & 2033
- Table 81: India UAE Solar Energy Industry Revenue (billion) Forecast, by Application 2020 & 2033
- Table 82: India UAE Solar Energy Industry Volume (gigawatt) Forecast, by Application 2020 & 2033
- Table 83: Japan UAE Solar Energy Industry Revenue (billion) Forecast, by Application 2020 & 2033
- Table 84: Japan UAE Solar Energy Industry Volume (gigawatt) Forecast, by Application 2020 & 2033
- Table 85: South Korea UAE Solar Energy Industry Revenue (billion) Forecast, by Application 2020 & 2033
- Table 86: South Korea UAE Solar Energy Industry Volume (gigawatt) Forecast, by Application 2020 & 2033
- Table 87: ASEAN UAE Solar Energy Industry Revenue (billion) Forecast, by Application 2020 & 2033
- Table 88: ASEAN UAE Solar Energy Industry Volume (gigawatt) Forecast, by Application 2020 & 2033
- Table 89: Oceania UAE Solar Energy Industry Revenue (billion) Forecast, by Application 2020 & 2033
- Table 90: Oceania UAE Solar Energy Industry Volume (gigawatt) Forecast, by Application 2020 & 2033
- Table 91: Rest of Asia Pacific UAE Solar Energy Industry Revenue (billion) Forecast, by Application 2020 & 2033
- Table 92: Rest of Asia Pacific UAE Solar Energy Industry Volume (gigawatt) Forecast, by Application 2020 & 2033
Frequently Asked Questions
1. What is the projected Compound Annual Growth Rate (CAGR) of the UAE Solar Energy Industry?
The projected CAGR is approximately 22.33%.
2. Which companies are prominent players in the UAE Solar Energy Industry?
Key companies in the market include JinkoSolar Holding Co Ltd, Sunergy Solar, CleanMax Mena FZCO*List Not Exhaustive, Canadian Solar Inc, City Solar, Masdar (Abu Dhabi Future Energy Company), MAYSUN SOLAR FZCO, Enerwhere, ACWA Power.
3. What are the main segments of the UAE Solar Energy Industry?
The market segments include Technology, Deployment.
4. Can you provide details about the market size?
The market size is estimated to be USD 10.3 billion as of 2022.
5. What are some drivers contributing to market growth?
4.; Rising Government Policies to Support Solar PV Installation4.; Rising Installation of Renewable Energy to Reduce Dependency on Fossil Fuels.
6. What are the notable trends driving market growth?
Solar Photovoltaic to Dominate the Market.
7. Are there any restraints impacting market growth?
4.; Rising Adoption of Alternative Clean Energy Sources such as Wind. Geothermal. Bioenergy. and Others.
8. Can you provide examples of recent developments in the market?
May 2023: ADNOC Distribution announced a key partnership with Emerge, a joint venture between EDF and Masdar, to develop on-site solar power across its service station network. The project will commence in Dubai in 2023 to generate clean energy.
9. What pricing options are available for accessing the report?
Pricing options include single-user, multi-user, and enterprise licenses priced at USD 3800, USD 4500, and USD 5800 respectively.
10. Is the market size provided in terms of value or volume?
The market size is provided in terms of value, measured in billion and volume, measured in gigawatt.
11. Are there any specific market keywords associated with the report?
Yes, the market keyword associated with the report is "UAE Solar Energy Industry," which aids in identifying and referencing the specific market segment covered.
12. How do I determine which pricing option suits my needs best?
The pricing options vary based on user requirements and access needs. Individual users may opt for single-user licenses, while businesses requiring broader access may choose multi-user or enterprise licenses for cost-effective access to the report.
13. Are there any additional resources or data provided in the UAE Solar Energy Industry report?
While the report offers comprehensive insights, it's advisable to review the specific contents or supplementary materials provided to ascertain if additional resources or data are available.
14. How can I stay updated on further developments or reports in the UAE Solar Energy Industry?
To stay informed about further developments, trends, and reports in the UAE Solar Energy Industry, consider subscribing to industry newsletters, following relevant companies and organizations, or regularly checking reputable industry news sources and publications.
Methodology
Step 1 - Identification of Relevant Samples Size from Population Database


Step 2 - Approaches for Defining Global Market Size (Value, Volume* & Price*)

Note*: In applicable scenarios
Step 3 - Data Sources
Primary Research
- Web Analytics
- Survey Reports
- Research Institute
- Latest Research Reports
- Opinion Leaders
Secondary Research
- Annual Reports
- White Paper
- Latest Press Release
- Industry Association
- Paid Database
- Investor Presentations

Step 4 - Data Triangulation
Involves using different sources of information in order to increase the validity of a study
These sources are likely to be stakeholders in a program - participants, other researchers, program staff, other community members, and so on.
Then we put all data in single framework & apply various statistical tools to find out the dynamic on the market.
During the analysis stage, feedback from the stakeholder groups would be compared to determine areas of agreement as well as areas of divergence