Key Insights
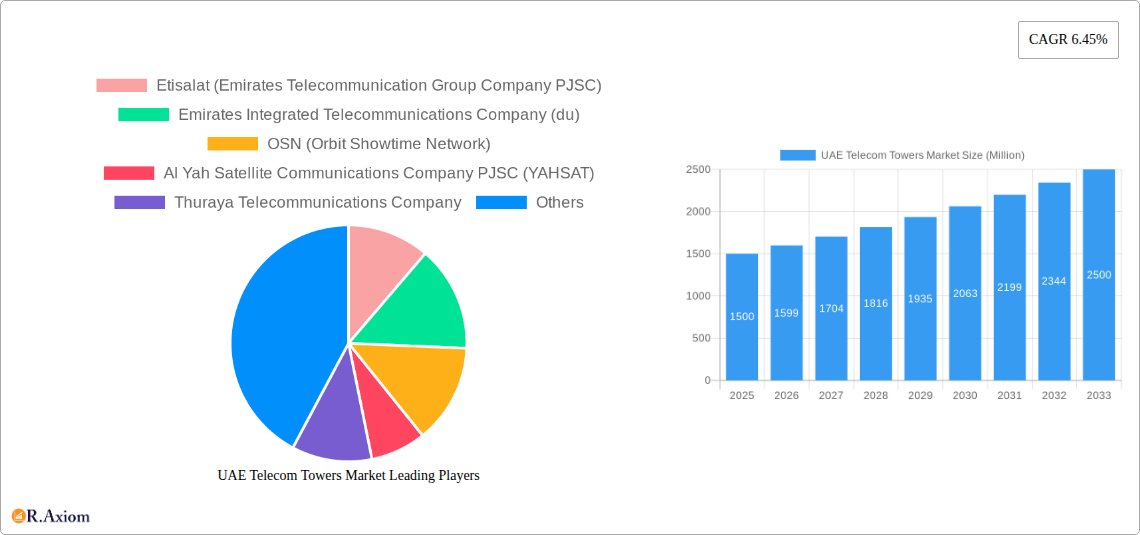
The United Arab Emirates (UAE) telecom tower market is projected for substantial growth, with a Compound Annual Growth Rate (CAGR) of 3.15%. This expansion, set from 2025 to 2033, is fueled by escalating demand for high-speed data, the widespread adoption of 5G networks, and ongoing national infrastructure development. Leading operators such as Etisalat, du, and Yahsat are strategically investing in tower infrastructure to support a growing subscriber base for mobile and broadband services. The increasing deployment of IoT devices and the advancement of smart city initiatives further necessitate the expansion of telecom tower networks to ensure pervasive connectivity. While regulatory complexities and land acquisition may present challenges, the market outlook remains highly positive, driven by technological innovations and strong government backing for digital transformation.
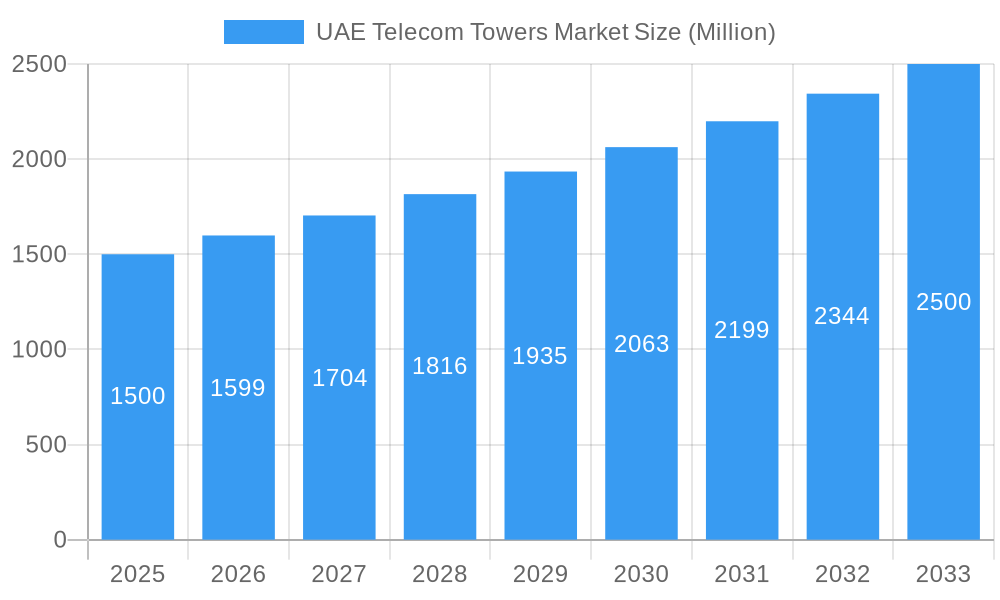
UAE Telecom Towers Market Market Size (In Billion)
Market segmentation is anticipated to include macrocell towers, small cells, and rooftop installations, each addressing distinct network requirements. The rapid rollout of 5G is expected to drive significant demand for small cells and distributed antenna systems (DAS). Strategic alliances between tower infrastructure providers and Mobile Network Operators (MNOs) are pivotal to market expansion. The UAE Telecom Towers market is forecasted to reach approximately 9.67 billion by 2033, propelled by consistent population growth, rising smartphone penetration, and continuous 4G and 5G network expansion. Based on the base year of 2025 and an estimated market size of 9.67 billion, the growth trajectory is clearly defined.
UAE Telecom Towers Market Company Market Share
This comprehensive report delivers an in-depth analysis of the UAE Telecom Towers Market, encompassing market size, segmentation, key players, growth drivers, challenges, and future prospects. The analysis covers the period from 2019 to 2033, with 2025 identified as the base year. This research is essential for telecom operators, tower companies, investors, and regulatory bodies aiming to understand and strategically engage with this evolving market.
UAE Telecom Towers Market Concentration & Innovation
The UAE telecom towers market exhibits a moderately concentrated landscape, dominated by a few major players alongside several smaller, specialized companies. Etisalat and du, the two major telecom operators, directly or indirectly control a significant portion of the tower infrastructure. However, independent tower companies like Helios Towers and IHS Towers are increasingly active, fostering competition and driving innovation. The market share of these key players is estimated at xx% for Etisalat, xx% for du, and xx% for other independent players (combined) in 2025.
Market innovation is driven by several factors: the increasing demand for 5G network infrastructure, the growing adoption of small cells and distributed antenna systems (DAS), and the ongoing technological advancements in tower design and construction. The regulatory framework in the UAE, while generally supportive of telecom infrastructure development, also presents challenges in terms of licensing and spectrum allocation. Substitutes for traditional telecom towers, such as rooftop deployments and distributed antenna systems (DAS), are gaining traction but have not yet significantly disrupted the market. End-user trends, such as the growing demand for higher data speeds and improved network coverage, underpin the need for further investment in telecom towers.
M&A activity in the sector has been relatively modest in recent years, although there is potential for consolidation as companies seek to expand their footprint and optimize their network infrastructure. The value of M&A deals in the UAE telecom towers market during the historical period (2019-2024) is estimated at approximately xx Million.
UAE Telecom Towers Market Industry Trends & Insights
The UAE Telecom Towers market is experiencing robust growth, fueled by the rising adoption of mobile broadband services, the expansion of 5G networks, and the increasing demand for high-speed internet access. The market is projected to exhibit a Compound Annual Growth Rate (CAGR) of xx% during the forecast period (2025-2033), reaching a market size of xx Million by 2033. This growth is underpinned by significant investments in network infrastructure by telecom operators and the government's commitment to fostering a robust digital economy. Technological disruptions, such as the deployment of 5G and the increasing adoption of small cells and DAS, are reshaping the market, creating opportunities for new entrants and technologies. Consumer preferences are increasingly focused on seamless connectivity, high data speeds, and reliable network performance. Competitive dynamics are shaped by the interplay between major telecom operators, independent tower companies, and infrastructure providers. Market penetration of 4G and 5G technologies continues to increase, further driving demand for additional towers and upgrades to existing infrastructure.
Dominant Markets & Segments in UAE Telecom Towers Market
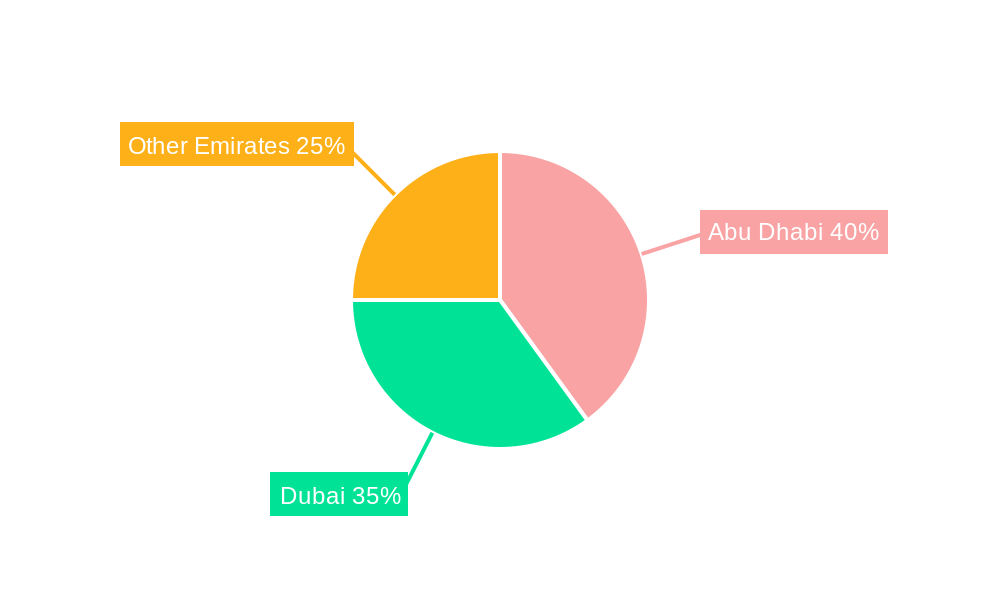
The UAE's major urban centers, including Dubai, Abu Dhabi, Sharjah, and Ajman, represent the most dominant markets for telecom towers. These areas experience high population density, extensive mobile network usage, and significant commercial activity, resulting in a high concentration of towers and infrastructure.
- Key Drivers of Dominance:
- High population density and mobile penetration rates.
- Strong economic activity and investment in infrastructure.
- Government support for digital infrastructure development.
- Favorable regulatory environment.
This dominance is expected to continue during the forecast period, driven by sustained economic growth and ongoing investments in infrastructure. The market is further segmented by tower type (macrocells, microcells, small cells), technology (2G, 3G, 4G, 5G), and ownership (owned, leased). The macrocell segment holds the largest share, while the 5G technology segment is witnessing the fastest growth.
UAE Telecom Towers Market Product Developments
Recent product innovations in the UAE telecom towers market include the deployment of 5G-ready towers, the increasing adoption of small cells and DAS, and the development of environmentally friendly tower designs. These advancements are driven by the need for enhanced network capacity, improved coverage, and reduced environmental impact. The competitive advantage lies in offering cost-effective, high-performance, and sustainable solutions that meet the evolving needs of telecom operators.
Report Scope & Segmentation Analysis
This report segments the UAE telecom towers market based on several key parameters. The geographic segmentation covers the major emirates of the UAE. Technological segmentation includes 2G, 3G, 4G, and 5G technologies, reflecting the ongoing network upgrades. Further segmentation is based on tower ownership (owned, leased), tower type (macrocells, microcells, small cells), and application (mobile networks, broadcasting). Each segment’s growth projection, market size, and competitive dynamics are analyzed in detail within the report.
Key Drivers of UAE Telecom Towers Market Growth
Several factors are driving the growth of the UAE telecom towers market. These include:
- Increasing mobile penetration: The UAE has a high mobile penetration rate, necessitating robust infrastructure to support the growing number of users.
- 5G network rollout: The deployment of 5G requires significant investment in new towers and infrastructure upgrades.
- Government support: The government's investment in digital infrastructure projects fuels market expansion.
- Growing demand for data: Increased data consumption necessitates a more extensive and efficient tower network.
Challenges in the UAE Telecom Towers Market Sector
The UAE telecom towers market faces several challenges:
- High initial investment costs: Building and maintaining tower infrastructure involves significant capital expenditure.
- Land acquisition and regulatory hurdles: Securing permits and land for tower construction can be time-consuming and costly.
- Competition: The increasing number of players in the market heightens competitive pressure.
Emerging Opportunities in UAE Telecom Towers Market
Opportunities exist in several areas:
- 5G and beyond: Expansion into newer generations of mobile networks creates significant demand for new towers.
- Private network deployments: The growing adoption of private networks in various sectors presents new market segments.
- Smart city initiatives: The UAE's smart city initiatives require robust telecommunication infrastructure.
Leading Players in the UAE Telecom Towers Market Market
- Etisalat (Emirates Telecommunication Group Company PJSC)
- Emirates Integrated Telecommunications Company (du)
- OSN (Orbit Showtime Network)
- Al Yah Satellite Communications Company PJSC (YAHSAT)
- Thuraya Telecommunications Company
- Helios Towers
- IHS Towers
- NXN Group
- Inteltec Emirates
- Gulf Bridge International (GBI)
Key Developments in UAE Telecom Towers Market Industry
- June 2024: The TDRA's CHF 1.9 Million (USD 2.21 Million) contribution to the ITU will enhance global radiocommunication databases and support efficient frequency allocation, indirectly benefiting the UAE's telecom tower sector.
- May 2024: Sterlite Technologies' partnership with du to supply advanced optical fiber cables will improve network performance, indirectly boosting demand for efficient tower placements and integration.
Strategic Outlook for UAE Telecom Towers Market Market
The UAE telecom towers market is poised for continued growth, driven by strong government support, increasing mobile penetration, and the ongoing rollout of 5G networks. The market's future potential lies in exploiting the opportunities presented by private networks, smart city developments, and the deployment of advanced technologies such as small cells and DAS. Strategic partnerships and collaborations will play a vital role in shaping the future landscape of the UAE telecom towers market.
UAE Telecom Towers Market Segmentation
-
1. Ownership
- 1.1. Operator-owned
- 1.2. Private-owned
- 1.3. MNO Captive sites
-
2. Installation
- 2.1. Rooftop
- 2.2. Ground-based
-
3. Fuel Type
- 3.1. Renewable
- 3.2. Non-renewable
UAE Telecom Towers Market Segmentation By Geography
-
1. North America
- 1.1. United States
- 1.2. Canada
- 1.3. Mexico
-
2. South America
- 2.1. Brazil
- 2.2. Argentina
- 2.3. Rest of South America
-
3. Europe
- 3.1. United Kingdom
- 3.2. Germany
- 3.3. France
- 3.4. Italy
- 3.5. Spain
- 3.6. Russia
- 3.7. Benelux
- 3.8. Nordics
- 3.9. Rest of Europe
-
4. Middle East & Africa
- 4.1. Turkey
- 4.2. Israel
- 4.3. GCC
- 4.4. North Africa
- 4.5. South Africa
- 4.6. Rest of Middle East & Africa
-
5. Asia Pacific
- 5.1. China
- 5.2. India
- 5.3. Japan
- 5.4. South Korea
- 5.5. ASEAN
- 5.6. Oceania
- 5.7. Rest of Asia Pacific
UAE Telecom Towers Market Regional Market Share
Geographic Coverage of UAE Telecom Towers Market
UAE Telecom Towers Market REPORT HIGHLIGHTS
| Aspects | Details |
|---|---|
| Study Period | 2020-2034 |
| Base Year | 2025 |
| Estimated Year | 2026 |
| Forecast Period | 2026-2034 |
| Historical Period | 2020-2025 |
| Growth Rate | CAGR of 3.15% from 2020-2034 |
| Segmentation |
|
Table of Contents
- 1. Introduction
- 1.1. Research Scope
- 1.2. Market Segmentation
- 1.3. Research Objective
- 1.4. Definitions and Assumptions
- 2. Executive Summary
- 2.1. Market Snapshot
- 3. Market Dynamics
- 3.1. Market Drivers
- 3.2. Market Restrains
- 3.3. Market Trends
- 3.4. Market Opportunities
- 4. Market Factor Analysis
- 4.1. Porters Five Forces
- 4.1.1. Bargaining Power of Suppliers
- 4.1.2. Bargaining Power of Buyers
- 4.1.3. Threat of New Entrants
- 4.1.4. Threat of Substitutes
- 4.1.5. Competitive Rivalry
- 4.2. PESTEL analysis
- 4.3. BCG Analysis
- 4.3.1. Stars (High Growth, High Market Share)
- 4.3.2. Cash Cows (Low Growth, High Market Share)
- 4.3.3. Question Mark (High Growth, Low Market Share)
- 4.3.4. Dogs (Low Growth, Low Market Share)
- 4.4. Ansoff Matrix Analysis
- 4.5. Supply Chain Analysis
- 4.6. Regulatory Landscape
- 4.7. Current Market Potential and Opportunity Assessment (TAM–SAM–SOM Framework)
- 4.8. RAX Analyst Note
- 4.1. Porters Five Forces
- 5. Market Analysis, Insights and Forecast 2021-2033
- 5.1. Market Analysis, Insights and Forecast - by Ownership
- 5.1.1. Operator-owned
- 5.1.2. Private-owned
- 5.1.3. MNO Captive sites
- 5.2. Market Analysis, Insights and Forecast - by Installation
- 5.2.1. Rooftop
- 5.2.2. Ground-based
- 5.3. Market Analysis, Insights and Forecast - by Fuel Type
- 5.3.1. Renewable
- 5.3.2. Non-renewable
- 5.4. Market Analysis, Insights and Forecast - by Region
- 5.4.1. North America
- 5.4.2. South America
- 5.4.3. Europe
- 5.4.4. Middle East & Africa
- 5.4.5. Asia Pacific
- 5.1. Market Analysis, Insights and Forecast - by Ownership
- 6. Global UAE Telecom Towers Market Analysis, Insights and Forecast, 2021-2033
- 6.1. Market Analysis, Insights and Forecast - by Ownership
- 6.1.1. Operator-owned
- 6.1.2. Private-owned
- 6.1.3. MNO Captive sites
- 6.2. Market Analysis, Insights and Forecast - by Installation
- 6.2.1. Rooftop
- 6.2.2. Ground-based
- 6.3. Market Analysis, Insights and Forecast - by Fuel Type
- 6.3.1. Renewable
- 6.3.2. Non-renewable
- 6.1. Market Analysis, Insights and Forecast - by Ownership
- 7. North America UAE Telecom Towers Market Analysis, Insights and Forecast, 2020-2032
- 7.1. Market Analysis, Insights and Forecast - by Ownership
- 7.1.1. Operator-owned
- 7.1.2. Private-owned
- 7.1.3. MNO Captive sites
- 7.2. Market Analysis, Insights and Forecast - by Installation
- 7.2.1. Rooftop
- 7.2.2. Ground-based
- 7.3. Market Analysis, Insights and Forecast - by Fuel Type
- 7.3.1. Renewable
- 7.3.2. Non-renewable
- 7.1. Market Analysis, Insights and Forecast - by Ownership
- 8. South America UAE Telecom Towers Market Analysis, Insights and Forecast, 2020-2032
- 8.1. Market Analysis, Insights and Forecast - by Ownership
- 8.1.1. Operator-owned
- 8.1.2. Private-owned
- 8.1.3. MNO Captive sites
- 8.2. Market Analysis, Insights and Forecast - by Installation
- 8.2.1. Rooftop
- 8.2.2. Ground-based
- 8.3. Market Analysis, Insights and Forecast - by Fuel Type
- 8.3.1. Renewable
- 8.3.2. Non-renewable
- 8.1. Market Analysis, Insights and Forecast - by Ownership
- 9. Europe UAE Telecom Towers Market Analysis, Insights and Forecast, 2020-2032
- 9.1. Market Analysis, Insights and Forecast - by Ownership
- 9.1.1. Operator-owned
- 9.1.2. Private-owned
- 9.1.3. MNO Captive sites
- 9.2. Market Analysis, Insights and Forecast - by Installation
- 9.2.1. Rooftop
- 9.2.2. Ground-based
- 9.3. Market Analysis, Insights and Forecast - by Fuel Type
- 9.3.1. Renewable
- 9.3.2. Non-renewable
- 9.1. Market Analysis, Insights and Forecast - by Ownership
- 10. Middle East & Africa UAE Telecom Towers Market Analysis, Insights and Forecast, 2020-2032
- 10.1. Market Analysis, Insights and Forecast - by Ownership
- 10.1.1. Operator-owned
- 10.1.2. Private-owned
- 10.1.3. MNO Captive sites
- 10.2. Market Analysis, Insights and Forecast - by Installation
- 10.2.1. Rooftop
- 10.2.2. Ground-based
- 10.3. Market Analysis, Insights and Forecast - by Fuel Type
- 10.3.1. Renewable
- 10.3.2. Non-renewable
- 10.1. Market Analysis, Insights and Forecast - by Ownership
- 11. Asia Pacific UAE Telecom Towers Market Analysis, Insights and Forecast, 2020-2032
- 11.1. Market Analysis, Insights and Forecast - by Ownership
- 11.1.1. Operator-owned
- 11.1.2. Private-owned
- 11.1.3. MNO Captive sites
- 11.2. Market Analysis, Insights and Forecast - by Installation
- 11.2.1. Rooftop
- 11.2.2. Ground-based
- 11.3. Market Analysis, Insights and Forecast - by Fuel Type
- 11.3.1. Renewable
- 11.3.2. Non-renewable
- 11.1. Market Analysis, Insights and Forecast - by Ownership
- 12. Competitive Analysis
- 12.1. Company Profiles
- 12.1.1 Etisalat (Emirates Telecommunication Group Company PJSC)
- 12.1.1.1. Company Overview
- 12.1.1.2. Products
- 12.1.1.3. Company Financials
- 12.1.1.4. SWOT Analysis
- 12.1.2 Emirates Integrated Telecommunications Company (du)
- 12.1.2.1. Company Overview
- 12.1.2.2. Products
- 12.1.2.3. Company Financials
- 12.1.2.4. SWOT Analysis
- 12.1.3 OSN (Orbit Showtime Network)
- 12.1.3.1. Company Overview
- 12.1.3.2. Products
- 12.1.3.3. Company Financials
- 12.1.3.4. SWOT Analysis
- 12.1.4 Al Yah Satellite Communications Company PJSC (YAHSAT)
- 12.1.4.1. Company Overview
- 12.1.4.2. Products
- 12.1.4.3. Company Financials
- 12.1.4.4. SWOT Analysis
- 12.1.5 Thuraya Telecommunications Company
- 12.1.5.1. Company Overview
- 12.1.5.2. Products
- 12.1.5.3. Company Financials
- 12.1.5.4. SWOT Analysis
- 12.1.6 Helios Towers
- 12.1.6.1. Company Overview
- 12.1.6.2. Products
- 12.1.6.3. Company Financials
- 12.1.6.4. SWOT Analysis
- 12.1.7 IHS Towers
- 12.1.7.1. Company Overview
- 12.1.7.2. Products
- 12.1.7.3. Company Financials
- 12.1.7.4. SWOT Analysis
- 12.1.8 NXN Group
- 12.1.8.1. Company Overview
- 12.1.8.2. Products
- 12.1.8.3. Company Financials
- 12.1.8.4. SWOT Analysis
- 12.1.9 Inteltec Emirates
- 12.1.9.1. Company Overview
- 12.1.9.2. Products
- 12.1.9.3. Company Financials
- 12.1.9.4. SWOT Analysis
- 12.1.10 Gulf Bridge International (GBI
- 12.1.10.1. Company Overview
- 12.1.10.2. Products
- 12.1.10.3. Company Financials
- 12.1.10.4. SWOT Analysis
- 12.1.1 Etisalat (Emirates Telecommunication Group Company PJSC)
- 12.2. Market Entropy
- 12.2.1 Company's Key Areas Served
- 12.2.2 Recent Developments
- 12.3. Company Market Share Analysis 2025
- 12.3.1 Top 5 Companies Market Share Analysis
- 12.3.2 Top 3 Companies Market Share Analysis
- 12.4. List of Potential Customers
- 13. Research Methodology
List of Figures
- Figure 1: Global UAE Telecom Towers Market Revenue Breakdown (billion, %) by Region 2025 & 2033
- Figure 2: North America UAE Telecom Towers Market Revenue (billion), by Ownership 2025 & 2033
- Figure 3: North America UAE Telecom Towers Market Revenue Share (%), by Ownership 2025 & 2033
- Figure 4: North America UAE Telecom Towers Market Revenue (billion), by Installation 2025 & 2033
- Figure 5: North America UAE Telecom Towers Market Revenue Share (%), by Installation 2025 & 2033
- Figure 6: North America UAE Telecom Towers Market Revenue (billion), by Fuel Type 2025 & 2033
- Figure 7: North America UAE Telecom Towers Market Revenue Share (%), by Fuel Type 2025 & 2033
- Figure 8: North America UAE Telecom Towers Market Revenue (billion), by Country 2025 & 2033
- Figure 9: North America UAE Telecom Towers Market Revenue Share (%), by Country 2025 & 2033
- Figure 10: South America UAE Telecom Towers Market Revenue (billion), by Ownership 2025 & 2033
- Figure 11: South America UAE Telecom Towers Market Revenue Share (%), by Ownership 2025 & 2033
- Figure 12: South America UAE Telecom Towers Market Revenue (billion), by Installation 2025 & 2033
- Figure 13: South America UAE Telecom Towers Market Revenue Share (%), by Installation 2025 & 2033
- Figure 14: South America UAE Telecom Towers Market Revenue (billion), by Fuel Type 2025 & 2033
- Figure 15: South America UAE Telecom Towers Market Revenue Share (%), by Fuel Type 2025 & 2033
- Figure 16: South America UAE Telecom Towers Market Revenue (billion), by Country 2025 & 2033
- Figure 17: South America UAE Telecom Towers Market Revenue Share (%), by Country 2025 & 2033
- Figure 18: Europe UAE Telecom Towers Market Revenue (billion), by Ownership 2025 & 2033
- Figure 19: Europe UAE Telecom Towers Market Revenue Share (%), by Ownership 2025 & 2033
- Figure 20: Europe UAE Telecom Towers Market Revenue (billion), by Installation 2025 & 2033
- Figure 21: Europe UAE Telecom Towers Market Revenue Share (%), by Installation 2025 & 2033
- Figure 22: Europe UAE Telecom Towers Market Revenue (billion), by Fuel Type 2025 & 2033
- Figure 23: Europe UAE Telecom Towers Market Revenue Share (%), by Fuel Type 2025 & 2033
- Figure 24: Europe UAE Telecom Towers Market Revenue (billion), by Country 2025 & 2033
- Figure 25: Europe UAE Telecom Towers Market Revenue Share (%), by Country 2025 & 2033
- Figure 26: Middle East & Africa UAE Telecom Towers Market Revenue (billion), by Ownership 2025 & 2033
- Figure 27: Middle East & Africa UAE Telecom Towers Market Revenue Share (%), by Ownership 2025 & 2033
- Figure 28: Middle East & Africa UAE Telecom Towers Market Revenue (billion), by Installation 2025 & 2033
- Figure 29: Middle East & Africa UAE Telecom Towers Market Revenue Share (%), by Installation 2025 & 2033
- Figure 30: Middle East & Africa UAE Telecom Towers Market Revenue (billion), by Fuel Type 2025 & 2033
- Figure 31: Middle East & Africa UAE Telecom Towers Market Revenue Share (%), by Fuel Type 2025 & 2033
- Figure 32: Middle East & Africa UAE Telecom Towers Market Revenue (billion), by Country 2025 & 2033
- Figure 33: Middle East & Africa UAE Telecom Towers Market Revenue Share (%), by Country 2025 & 2033
- Figure 34: Asia Pacific UAE Telecom Towers Market Revenue (billion), by Ownership 2025 & 2033
- Figure 35: Asia Pacific UAE Telecom Towers Market Revenue Share (%), by Ownership 2025 & 2033
- Figure 36: Asia Pacific UAE Telecom Towers Market Revenue (billion), by Installation 2025 & 2033
- Figure 37: Asia Pacific UAE Telecom Towers Market Revenue Share (%), by Installation 2025 & 2033
- Figure 38: Asia Pacific UAE Telecom Towers Market Revenue (billion), by Fuel Type 2025 & 2033
- Figure 39: Asia Pacific UAE Telecom Towers Market Revenue Share (%), by Fuel Type 2025 & 2033
- Figure 40: Asia Pacific UAE Telecom Towers Market Revenue (billion), by Country 2025 & 2033
- Figure 41: Asia Pacific UAE Telecom Towers Market Revenue Share (%), by Country 2025 & 2033
List of Tables
- Table 1: Global UAE Telecom Towers Market Revenue billion Forecast, by Ownership 2020 & 2033
- Table 2: Global UAE Telecom Towers Market Revenue billion Forecast, by Installation 2020 & 2033
- Table 3: Global UAE Telecom Towers Market Revenue billion Forecast, by Fuel Type 2020 & 2033
- Table 4: Global UAE Telecom Towers Market Revenue billion Forecast, by Region 2020 & 2033
- Table 5: Global UAE Telecom Towers Market Revenue billion Forecast, by Ownership 2020 & 2033
- Table 6: Global UAE Telecom Towers Market Revenue billion Forecast, by Installation 2020 & 2033
- Table 7: Global UAE Telecom Towers Market Revenue billion Forecast, by Fuel Type 2020 & 2033
- Table 8: Global UAE Telecom Towers Market Revenue billion Forecast, by Country 2020 & 2033
- Table 9: United States UAE Telecom Towers Market Revenue (billion) Forecast, by Application 2020 & 2033
- Table 10: Canada UAE Telecom Towers Market Revenue (billion) Forecast, by Application 2020 & 2033
- Table 11: Mexico UAE Telecom Towers Market Revenue (billion) Forecast, by Application 2020 & 2033
- Table 12: Global UAE Telecom Towers Market Revenue billion Forecast, by Ownership 2020 & 2033
- Table 13: Global UAE Telecom Towers Market Revenue billion Forecast, by Installation 2020 & 2033
- Table 14: Global UAE Telecom Towers Market Revenue billion Forecast, by Fuel Type 2020 & 2033
- Table 15: Global UAE Telecom Towers Market Revenue billion Forecast, by Country 2020 & 2033
- Table 16: Brazil UAE Telecom Towers Market Revenue (billion) Forecast, by Application 2020 & 2033
- Table 17: Argentina UAE Telecom Towers Market Revenue (billion) Forecast, by Application 2020 & 2033
- Table 18: Rest of South America UAE Telecom Towers Market Revenue (billion) Forecast, by Application 2020 & 2033
- Table 19: Global UAE Telecom Towers Market Revenue billion Forecast, by Ownership 2020 & 2033
- Table 20: Global UAE Telecom Towers Market Revenue billion Forecast, by Installation 2020 & 2033
- Table 21: Global UAE Telecom Towers Market Revenue billion Forecast, by Fuel Type 2020 & 2033
- Table 22: Global UAE Telecom Towers Market Revenue billion Forecast, by Country 2020 & 2033
- Table 23: United Kingdom UAE Telecom Towers Market Revenue (billion) Forecast, by Application 2020 & 2033
- Table 24: Germany UAE Telecom Towers Market Revenue (billion) Forecast, by Application 2020 & 2033
- Table 25: France UAE Telecom Towers Market Revenue (billion) Forecast, by Application 2020 & 2033
- Table 26: Italy UAE Telecom Towers Market Revenue (billion) Forecast, by Application 2020 & 2033
- Table 27: Spain UAE Telecom Towers Market Revenue (billion) Forecast, by Application 2020 & 2033
- Table 28: Russia UAE Telecom Towers Market Revenue (billion) Forecast, by Application 2020 & 2033
- Table 29: Benelux UAE Telecom Towers Market Revenue (billion) Forecast, by Application 2020 & 2033
- Table 30: Nordics UAE Telecom Towers Market Revenue (billion) Forecast, by Application 2020 & 2033
- Table 31: Rest of Europe UAE Telecom Towers Market Revenue (billion) Forecast, by Application 2020 & 2033
- Table 32: Global UAE Telecom Towers Market Revenue billion Forecast, by Ownership 2020 & 2033
- Table 33: Global UAE Telecom Towers Market Revenue billion Forecast, by Installation 2020 & 2033
- Table 34: Global UAE Telecom Towers Market Revenue billion Forecast, by Fuel Type 2020 & 2033
- Table 35: Global UAE Telecom Towers Market Revenue billion Forecast, by Country 2020 & 2033
- Table 36: Turkey UAE Telecom Towers Market Revenue (billion) Forecast, by Application 2020 & 2033
- Table 37: Israel UAE Telecom Towers Market Revenue (billion) Forecast, by Application 2020 & 2033
- Table 38: GCC UAE Telecom Towers Market Revenue (billion) Forecast, by Application 2020 & 2033
- Table 39: North Africa UAE Telecom Towers Market Revenue (billion) Forecast, by Application 2020 & 2033
- Table 40: South Africa UAE Telecom Towers Market Revenue (billion) Forecast, by Application 2020 & 2033
- Table 41: Rest of Middle East & Africa UAE Telecom Towers Market Revenue (billion) Forecast, by Application 2020 & 2033
- Table 42: Global UAE Telecom Towers Market Revenue billion Forecast, by Ownership 2020 & 2033
- Table 43: Global UAE Telecom Towers Market Revenue billion Forecast, by Installation 2020 & 2033
- Table 44: Global UAE Telecom Towers Market Revenue billion Forecast, by Fuel Type 2020 & 2033
- Table 45: Global UAE Telecom Towers Market Revenue billion Forecast, by Country 2020 & 2033
- Table 46: China UAE Telecom Towers Market Revenue (billion) Forecast, by Application 2020 & 2033
- Table 47: India UAE Telecom Towers Market Revenue (billion) Forecast, by Application 2020 & 2033
- Table 48: Japan UAE Telecom Towers Market Revenue (billion) Forecast, by Application 2020 & 2033
- Table 49: South Korea UAE Telecom Towers Market Revenue (billion) Forecast, by Application 2020 & 2033
- Table 50: ASEAN UAE Telecom Towers Market Revenue (billion) Forecast, by Application 2020 & 2033
- Table 51: Oceania UAE Telecom Towers Market Revenue (billion) Forecast, by Application 2020 & 2033
- Table 52: Rest of Asia Pacific UAE Telecom Towers Market Revenue (billion) Forecast, by Application 2020 & 2033
Frequently Asked Questions
1. What is the projected Compound Annual Growth Rate (CAGR) of the UAE Telecom Towers Market?
The projected CAGR is approximately 3.15%.
2. Which companies are prominent players in the UAE Telecom Towers Market?
Key companies in the market include Etisalat (Emirates Telecommunication Group Company PJSC), Emirates Integrated Telecommunications Company (du), OSN (Orbit Showtime Network), Al Yah Satellite Communications Company PJSC (YAHSAT), Thuraya Telecommunications Company, Helios Towers, IHS Towers, NXN Group, Inteltec Emirates, Gulf Bridge International (GBI.
3. What are the main segments of the UAE Telecom Towers Market?
The market segments include Ownership, Installation, Fuel Type.
4. Can you provide details about the market size?
The market size is estimated to be USD 9.67 billion as of 2022.
5. What are some drivers contributing to market growth?
Connecting/Improving Connectivity to Rural Areas5.1.2 5G deployments are a major catalyst for growth in the cell-tower leasing environment; Improving and Catering to Increasing Data Needs.
6. What are the notable trends driving market growth?
5G Deployment to Address the Increasing Market Demand.
7. Are there any restraints impacting market growth?
Connecting/Improving Connectivity to Rural Areas5.1.2 5G deployments are a major catalyst for growth in the cell-tower leasing environment; Improving and Catering to Increasing Data Needs.
8. Can you provide examples of recent developments in the market?
June 2024: The UAE's Telecommunications and Digital Government Regulatory Authority (TDRA) pledged a voluntary contribution of CHF 1.9 million (USD 2.21 million) to the International Telecommunication Union (ITU). This contribution stems from a surplus in the budget allocated for WRC-23, held in Dubai, UAE, late last year in 2023. The ITU plans to utilize these funds to refresh global radiocommunication databases and enhance the software applications and tools offered by the ITU Radiocommunication Bureau (BR). These upgrades will aid countries globally in applying for radio frequency assignments, aligning with the newly revised Radio Regulations (2024 Version).
9. What pricing options are available for accessing the report?
Pricing options include single-user, multi-user, and enterprise licenses priced at USD 3800, USD 4500, and USD 5800 respectively.
10. Is the market size provided in terms of value or volume?
The market size is provided in terms of value, measured in billion.
11. Are there any specific market keywords associated with the report?
Yes, the market keyword associated with the report is "UAE Telecom Towers Market," which aids in identifying and referencing the specific market segment covered.
12. How do I determine which pricing option suits my needs best?
The pricing options vary based on user requirements and access needs. Individual users may opt for single-user licenses, while businesses requiring broader access may choose multi-user or enterprise licenses for cost-effective access to the report.
13. Are there any additional resources or data provided in the UAE Telecom Towers Market report?
While the report offers comprehensive insights, it's advisable to review the specific contents or supplementary materials provided to ascertain if additional resources or data are available.
14. How can I stay updated on further developments or reports in the UAE Telecom Towers Market?
To stay informed about further developments, trends, and reports in the UAE Telecom Towers Market, consider subscribing to industry newsletters, following relevant companies and organizations, or regularly checking reputable industry news sources and publications.
Methodology
Step 1 - Identification of Relevant Samples Size from Population Database


Step 2 - Approaches for Defining Global Market Size (Value, Volume* & Price*)

Note*: In applicable scenarios
Step 3 - Data Sources
Primary Research
- Web Analytics
- Survey Reports
- Research Institute
- Latest Research Reports
- Opinion Leaders
Secondary Research
- Annual Reports
- White Paper
- Latest Press Release
- Industry Association
- Paid Database
- Investor Presentations

Step 4 - Data Triangulation
Involves using different sources of information in order to increase the validity of a study
These sources are likely to be stakeholders in a program - participants, other researchers, program staff, other community members, and so on.
Then we put all data in single framework & apply various statistical tools to find out the dynamic on the market.
During the analysis stage, feedback from the stakeholder groups would be compared to determine areas of agreement as well as areas of divergence

