
Key Insights
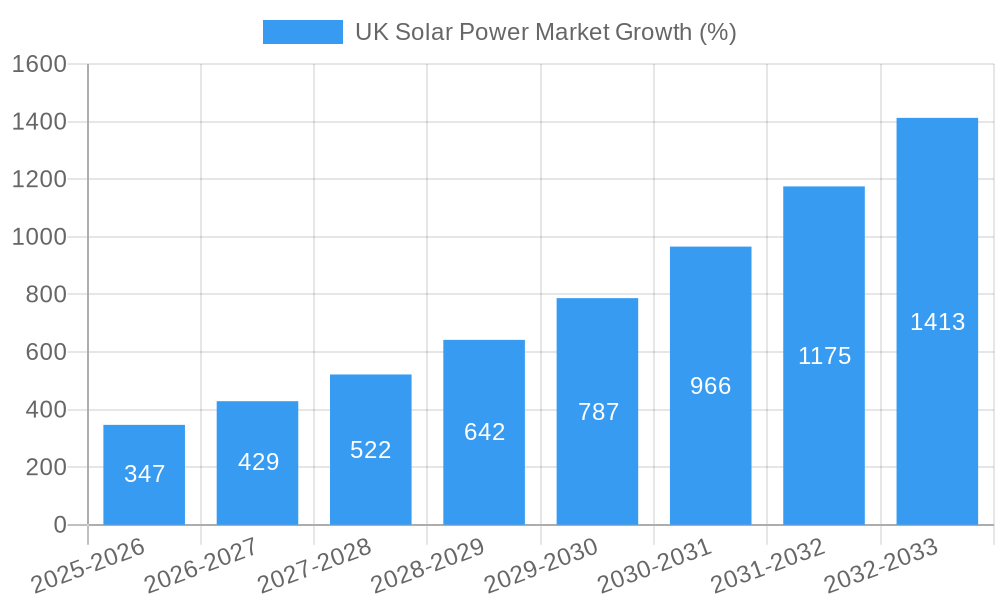
The UK solar power market is experiencing robust growth, driven by increasing government incentives, falling technology costs, and rising energy prices. The market's compound annual growth rate (CAGR) of 23.53% from 2019-2024 indicates a significant upward trajectory. This growth is fueled by a surge in residential solar installations, as homeowners seek to reduce energy bills and contribute to environmental sustainability. Furthermore, the commercial and industrial sectors are also embracing solar power, driven by corporate sustainability goals and the potential for substantial cost savings on electricity. The UK's ambitious renewable energy targets are another key driver, creating a favorable policy environment for solar energy adoption. While supply chain constraints and land availability might pose challenges, the overall market outlook remains positive. Technological advancements, particularly in monocrystalline and thin-film solar panels, are enhancing efficiency and driving down costs, making solar power a more attractive option across various segments. The market's segmentation by technology type (monocrystalline, polycrystalline, thin-film), application (residential, commercial, industrial), end-user (households, businesses, utilities), and distribution channel (direct sales, distribution partners, online retailers) provides a detailed understanding of market dynamics and opportunities for different stakeholders. Major players like First Solar Inc., Hive Energy, and Lightsource bp are actively shaping the market landscape through large-scale projects and technological innovations.
The future of the UK solar power market appears bright, projecting continued strong growth through 2033. This projection is based on several factors, including the ongoing decline in solar panel costs, supportive government policies, and increasing consumer awareness of the environmental and economic benefits of solar energy. The residential sector is expected to maintain its dominant position, while the commercial and industrial sectors will see increased adoption rates driven by cost-saving opportunities and corporate sustainability initiatives. Technological innovations are likely to further improve the efficiency and affordability of solar power, accelerating its integration into the UK energy mix. However, the market will also need to address potential challenges such as grid infrastructure limitations and securing sufficient land for large-scale solar farms. The continued engagement of key players, both established and emerging, will be crucial in realizing the full potential of the UK solar power market.

UK Solar Power Market: A Comprehensive Report (2019-2033)
This detailed report provides a comprehensive analysis of the UK solar power market, offering invaluable insights for industry stakeholders, investors, and policymakers. With a study period spanning 2019-2033, a base year of 2025, and a forecast period of 2025-2033, this report leverages historical data (2019-2024) to project future market trends and growth opportunities. The report meticulously examines market segmentation across technology (monocrystalline, polycrystalline, thin film), application (residential, commercial, industrial), end-user (households, businesses, utilities), and distribution channels (direct sales, distribution partners, online retailers). Key players like First Solar Inc, Hive Energy, Electricite de France SA, Lightsource bp, Renewable Energy Systems Ltd, Ameresco Inc, and Ecotricity Group Ltd (list not exhaustive) are analyzed for their market share and strategic initiatives. The report also incorporates recent industry developments, highlighting their impact on market dynamics.
UK Solar Power Market Concentration & Innovation
The UK solar power market exhibits a moderately concentrated landscape, with a few large players holding significant market share. However, the market is also characterized by a high degree of innovation, driven by advancements in solar technology and supportive government policies. The market share of the top five players is estimated to be around xx% in 2025. Mergers and acquisitions (M&A) activities have played a significant role in shaping the competitive landscape, with deal values exceeding £xx Million in the past five years. Regulatory frameworks, while generally supportive of solar power development, still present some challenges regarding grid connection and permitting processes. The increasing adoption of energy storage solutions and the emergence of innovative financing models are further fueling market growth. Product substitutes, such as wind power and other renewable energy sources, pose some competition; however, the declining cost of solar power and government incentives continue to drive its adoption. End-user trends indicate a shift towards large-scale solar farms and the integration of solar PV with other technologies, such as battery storage and smart grid solutions.
- Market Concentration: Top 5 players hold xx% market share (2025 estimate).
- M&A Activity: Deal values exceeding £xx Million (2020-2024).
- Innovation Drivers: Technological advancements, supportive government policies, and energy storage solutions.
- Regulatory Framework: Generally supportive but with challenges in grid connection and permitting.
UK Solar Power Market Industry Trends & Insights
The UK solar power market is experiencing robust growth, driven by factors such as government support through subsidies and renewable energy mandates, decreasing solar panel costs, and increasing awareness of environmental sustainability among businesses and households. The compound annual growth rate (CAGR) for the market is projected to be xx% from 2025 to 2033. Technological disruptions, such as advancements in thin-film solar technology and the integration of artificial intelligence in optimizing solar energy systems, are further propelling market expansion. Consumer preferences are shifting toward higher-efficiency solar panels with longer warranties and aesthetically pleasing designs. Competitive dynamics are intense, with both established players and new entrants vying for market share, resulting in price competition and a focus on innovation. Market penetration of solar PV in the residential sector is around xx% in 2025, expected to increase to xx% by 2033.
Dominant Markets & Segments in UK Solar Power Market
The UK solar power market is witnessing robust growth across various segments. The commercial and industrial segments are experiencing significant expansion, driven by corporate sustainability initiatives and the increasing affordability of solar solutions. The residential segment, though smaller in terms of individual project size, represents a significant overall market share, fuelled by government incentives and falling installation costs. Within technologies, monocrystalline solar panels dominate the market due to their higher efficiency. Direct sales and distribution partners are the prevalent distribution channels. The South East of England is currently the leading region due to favourable solar irradiance levels and existing infrastructure.
Key Drivers for Commercial & Industrial Segments:
- Government incentives and tax breaks for renewable energy adoption.
- Corporate social responsibility initiatives to reduce carbon footprint.
- Lower electricity bills due to on-site generation.
Key Drivers for Residential Segment:
- Government subsidies and feed-in tariffs.
- Falling installation costs.
- Growing environmental consciousness amongst homeowners.
Dominant Technology: Monocrystalline. Key factors: higher efficiency, improved lifespan, and better aesthetics.
Dominant Distribution Channel: Direct sales and established distribution partners.
UK Solar Power Market Product Developments
Recent product innovations focus on enhancing the efficiency and lifespan of solar panels, along with improvements in aesthetics and integration with other building systems. Advances in thin-film technology are creating more flexible and lightweight solar panels, suitable for various applications. Furthermore, smart solar solutions that integrate energy storage and monitoring systems are gaining traction. These innovations are designed to address concerns about energy security and grid stability, improving the overall market fit and competitiveness of solar solutions within the UK energy landscape.
Report Scope & Segmentation Analysis
This report provides a detailed analysis of the UK solar power market, segmented by technology (monocrystalline, polycrystalline, thin-film), application (residential, commercial, industrial), end-user (households, businesses, utilities), and distribution channels (direct sales, distribution partners, online retailers). Each segment's growth projections, market sizes, and competitive dynamics are assessed individually. For example, the monocrystalline segment is expected to maintain its dominance due to superior efficiency, while the residential sector is projected to show substantial growth, driven by supportive government policies. The report also explores the competitive landscape of each segment, analyzing the strategies of key players and their market share.
Key Drivers of UK Solar Power Market Growth
Several key factors are driving the expansion of the UK solar power market. These include:
- Government Policies: Supportive regulatory frameworks, including feed-in tariffs and renewable energy targets, incentivize solar power adoption.
- Technological Advancements: Improvements in solar panel efficiency, reduced manufacturing costs, and increased integration with energy storage solutions significantly contribute to growth.
- Economic Factors: Rising electricity prices and the cost-effectiveness of solar energy make it an attractive investment for businesses and households.
Challenges in the UK Solar Power Market Sector
Despite the favourable market conditions, several challenges hinder the growth of the UK solar power market. These include:
- Grid Connection Delays: Delays in obtaining grid connection permits and integrating solar power into the national grid represent a major bottleneck.
- Supply Chain Disruptions: Global supply chain issues can impact the availability and cost of solar panels and components.
- Intermittency and Storage: The intermittent nature of solar power necessitates significant investments in energy storage solutions.
Emerging Opportunities in UK Solar Power Market
The UK solar power market offers several compelling opportunities:
- Floating Solar Farms: Utilizing water bodies for solar installations presents a promising avenue for expansion.
- Agrivoltaics: Combining solar power generation with agricultural land use offers sustainable solutions.
- Community Solar Projects: Enabling broader community participation through shared solar ownership is gaining momentum.
Leading Players in the UK Solar Power Market Market
- First Solar Inc
- Hive Energy
- Electricite de France SA
- Lightsource bp Renewable Energy Investments Limited
- Renewable Energy Systems Ltd
- Ameresco Inc
- Ecotricity Group Ltd
Key Developments in UK Solar Power Market Industry
- June 2023: The UK government approved the construction of Longfield Solar Farm, the country's largest, capable of powering approximately 60,000 households.
- June 2023: AMPYR Solar Europe acquired a 390 MWp solar PV + BESS portfolio from Tyler Hill, comprising five projects slated for construction in 2024.
Strategic Outlook for UK Solar Power Market Market
The UK solar power market is poised for significant growth over the next decade, driven by sustained government support, technological advancements, and increasing consumer demand for clean energy. The expansion of large-scale solar farms, coupled with the growing adoption of innovative technologies like energy storage and agrivoltaics, will contribute to the market's long-term potential. Opportunities exist across all segments, and continued innovation and strategic partnerships will be vital for success in this dynamic market.
UK Solar Power Market Segmentation
- 1. Residential
- 2. Commercial and Industrial
- 3. Utilities
UK Solar Power Market Segmentation By Geography
-
1. North America
- 1.1. United States
- 1.2. Canada
- 1.3. Mexico
-
2. South America
- 2.1. Brazil
- 2.2. Argentina
- 2.3. Rest of South America
-
3. Europe
- 3.1. United Kingdom
- 3.2. Germany
- 3.3. France
- 3.4. Italy
- 3.5. Spain
- 3.6. Russia
- 3.7. Benelux
- 3.8. Nordics
- 3.9. Rest of Europe
-
4. Middle East & Africa
- 4.1. Turkey
- 4.2. Israel
- 4.3. GCC
- 4.4. North Africa
- 4.5. South Africa
- 4.6. Rest of Middle East & Africa
-
5. Asia Pacific
- 5.1. China
- 5.2. India
- 5.3. Japan
- 5.4. South Korea
- 5.5. ASEAN
- 5.6. Oceania
- 5.7. Rest of Asia Pacific
UK Solar Power Market REPORT HIGHLIGHTS
| Aspects | Details |
|---|---|
| Study Period | 2019-2033 |
| Base Year | 2024 |
| Estimated Year | 2025 |
| Forecast Period | 2025-2033 |
| Historical Period | 2019-2024 |
| Growth Rate | CAGR of 23.53% from 2019-2033 |
| Segmentation |
|
Table of Contents
- 1. Introduction
- 1.1. Research Scope
- 1.2. Market Segmentation
- 1.3. Research Methodology
- 1.4. Definitions and Assumptions
- 2. Executive Summary
- 2.1. Introduction
- 3. Market Dynamics
- 3.1. Introduction
- 3.2. Market Drivers
- 3.2.1. Government Policies and Demand for Renewable Energy Sources 4.; The Declining Costs of Solar Technologies
- 3.3. Market Restrains
- 3.3.1. Limited Land and Demand for Alternative Renewable Energy Sources
- 3.4. Market Trends
- 3.4.1. Residential Sector to Witness Significant Growth
- 4. Market Factor Analysis
- 4.1. Porters Five Forces
- 4.2. Supply/Value Chain
- 4.3. PESTEL analysis
- 4.4. Market Entropy
- 4.5. Patent/Trademark Analysis
- 5. Global UK Solar Power Market Analysis, Insights and Forecast, 2019-2031
- 5.1. Market Analysis, Insights and Forecast - by Residential
- 5.2. Market Analysis, Insights and Forecast - by Commercial and Industrial
- 5.3. Market Analysis, Insights and Forecast - by Utilities
- 5.4. Market Analysis, Insights and Forecast - by Region
- 5.4.1. North America
- 5.4.2. South America
- 5.4.3. Europe
- 5.4.4. Middle East & Africa
- 5.4.5. Asia Pacific
- 5.1. Market Analysis, Insights and Forecast - by Residential
- 6. North America UK Solar Power Market Analysis, Insights and Forecast, 2019-2031
- 6.1. Market Analysis, Insights and Forecast - by Residential
- 6.2. Market Analysis, Insights and Forecast - by Commercial and Industrial
- 6.3. Market Analysis, Insights and Forecast - by Utilities
- 6.1. Market Analysis, Insights and Forecast - by Residential
- 7. South America UK Solar Power Market Analysis, Insights and Forecast, 2019-2031
- 7.1. Market Analysis, Insights and Forecast - by Residential
- 7.2. Market Analysis, Insights and Forecast - by Commercial and Industrial
- 7.3. Market Analysis, Insights and Forecast - by Utilities
- 7.1. Market Analysis, Insights and Forecast - by Residential
- 8. Europe UK Solar Power Market Analysis, Insights and Forecast, 2019-2031
- 8.1. Market Analysis, Insights and Forecast - by Residential
- 8.2. Market Analysis, Insights and Forecast - by Commercial and Industrial
- 8.3. Market Analysis, Insights and Forecast - by Utilities
- 8.1. Market Analysis, Insights and Forecast - by Residential
- 9. Middle East & Africa UK Solar Power Market Analysis, Insights and Forecast, 2019-2031
- 9.1. Market Analysis, Insights and Forecast - by Residential
- 9.2. Market Analysis, Insights and Forecast - by Commercial and Industrial
- 9.3. Market Analysis, Insights and Forecast - by Utilities
- 9.1. Market Analysis, Insights and Forecast - by Residential
- 10. Asia Pacific UK Solar Power Market Analysis, Insights and Forecast, 2019-2031
- 10.1. Market Analysis, Insights and Forecast - by Residential
- 10.2. Market Analysis, Insights and Forecast - by Commercial and Industrial
- 10.3. Market Analysis, Insights and Forecast - by Utilities
- 10.1. Market Analysis, Insights and Forecast - by Residential
- 11. Germany UK Solar Power Market Analysis, Insights and Forecast, 2019-2031
- 12. France UK Solar Power Market Analysis, Insights and Forecast, 2019-2031
- 13. Italy UK Solar Power Market Analysis, Insights and Forecast, 2019-2031
- 14. United Kingdom UK Solar Power Market Analysis, Insights and Forecast, 2019-2031
- 15. Netherlands UK Solar Power Market Analysis, Insights and Forecast, 2019-2031
- 16. Rest of Europe UK Solar Power Market Analysis, Insights and Forecast, 2019-2031
- 17. Competitive Analysis
- 17.1. Global Market Share Analysis 2024
- 17.2. Company Profiles
- 17.2.1 First Solar Inc
- 17.2.1.1. Overview
- 17.2.1.2. Products
- 17.2.1.3. SWOT Analysis
- 17.2.1.4. Recent Developments
- 17.2.1.5. Financials (Based on Availability)
- 17.2.2 Hive Energy
- 17.2.2.1. Overview
- 17.2.2.2. Products
- 17.2.2.3. SWOT Analysis
- 17.2.2.4. Recent Developments
- 17.2.2.5. Financials (Based on Availability)
- 17.2.3 Electricite de France SA
- 17.2.3.1. Overview
- 17.2.3.2. Products
- 17.2.3.3. SWOT Analysis
- 17.2.3.4. Recent Developments
- 17.2.3.5. Financials (Based on Availability)
- 17.2.4 Lightsource bp Renewable Energy Investments Limited
- 17.2.4.1. Overview
- 17.2.4.2. Products
- 17.2.4.3. SWOT Analysis
- 17.2.4.4. Recent Developments
- 17.2.4.5. Financials (Based on Availability)
- 17.2.5 Renewable Energy Systems Ltd
- 17.2.5.1. Overview
- 17.2.5.2. Products
- 17.2.5.3. SWOT Analysis
- 17.2.5.4. Recent Developments
- 17.2.5.5. Financials (Based on Availability)
- 17.2.6 Ameresco Inc *List Not Exhaustive
- 17.2.6.1. Overview
- 17.2.6.2. Products
- 17.2.6.3. SWOT Analysis
- 17.2.6.4. Recent Developments
- 17.2.6.5. Financials (Based on Availability)
- 17.2.7 Ecotricity Group Ltd
- 17.2.7.1. Overview
- 17.2.7.2. Products
- 17.2.7.3. SWOT Analysis
- 17.2.7.4. Recent Developments
- 17.2.7.5. Financials (Based on Availability)
- 17.2.1 First Solar Inc
List of Figures
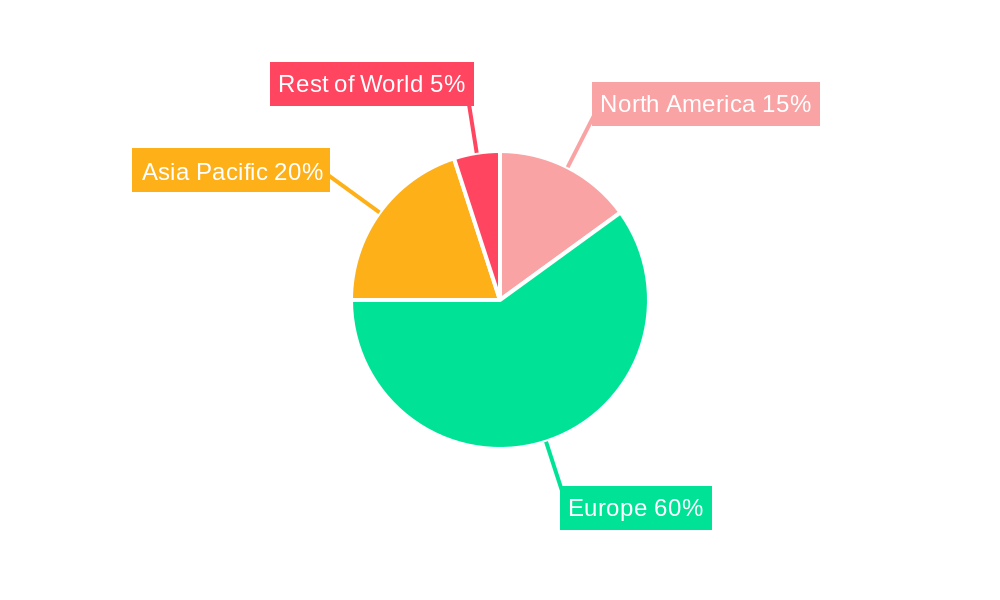
- Figure 1: Global UK Solar Power Market Revenue Breakdown (Million, %) by Region 2024 & 2032
- Figure 2: Global UK Solar Power Market Volume Breakdown (gigawatt, %) by Region 2024 & 2032
- Figure 3: Europe UK Solar Power Market Revenue (Million), by Country 2024 & 2032
- Figure 4: Europe UK Solar Power Market Volume (gigawatt), by Country 2024 & 2032
- Figure 5: Europe UK Solar Power Market Revenue Share (%), by Country 2024 & 2032
- Figure 6: Europe UK Solar Power Market Volume Share (%), by Country 2024 & 2032
- Figure 7: North America UK Solar Power Market Revenue (Million), by Residential 2024 & 2032
- Figure 8: North America UK Solar Power Market Volume (gigawatt), by Residential 2024 & 2032
- Figure 9: North America UK Solar Power Market Revenue Share (%), by Residential 2024 & 2032
- Figure 10: North America UK Solar Power Market Volume Share (%), by Residential 2024 & 2032
- Figure 11: North America UK Solar Power Market Revenue (Million), by Commercial and Industrial 2024 & 2032
- Figure 12: North America UK Solar Power Market Volume (gigawatt), by Commercial and Industrial 2024 & 2032
- Figure 13: North America UK Solar Power Market Revenue Share (%), by Commercial and Industrial 2024 & 2032
- Figure 14: North America UK Solar Power Market Volume Share (%), by Commercial and Industrial 2024 & 2032
- Figure 15: North America UK Solar Power Market Revenue (Million), by Utilities 2024 & 2032
- Figure 16: North America UK Solar Power Market Volume (gigawatt), by Utilities 2024 & 2032
- Figure 17: North America UK Solar Power Market Revenue Share (%), by Utilities 2024 & 2032
- Figure 18: North America UK Solar Power Market Volume Share (%), by Utilities 2024 & 2032
- Figure 19: North America UK Solar Power Market Revenue (Million), by Country 2024 & 2032
- Figure 20: North America UK Solar Power Market Volume (gigawatt), by Country 2024 & 2032
- Figure 21: North America UK Solar Power Market Revenue Share (%), by Country 2024 & 2032
- Figure 22: North America UK Solar Power Market Volume Share (%), by Country 2024 & 2032
- Figure 23: South America UK Solar Power Market Revenue (Million), by Residential 2024 & 2032
- Figure 24: South America UK Solar Power Market Volume (gigawatt), by Residential 2024 & 2032
- Figure 25: South America UK Solar Power Market Revenue Share (%), by Residential 2024 & 2032
- Figure 26: South America UK Solar Power Market Volume Share (%), by Residential 2024 & 2032
- Figure 27: South America UK Solar Power Market Revenue (Million), by Commercial and Industrial 2024 & 2032
- Figure 28: South America UK Solar Power Market Volume (gigawatt), by Commercial and Industrial 2024 & 2032
- Figure 29: South America UK Solar Power Market Revenue Share (%), by Commercial and Industrial 2024 & 2032
- Figure 30: South America UK Solar Power Market Volume Share (%), by Commercial and Industrial 2024 & 2032
- Figure 31: South America UK Solar Power Market Revenue (Million), by Utilities 2024 & 2032
- Figure 32: South America UK Solar Power Market Volume (gigawatt), by Utilities 2024 & 2032
- Figure 33: South America UK Solar Power Market Revenue Share (%), by Utilities 2024 & 2032
- Figure 34: South America UK Solar Power Market Volume Share (%), by Utilities 2024 & 2032
- Figure 35: South America UK Solar Power Market Revenue (Million), by Country 2024 & 2032
- Figure 36: South America UK Solar Power Market Volume (gigawatt), by Country 2024 & 2032
- Figure 37: South America UK Solar Power Market Revenue Share (%), by Country 2024 & 2032
- Figure 38: South America UK Solar Power Market Volume Share (%), by Country 2024 & 2032
- Figure 39: Europe UK Solar Power Market Revenue (Million), by Residential 2024 & 2032
- Figure 40: Europe UK Solar Power Market Volume (gigawatt), by Residential 2024 & 2032
- Figure 41: Europe UK Solar Power Market Revenue Share (%), by Residential 2024 & 2032
- Figure 42: Europe UK Solar Power Market Volume Share (%), by Residential 2024 & 2032
- Figure 43: Europe UK Solar Power Market Revenue (Million), by Commercial and Industrial 2024 & 2032
- Figure 44: Europe UK Solar Power Market Volume (gigawatt), by Commercial and Industrial 2024 & 2032
- Figure 45: Europe UK Solar Power Market Revenue Share (%), by Commercial and Industrial 2024 & 2032
- Figure 46: Europe UK Solar Power Market Volume Share (%), by Commercial and Industrial 2024 & 2032
- Figure 47: Europe UK Solar Power Market Revenue (Million), by Utilities 2024 & 2032
- Figure 48: Europe UK Solar Power Market Volume (gigawatt), by Utilities 2024 & 2032
- Figure 49: Europe UK Solar Power Market Revenue Share (%), by Utilities 2024 & 2032
- Figure 50: Europe UK Solar Power Market Volume Share (%), by Utilities 2024 & 2032
- Figure 51: Europe UK Solar Power Market Revenue (Million), by Country 2024 & 2032
- Figure 52: Europe UK Solar Power Market Volume (gigawatt), by Country 2024 & 2032
- Figure 53: Europe UK Solar Power Market Revenue Share (%), by Country 2024 & 2032
- Figure 54: Europe UK Solar Power Market Volume Share (%), by Country 2024 & 2032
- Figure 55: Middle East & Africa UK Solar Power Market Revenue (Million), by Residential 2024 & 2032
- Figure 56: Middle East & Africa UK Solar Power Market Volume (gigawatt), by Residential 2024 & 2032
- Figure 57: Middle East & Africa UK Solar Power Market Revenue Share (%), by Residential 2024 & 2032
- Figure 58: Middle East & Africa UK Solar Power Market Volume Share (%), by Residential 2024 & 2032
- Figure 59: Middle East & Africa UK Solar Power Market Revenue (Million), by Commercial and Industrial 2024 & 2032
- Figure 60: Middle East & Africa UK Solar Power Market Volume (gigawatt), by Commercial and Industrial 2024 & 2032
- Figure 61: Middle East & Africa UK Solar Power Market Revenue Share (%), by Commercial and Industrial 2024 & 2032
- Figure 62: Middle East & Africa UK Solar Power Market Volume Share (%), by Commercial and Industrial 2024 & 2032
- Figure 63: Middle East & Africa UK Solar Power Market Revenue (Million), by Utilities 2024 & 2032
- Figure 64: Middle East & Africa UK Solar Power Market Volume (gigawatt), by Utilities 2024 & 2032
- Figure 65: Middle East & Africa UK Solar Power Market Revenue Share (%), by Utilities 2024 & 2032
- Figure 66: Middle East & Africa UK Solar Power Market Volume Share (%), by Utilities 2024 & 2032
- Figure 67: Middle East & Africa UK Solar Power Market Revenue (Million), by Country 2024 & 2032
- Figure 68: Middle East & Africa UK Solar Power Market Volume (gigawatt), by Country 2024 & 2032
- Figure 69: Middle East & Africa UK Solar Power Market Revenue Share (%), by Country 2024 & 2032
- Figure 70: Middle East & Africa UK Solar Power Market Volume Share (%), by Country 2024 & 2032
- Figure 71: Asia Pacific UK Solar Power Market Revenue (Million), by Residential 2024 & 2032
- Figure 72: Asia Pacific UK Solar Power Market Volume (gigawatt), by Residential 2024 & 2032
- Figure 73: Asia Pacific UK Solar Power Market Revenue Share (%), by Residential 2024 & 2032
- Figure 74: Asia Pacific UK Solar Power Market Volume Share (%), by Residential 2024 & 2032
- Figure 75: Asia Pacific UK Solar Power Market Revenue (Million), by Commercial and Industrial 2024 & 2032
- Figure 76: Asia Pacific UK Solar Power Market Volume (gigawatt), by Commercial and Industrial 2024 & 2032
- Figure 77: Asia Pacific UK Solar Power Market Revenue Share (%), by Commercial and Industrial 2024 & 2032
- Figure 78: Asia Pacific UK Solar Power Market Volume Share (%), by Commercial and Industrial 2024 & 2032
- Figure 79: Asia Pacific UK Solar Power Market Revenue (Million), by Utilities 2024 & 2032
- Figure 80: Asia Pacific UK Solar Power Market Volume (gigawatt), by Utilities 2024 & 2032
- Figure 81: Asia Pacific UK Solar Power Market Revenue Share (%), by Utilities 2024 & 2032
- Figure 82: Asia Pacific UK Solar Power Market Volume Share (%), by Utilities 2024 & 2032
- Figure 83: Asia Pacific UK Solar Power Market Revenue (Million), by Country 2024 & 2032
- Figure 84: Asia Pacific UK Solar Power Market Volume (gigawatt), by Country 2024 & 2032
- Figure 85: Asia Pacific UK Solar Power Market Revenue Share (%), by Country 2024 & 2032
- Figure 86: Asia Pacific UK Solar Power Market Volume Share (%), by Country 2024 & 2032
List of Tables
- Table 1: Global UK Solar Power Market Revenue Million Forecast, by Region 2019 & 2032
- Table 2: Global UK Solar Power Market Volume gigawatt Forecast, by Region 2019 & 2032
- Table 3: Global UK Solar Power Market Revenue Million Forecast, by Residential 2019 & 2032
- Table 4: Global UK Solar Power Market Volume gigawatt Forecast, by Residential 2019 & 2032
- Table 5: Global UK Solar Power Market Revenue Million Forecast, by Commercial and Industrial 2019 & 2032
- Table 6: Global UK Solar Power Market Volume gigawatt Forecast, by Commercial and Industrial 2019 & 2032
- Table 7: Global UK Solar Power Market Revenue Million Forecast, by Utilities 2019 & 2032
- Table 8: Global UK Solar Power Market Volume gigawatt Forecast, by Utilities 2019 & 2032
- Table 9: Global UK Solar Power Market Revenue Million Forecast, by Region 2019 & 2032
- Table 10: Global UK Solar Power Market Volume gigawatt Forecast, by Region 2019 & 2032
- Table 11: Global UK Solar Power Market Revenue Million Forecast, by Country 2019 & 2032
- Table 12: Global UK Solar Power Market Volume gigawatt Forecast, by Country 2019 & 2032
- Table 13: Germany UK Solar Power Market Revenue (Million) Forecast, by Application 2019 & 2032
- Table 14: Germany UK Solar Power Market Volume (gigawatt) Forecast, by Application 2019 & 2032
- Table 15: France UK Solar Power Market Revenue (Million) Forecast, by Application 2019 & 2032
- Table 16: France UK Solar Power Market Volume (gigawatt) Forecast, by Application 2019 & 2032
- Table 17: Italy UK Solar Power Market Revenue (Million) Forecast, by Application 2019 & 2032
- Table 18: Italy UK Solar Power Market Volume (gigawatt) Forecast, by Application 2019 & 2032
- Table 19: United Kingdom UK Solar Power Market Revenue (Million) Forecast, by Application 2019 & 2032
- Table 20: United Kingdom UK Solar Power Market Volume (gigawatt) Forecast, by Application 2019 & 2032
- Table 21: Netherlands UK Solar Power Market Revenue (Million) Forecast, by Application 2019 & 2032
- Table 22: Netherlands UK Solar Power Market Volume (gigawatt) Forecast, by Application 2019 & 2032
- Table 23: Rest of Europe UK Solar Power Market Revenue (Million) Forecast, by Application 2019 & 2032
- Table 24: Rest of Europe UK Solar Power Market Volume (gigawatt) Forecast, by Application 2019 & 2032
- Table 25: Global UK Solar Power Market Revenue Million Forecast, by Residential 2019 & 2032
- Table 26: Global UK Solar Power Market Volume gigawatt Forecast, by Residential 2019 & 2032
- Table 27: Global UK Solar Power Market Revenue Million Forecast, by Commercial and Industrial 2019 & 2032
- Table 28: Global UK Solar Power Market Volume gigawatt Forecast, by Commercial and Industrial 2019 & 2032
- Table 29: Global UK Solar Power Market Revenue Million Forecast, by Utilities 2019 & 2032
- Table 30: Global UK Solar Power Market Volume gigawatt Forecast, by Utilities 2019 & 2032
- Table 31: Global UK Solar Power Market Revenue Million Forecast, by Country 2019 & 2032
- Table 32: Global UK Solar Power Market Volume gigawatt Forecast, by Country 2019 & 2032
- Table 33: United States UK Solar Power Market Revenue (Million) Forecast, by Application 2019 & 2032
- Table 34: United States UK Solar Power Market Volume (gigawatt) Forecast, by Application 2019 & 2032
- Table 35: Canada UK Solar Power Market Revenue (Million) Forecast, by Application 2019 & 2032
- Table 36: Canada UK Solar Power Market Volume (gigawatt) Forecast, by Application 2019 & 2032
- Table 37: Mexico UK Solar Power Market Revenue (Million) Forecast, by Application 2019 & 2032
- Table 38: Mexico UK Solar Power Market Volume (gigawatt) Forecast, by Application 2019 & 2032
- Table 39: Global UK Solar Power Market Revenue Million Forecast, by Residential 2019 & 2032
- Table 40: Global UK Solar Power Market Volume gigawatt Forecast, by Residential 2019 & 2032
- Table 41: Global UK Solar Power Market Revenue Million Forecast, by Commercial and Industrial 2019 & 2032
- Table 42: Global UK Solar Power Market Volume gigawatt Forecast, by Commercial and Industrial 2019 & 2032
- Table 43: Global UK Solar Power Market Revenue Million Forecast, by Utilities 2019 & 2032
- Table 44: Global UK Solar Power Market Volume gigawatt Forecast, by Utilities 2019 & 2032
- Table 45: Global UK Solar Power Market Revenue Million Forecast, by Country 2019 & 2032
- Table 46: Global UK Solar Power Market Volume gigawatt Forecast, by Country 2019 & 2032
- Table 47: Brazil UK Solar Power Market Revenue (Million) Forecast, by Application 2019 & 2032
- Table 48: Brazil UK Solar Power Market Volume (gigawatt) Forecast, by Application 2019 & 2032
- Table 49: Argentina UK Solar Power Market Revenue (Million) Forecast, by Application 2019 & 2032
- Table 50: Argentina UK Solar Power Market Volume (gigawatt) Forecast, by Application 2019 & 2032
- Table 51: Rest of South America UK Solar Power Market Revenue (Million) Forecast, by Application 2019 & 2032
- Table 52: Rest of South America UK Solar Power Market Volume (gigawatt) Forecast, by Application 2019 & 2032
- Table 53: Global UK Solar Power Market Revenue Million Forecast, by Residential 2019 & 2032
- Table 54: Global UK Solar Power Market Volume gigawatt Forecast, by Residential 2019 & 2032
- Table 55: Global UK Solar Power Market Revenue Million Forecast, by Commercial and Industrial 2019 & 2032
- Table 56: Global UK Solar Power Market Volume gigawatt Forecast, by Commercial and Industrial 2019 & 2032
- Table 57: Global UK Solar Power Market Revenue Million Forecast, by Utilities 2019 & 2032
- Table 58: Global UK Solar Power Market Volume gigawatt Forecast, by Utilities 2019 & 2032
- Table 59: Global UK Solar Power Market Revenue Million Forecast, by Country 2019 & 2032
- Table 60: Global UK Solar Power Market Volume gigawatt Forecast, by Country 2019 & 2032
- Table 61: United Kingdom UK Solar Power Market Revenue (Million) Forecast, by Application 2019 & 2032
- Table 62: United Kingdom UK Solar Power Market Volume (gigawatt) Forecast, by Application 2019 & 2032
- Table 63: Germany UK Solar Power Market Revenue (Million) Forecast, by Application 2019 & 2032
- Table 64: Germany UK Solar Power Market Volume (gigawatt) Forecast, by Application 2019 & 2032
- Table 65: France UK Solar Power Market Revenue (Million) Forecast, by Application 2019 & 2032
- Table 66: France UK Solar Power Market Volume (gigawatt) Forecast, by Application 2019 & 2032
- Table 67: Italy UK Solar Power Market Revenue (Million) Forecast, by Application 2019 & 2032
- Table 68: Italy UK Solar Power Market Volume (gigawatt) Forecast, by Application 2019 & 2032
- Table 69: Spain UK Solar Power Market Revenue (Million) Forecast, by Application 2019 & 2032
- Table 70: Spain UK Solar Power Market Volume (gigawatt) Forecast, by Application 2019 & 2032
- Table 71: Russia UK Solar Power Market Revenue (Million) Forecast, by Application 2019 & 2032
- Table 72: Russia UK Solar Power Market Volume (gigawatt) Forecast, by Application 2019 & 2032
- Table 73: Benelux UK Solar Power Market Revenue (Million) Forecast, by Application 2019 & 2032
- Table 74: Benelux UK Solar Power Market Volume (gigawatt) Forecast, by Application 2019 & 2032
- Table 75: Nordics UK Solar Power Market Revenue (Million) Forecast, by Application 2019 & 2032
- Table 76: Nordics UK Solar Power Market Volume (gigawatt) Forecast, by Application 2019 & 2032
- Table 77: Rest of Europe UK Solar Power Market Revenue (Million) Forecast, by Application 2019 & 2032
- Table 78: Rest of Europe UK Solar Power Market Volume (gigawatt) Forecast, by Application 2019 & 2032
- Table 79: Global UK Solar Power Market Revenue Million Forecast, by Residential 2019 & 2032
- Table 80: Global UK Solar Power Market Volume gigawatt Forecast, by Residential 2019 & 2032
- Table 81: Global UK Solar Power Market Revenue Million Forecast, by Commercial and Industrial 2019 & 2032
- Table 82: Global UK Solar Power Market Volume gigawatt Forecast, by Commercial and Industrial 2019 & 2032
- Table 83: Global UK Solar Power Market Revenue Million Forecast, by Utilities 2019 & 2032
- Table 84: Global UK Solar Power Market Volume gigawatt Forecast, by Utilities 2019 & 2032
- Table 85: Global UK Solar Power Market Revenue Million Forecast, by Country 2019 & 2032
- Table 86: Global UK Solar Power Market Volume gigawatt Forecast, by Country 2019 & 2032
- Table 87: Turkey UK Solar Power Market Revenue (Million) Forecast, by Application 2019 & 2032
- Table 88: Turkey UK Solar Power Market Volume (gigawatt) Forecast, by Application 2019 & 2032
- Table 89: Israel UK Solar Power Market Revenue (Million) Forecast, by Application 2019 & 2032
- Table 90: Israel UK Solar Power Market Volume (gigawatt) Forecast, by Application 2019 & 2032
- Table 91: GCC UK Solar Power Market Revenue (Million) Forecast, by Application 2019 & 2032
- Table 92: GCC UK Solar Power Market Volume (gigawatt) Forecast, by Application 2019 & 2032
- Table 93: North Africa UK Solar Power Market Revenue (Million) Forecast, by Application 2019 & 2032
- Table 94: North Africa UK Solar Power Market Volume (gigawatt) Forecast, by Application 2019 & 2032
- Table 95: South Africa UK Solar Power Market Revenue (Million) Forecast, by Application 2019 & 2032
- Table 96: South Africa UK Solar Power Market Volume (gigawatt) Forecast, by Application 2019 & 2032
- Table 97: Rest of Middle East & Africa UK Solar Power Market Revenue (Million) Forecast, by Application 2019 & 2032
- Table 98: Rest of Middle East & Africa UK Solar Power Market Volume (gigawatt) Forecast, by Application 2019 & 2032
- Table 99: Global UK Solar Power Market Revenue Million Forecast, by Residential 2019 & 2032
- Table 100: Global UK Solar Power Market Volume gigawatt Forecast, by Residential 2019 & 2032
- Table 101: Global UK Solar Power Market Revenue Million Forecast, by Commercial and Industrial 2019 & 2032
- Table 102: Global UK Solar Power Market Volume gigawatt Forecast, by Commercial and Industrial 2019 & 2032
- Table 103: Global UK Solar Power Market Revenue Million Forecast, by Utilities 2019 & 2032
- Table 104: Global UK Solar Power Market Volume gigawatt Forecast, by Utilities 2019 & 2032
- Table 105: Global UK Solar Power Market Revenue Million Forecast, by Country 2019 & 2032
- Table 106: Global UK Solar Power Market Volume gigawatt Forecast, by Country 2019 & 2032
- Table 107: China UK Solar Power Market Revenue (Million) Forecast, by Application 2019 & 2032
- Table 108: China UK Solar Power Market Volume (gigawatt) Forecast, by Application 2019 & 2032
- Table 109: India UK Solar Power Market Revenue (Million) Forecast, by Application 2019 & 2032
- Table 110: India UK Solar Power Market Volume (gigawatt) Forecast, by Application 2019 & 2032
- Table 111: Japan UK Solar Power Market Revenue (Million) Forecast, by Application 2019 & 2032
- Table 112: Japan UK Solar Power Market Volume (gigawatt) Forecast, by Application 2019 & 2032
- Table 113: South Korea UK Solar Power Market Revenue (Million) Forecast, by Application 2019 & 2032
- Table 114: South Korea UK Solar Power Market Volume (gigawatt) Forecast, by Application 2019 & 2032
- Table 115: ASEAN UK Solar Power Market Revenue (Million) Forecast, by Application 2019 & 2032
- Table 116: ASEAN UK Solar Power Market Volume (gigawatt) Forecast, by Application 2019 & 2032
- Table 117: Oceania UK Solar Power Market Revenue (Million) Forecast, by Application 2019 & 2032
- Table 118: Oceania UK Solar Power Market Volume (gigawatt) Forecast, by Application 2019 & 2032
- Table 119: Rest of Asia Pacific UK Solar Power Market Revenue (Million) Forecast, by Application 2019 & 2032
- Table 120: Rest of Asia Pacific UK Solar Power Market Volume (gigawatt) Forecast, by Application 2019 & 2032
Frequently Asked Questions
1. What is the projected Compound Annual Growth Rate (CAGR) of the UK Solar Power Market?
The projected CAGR is approximately 23.53%.
2. Which companies are prominent players in the UK Solar Power Market?
Key companies in the market include First Solar Inc, Hive Energy, Electricite de France SA, Lightsource bp Renewable Energy Investments Limited, Renewable Energy Systems Ltd, Ameresco Inc *List Not Exhaustive, Ecotricity Group Ltd.
3. What are the main segments of the UK Solar Power Market?
The market segments include Residential, Commercial and Industrial, Utilities.
4. Can you provide details about the market size?
The market size is estimated to be USD XX Million as of 2022.
5. What are some drivers contributing to market growth?
Government Policies and Demand for Renewable Energy Sources 4.; The Declining Costs of Solar Technologies.
6. What are the notable trends driving market growth?
Residential Sector to Witness Significant Growth.
7. Are there any restraints impacting market growth?
Limited Land and Demand for Alternative Renewable Energy Sources.
8. Can you provide examples of recent developments in the market?
June 2023: The United Kingdom Government approved the construction of the country's largest solar farm, large enough to power about 60,000 households, on farmland near Chelmsford. Longfield Solar Farm, which spans 380 hectares of intensive arable farmland near Terling, has the potential to generate enough electricity to supply four times the energy needs of all new dwellings planned for Chelmsford over the next 13 years.
9. What pricing options are available for accessing the report?
Pricing options include single-user, multi-user, and enterprise licenses priced at USD 3800, USD 4500, and USD 5800 respectively.
10. Is the market size provided in terms of value or volume?
The market size is provided in terms of value, measured in Million and volume, measured in gigawatt.
11. Are there any specific market keywords associated with the report?
Yes, the market keyword associated with the report is "UK Solar Power Market," which aids in identifying and referencing the specific market segment covered.
12. How do I determine which pricing option suits my needs best?
The pricing options vary based on user requirements and access needs. Individual users may opt for single-user licenses, while businesses requiring broader access may choose multi-user or enterprise licenses for cost-effective access to the report.
13. Are there any additional resources or data provided in the UK Solar Power Market report?
While the report offers comprehensive insights, it's advisable to review the specific contents or supplementary materials provided to ascertain if additional resources or data are available.
14. How can I stay updated on further developments or reports in the UK Solar Power Market?
To stay informed about further developments, trends, and reports in the UK Solar Power Market, consider subscribing to industry newsletters, following relevant companies and organizations, or regularly checking reputable industry news sources and publications.
Methodology
Step 1 - Identification of Relevant Samples Size from Population Database


Step 2 - Approaches for Defining Global Market Size (Value, Volume* & Price*)

Note*: In applicable scenarios
Step 3 - Data Sources
Primary Research
- Web Analytics
- Survey Reports
- Research Institute
- Latest Research Reports
- Opinion Leaders
Secondary Research
- Annual Reports
- White Paper
- Latest Press Release
- Industry Association
- Paid Database
- Investor Presentations

Step 4 - Data Triangulation
Involves using different sources of information in order to increase the validity of a study
These sources are likely to be stakeholders in a program - participants, other researchers, program staff, other community members, and so on.
Then we put all data in single framework & apply various statistical tools to find out the dynamic on the market.
During the analysis stage, feedback from the stakeholder groups would be compared to determine areas of agreement as well as areas of divergence


