
Key Insights
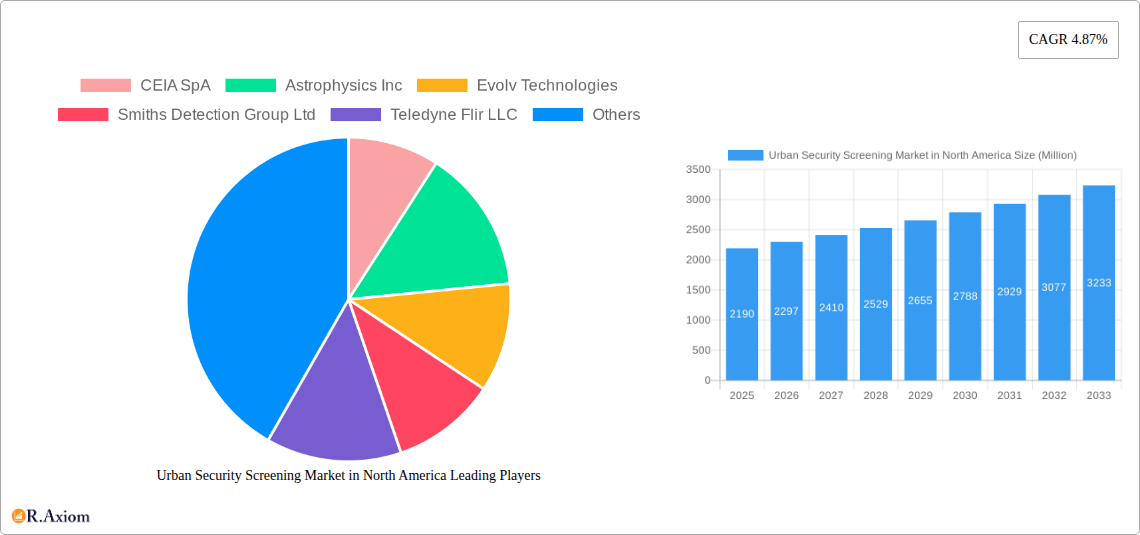
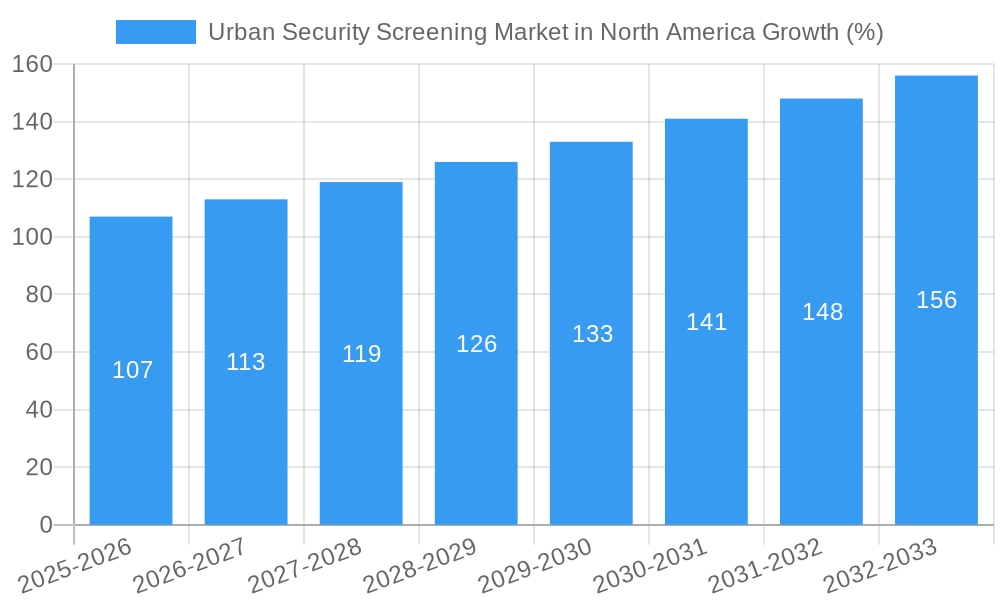
The North American urban security screening market, valued at $2.19 billion in 2025, is projected to experience robust growth, driven by escalating security concerns in public spaces and critical infrastructure. The market's Compound Annual Growth Rate (CAGR) of 4.87% from 2019-2033 indicates a steady expansion, fueled by increasing adoption of advanced technologies like millimeter-wave scanners and AI-powered threat detection systems. Key drivers include rising terrorism threats, government mandates for enhanced security protocols in high-traffic areas such as transportation hubs and government buildings, and growing demand for efficient and non-invasive screening solutions in corporate environments and data centers. The market is segmented by product type (X-ray, millimeter wave, metal detectors, radiation detection, chemical and trace detection), end-user industry (corporate buildings, mailrooms, warehouses, government buildings, transportation, data centers, law enforcement), and geography (United States and Canada predominantly). The increasing integration of smart technologies and analytics into screening systems, coupled with the development of more portable and user-friendly devices, presents significant growth opportunities. However, factors like high initial investment costs for advanced technologies and the need for ongoing maintenance and personnel training may act as restraints.
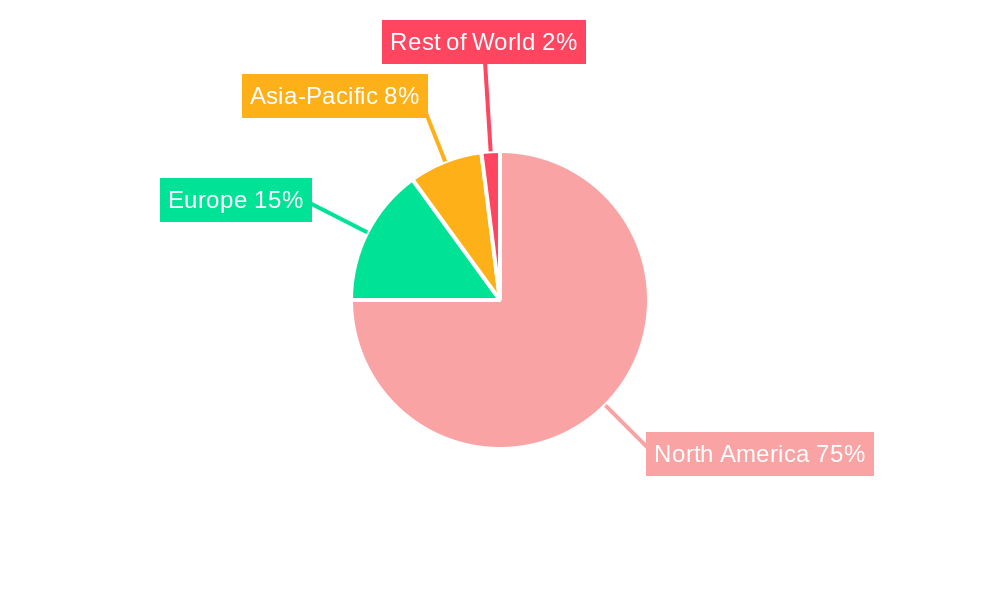
The United States dominates the North American market due to its substantial investment in security infrastructure and the presence of major market players. Canada also holds a significant market share, driven by similar security concerns and government initiatives. The market's future growth hinges on continuous technological advancements, government policies promoting security upgrades, and successful adoption of integrated security solutions across various sectors. Furthermore, the increasing awareness of potential threats from emerging technologies and cyberattacks is likely to propel the demand for comprehensive urban security screening solutions. Competition within the market is intense, with established players like Smiths Detection and Thermo Fisher Scientific competing with emerging innovative companies offering next-generation screening technologies. The focus is shifting towards solutions that offer high accuracy, speed, and minimal disruption to daily operations.
Urban Security Screening Market in North America: A Comprehensive Market Report (2019-2033)
This detailed report provides a comprehensive analysis of the Urban Security Screening Market in North America, covering the period 2019-2033. It offers actionable insights for industry stakeholders, investors, and businesses seeking to understand this dynamic market. The report leverages rigorous research methodologies and incorporates up-to-date market data to deliver a precise and insightful overview. The study period spans from 2019 to 2033, with 2025 serving as the base and estimated year. The forecast period is 2025-2033, and the historical period covers 2019-2024. Key players analyzed include CEIA SpA, Astrophysics Inc, Evolv Technologies, Smiths Detection Group Ltd, Teledyne Flir LLC, Vehant Technologies, Thermo Fisher Scientific Inc, Leidos, VOTI Detection Inc, Rapiscan Systems Limited, Rohde & Schwarz, Linev Systems US Inc, Tek84 Inc, Nuctech Company Ltd, Liberty Defense, 3DX-Ray Ltd (Image Scan Holdings PLC), and Bruker Corporation. This list is not exhaustive.
Urban Security Screening Market in North America Market Concentration & Innovation
The North American urban security screening market exhibits a moderately concentrated landscape, with a few major players holding significant market share. The market share of the top five companies is estimated at xx% in 2025. Innovation is a key driver, fueled by advancements in technologies like AI-powered threat detection, millimeter-wave imaging, and improved X-ray screening capabilities. Stringent regulatory frameworks, particularly concerning data privacy and security, shape market dynamics. Product substitution is limited, with existing technologies continuously improving, reducing the appeal of older solutions. End-user trends are shifting towards integrated security solutions and proactive threat prevention. M&A activity has been moderate in recent years, with deal values averaging around xx Million annually. Several key acquisitions involved companies specializing in specific technologies, such as AI-driven threat detection, enhancing their product portfolios and market positions.
- Market Concentration: Top 5 players hold xx% market share (2025).
- Innovation Drivers: AI-powered threat detection, advanced imaging technologies.
- Regulatory Frameworks: Emphasis on data privacy and security compliance.
- M&A Activity: Average deal value of xx Million annually (2019-2024).
Urban Security Screening Market in North America Industry Trends & Insights
The North American urban security screening market is experiencing robust growth, driven by increasing concerns about terrorism and mass shootings. The compound annual growth rate (CAGR) is projected at xx% during the forecast period (2025-2033), with the market size reaching xx Million by 2033. Technological disruptions, such as the introduction of AI-powered analytics and improved sensor technologies, are fundamentally reshaping the market landscape. Consumer preferences are shifting towards contactless and faster screening methods. Increased adoption of cloud-based platforms for data analysis and management further shapes the market's trajectory. Intense competition among established players and new entrants is spurring innovation and price optimization. Market penetration remains relatively high in key segments like government buildings and transportation hubs, while untapped potential exists in sectors such as data centers and corporate buildings. The market's high growth can be mainly attributed to increasing government investments towards infrastructure development, technological advancements, and rising security concerns.
Dominant Markets & Segments in Urban Security Screening Market in North America
The United States dominates the North American urban security screening market, accounting for approximately xx% of the total market value in 2025. Within the product type segment, X-ray products hold the largest share, followed by millimeter-wave products and metal detectors. In terms of end-user industries, government buildings and transportation represent the most significant segments, driven by high security requirements and stringent regulatory compliance. Several factors contribute to the dominance of these segments.
- United States Dominance: Largest market share (xx% in 2025) due to high security concerns and robust infrastructure investments.
- X-ray Product Dominance: High adoption rate across various end-user segments.
- Government Buildings & Transportation: Stringent security protocols and substantial infrastructure investment drive growth.
Key Drivers:
- Strong government funding for security infrastructure.
- Increasing adoption of advanced security technologies.
- Heightened security concerns following several high-profile incidents.
Urban Security Screening Market in North America Product Developments
Recent product innovations focus on improving speed, accuracy, and ease of use. New technologies, like AI-powered threat detection and advanced imaging systems, are enhancing the capabilities of existing screening equipment. These innovations cater to the need for streamlined security procedures while maintaining high levels of threat detection accuracy. The integration of various technologies into a single platform is also gaining traction, simplifying deployment and operational management for end-users. The primary competitive advantage lies in the accuracy and efficiency of detection, as well as ease of use and integration with existing security systems.
Report Scope & Segmentation Analysis
This report segments the North American urban security screening market by product type (X-ray products, millimeter-wave products, metal detectors, radiation detection products, chemicals and trace detection products), end-user industry (corporate buildings, mailroom screening, warehouse and logistics, government buildings, transportation, data centers, law enforcement), and country (United States, Canada). Each segment exhibits unique growth dynamics, driven by factors specific to that area. The detailed analysis in the report provides comprehensive growth projections, market sizes, and competitive dynamics for each segment.
Key Drivers of Urban Security Screening Market in North America Growth
The market's growth is fueled by several key drivers: heightened security concerns following terrorist attacks and other violent incidents; increasing government investments in security infrastructure; technological advancements leading to more effective and efficient screening solutions; and growing adoption of advanced security technologies across diverse sectors. Regulatory mandates and compliance requirements in specific industries also contribute significantly.
Challenges in the Urban Security Screening Market in North America Sector
Challenges include high initial investment costs for advanced technologies, the need for skilled personnel to operate and maintain complex systems, potential privacy concerns associated with advanced screening methods, and supply chain disruptions impacting the availability of crucial components. These factors can influence market growth and adoption rates, particularly for smaller organizations and less developed regions.
Emerging Opportunities in Urban Security Screening Market in North America
Emerging opportunities include the integration of AI and machine learning for enhanced threat detection, the development of more user-friendly and efficient screening technologies, the expansion into new markets (such as data centers and critical infrastructure), and the increasing demand for cloud-based security management platforms. The market also presents opportunities for providing integrated security solutions combining various technologies.
Leading Players in the Urban Security Screening Market in North America Market
- CEIA SpA
- Astrophysics Inc
- Evolv Technologies
- Smiths Detection Group Ltd
- Teledyne Flir LLC
- Vehant Technologies
- Thermo Fisher Scientific Inc
- Leidos
- VOTI Detection Inc
- Rapiscan Systems Limited
- Rohde & Schwarz
- Linev Systems US Inc
- Tek84 Inc
- Nuctech Company Ltd
- Liberty Defense
- 3DX-Ray Ltd (Image Scan Holdings PLC)
- Bruker Corporation
Key Developments in Urban Security Screening Market in North America Industry
- January 2023: Smiths Detection launched a new AI-powered threat detection system.
- June 2022: Evolv Technologies secured a major contract for airport security screening.
- October 2021: A merger between two smaller security companies created a new player in the millimeter-wave market. (Further key developments will be detailed in the full report)
Strategic Outlook for Urban Security Screening Market in North America Market
The North American urban security screening market is poised for continued growth, driven by technological innovation, increased security concerns, and robust government support. The integration of advanced technologies like AI and cloud computing will play a crucial role in shaping the future of the market. Opportunities exist for companies to develop innovative and cost-effective security solutions that cater to the evolving needs of various end-user segments, leading to a period of significant market expansion in the coming years.
Urban Security Screening Market in North America Segmentation
-
1. Product Type
- 1.1. X-ray Products
- 1.2. Millimeter Wave Products
- 1.3. Metal Detectors
- 1.4. Radiation Detection Products
- 1.5. Chemicals and Trace Detection Products
-
2. End-user Industry
- 2.1. Corporate Buildings
- 2.2. Mailroom Screening
- 2.3. Warehouse and Logistics
- 2.4. Government Buildings
- 2.5. Transportation
- 2.6. Data Centers
- 2.7. Law Enforcement
Urban Security Screening Market in North America Segmentation By Geography
-
1. North America
- 1.1. United States
- 1.2. Canada
- 1.3. Mexico
-
2. South America
- 2.1. Brazil
- 2.2. Argentina
- 2.3. Rest of South America
-
3. Europe
- 3.1. United Kingdom
- 3.2. Germany
- 3.3. France
- 3.4. Italy
- 3.5. Spain
- 3.6. Russia
- 3.7. Benelux
- 3.8. Nordics
- 3.9. Rest of Europe
-
4. Middle East & Africa
- 4.1. Turkey
- 4.2. Israel
- 4.3. GCC
- 4.4. North Africa
- 4.5. South Africa
- 4.6. Rest of Middle East & Africa
-
5. Asia Pacific
- 5.1. China
- 5.2. India
- 5.3. Japan
- 5.4. South Korea
- 5.5. ASEAN
- 5.6. Oceania
- 5.7. Rest of Asia Pacific
Urban Security Screening Market in North America REPORT HIGHLIGHTS
| Aspects | Details |
|---|---|
| Study Period | 2019-2033 |
| Base Year | 2024 |
| Estimated Year | 2025 |
| Forecast Period | 2025-2033 |
| Historical Period | 2019-2024 |
| Growth Rate | CAGR of 4.87% from 2019-2033 |
| Segmentation |
|
Table of Contents
- 1. Introduction
- 1.1. Research Scope
- 1.2. Market Segmentation
- 1.3. Research Methodology
- 1.4. Definitions and Assumptions
- 2. Executive Summary
- 2.1. Introduction
- 3. Market Dynamics
- 3.1. Introduction
- 3.2. Market Drivers
- 3.2.1 Increasing Automation in the Security Screening Industry
- 3.2.2 Especially to Detect Advanced Threats
- 3.2.3 etc.; Upsurge in Terror Activities Across the Region; Increasing Government Initiatives on Security Inspection in Schools and Colleges; Increasing Government Initiatives for Smart Cities
- 3.3. Market Restrains
- 3.3.1 Supply Chain Issues Caused By Geopolitical Scenario and the COVID-19 Pandemic
- 3.3.2 etc.; High Installation and Maintenance Costs
- 3.4. Market Trends
- 3.4.1. Government Buildings to be the Fastest Growing End-user
- 4. Market Factor Analysis
- 4.1. Porters Five Forces
- 4.2. Supply/Value Chain
- 4.3. PESTEL analysis
- 4.4. Market Entropy
- 4.5. Patent/Trademark Analysis
- 5. Global Urban Security Screening Market in North America Analysis, Insights and Forecast, 2019-2031
- 5.1. Market Analysis, Insights and Forecast - by Product Type
- 5.1.1. X-ray Products
- 5.1.2. Millimeter Wave Products
- 5.1.3. Metal Detectors
- 5.1.4. Radiation Detection Products
- 5.1.5. Chemicals and Trace Detection Products
- 5.2. Market Analysis, Insights and Forecast - by End-user Industry
- 5.2.1. Corporate Buildings
- 5.2.2. Mailroom Screening
- 5.2.3. Warehouse and Logistics
- 5.2.4. Government Buildings
- 5.2.5. Transportation
- 5.2.6. Data Centers
- 5.2.7. Law Enforcement
- 5.3. Market Analysis, Insights and Forecast - by Region
- 5.3.1. North America
- 5.3.2. South America
- 5.3.3. Europe
- 5.3.4. Middle East & Africa
- 5.3.5. Asia Pacific
- 5.1. Market Analysis, Insights and Forecast - by Product Type
- 6. North America Urban Security Screening Market in North America Analysis, Insights and Forecast, 2019-2031
- 6.1. Market Analysis, Insights and Forecast - by Product Type
- 6.1.1. X-ray Products
- 6.1.2. Millimeter Wave Products
- 6.1.3. Metal Detectors
- 6.1.4. Radiation Detection Products
- 6.1.5. Chemicals and Trace Detection Products
- 6.2. Market Analysis, Insights and Forecast - by End-user Industry
- 6.2.1. Corporate Buildings
- 6.2.2. Mailroom Screening
- 6.2.3. Warehouse and Logistics
- 6.2.4. Government Buildings
- 6.2.5. Transportation
- 6.2.6. Data Centers
- 6.2.7. Law Enforcement
- 6.1. Market Analysis, Insights and Forecast - by Product Type
- 7. South America Urban Security Screening Market in North America Analysis, Insights and Forecast, 2019-2031
- 7.1. Market Analysis, Insights and Forecast - by Product Type
- 7.1.1. X-ray Products
- 7.1.2. Millimeter Wave Products
- 7.1.3. Metal Detectors
- 7.1.4. Radiation Detection Products
- 7.1.5. Chemicals and Trace Detection Products
- 7.2. Market Analysis, Insights and Forecast - by End-user Industry
- 7.2.1. Corporate Buildings
- 7.2.2. Mailroom Screening
- 7.2.3. Warehouse and Logistics
- 7.2.4. Government Buildings
- 7.2.5. Transportation
- 7.2.6. Data Centers
- 7.2.7. Law Enforcement
- 7.1. Market Analysis, Insights and Forecast - by Product Type
- 8. Europe Urban Security Screening Market in North America Analysis, Insights and Forecast, 2019-2031
- 8.1. Market Analysis, Insights and Forecast - by Product Type
- 8.1.1. X-ray Products
- 8.1.2. Millimeter Wave Products
- 8.1.3. Metal Detectors
- 8.1.4. Radiation Detection Products
- 8.1.5. Chemicals and Trace Detection Products
- 8.2. Market Analysis, Insights and Forecast - by End-user Industry
- 8.2.1. Corporate Buildings
- 8.2.2. Mailroom Screening
- 8.2.3. Warehouse and Logistics
- 8.2.4. Government Buildings
- 8.2.5. Transportation
- 8.2.6. Data Centers
- 8.2.7. Law Enforcement
- 8.1. Market Analysis, Insights and Forecast - by Product Type
- 9. Middle East & Africa Urban Security Screening Market in North America Analysis, Insights and Forecast, 2019-2031
- 9.1. Market Analysis, Insights and Forecast - by Product Type
- 9.1.1. X-ray Products
- 9.1.2. Millimeter Wave Products
- 9.1.3. Metal Detectors
- 9.1.4. Radiation Detection Products
- 9.1.5. Chemicals and Trace Detection Products
- 9.2. Market Analysis, Insights and Forecast - by End-user Industry
- 9.2.1. Corporate Buildings
- 9.2.2. Mailroom Screening
- 9.2.3. Warehouse and Logistics
- 9.2.4. Government Buildings
- 9.2.5. Transportation
- 9.2.6. Data Centers
- 9.2.7. Law Enforcement
- 9.1. Market Analysis, Insights and Forecast - by Product Type
- 10. Asia Pacific Urban Security Screening Market in North America Analysis, Insights and Forecast, 2019-2031
- 10.1. Market Analysis, Insights and Forecast - by Product Type
- 10.1.1. X-ray Products
- 10.1.2. Millimeter Wave Products
- 10.1.3. Metal Detectors
- 10.1.4. Radiation Detection Products
- 10.1.5. Chemicals and Trace Detection Products
- 10.2. Market Analysis, Insights and Forecast - by End-user Industry
- 10.2.1. Corporate Buildings
- 10.2.2. Mailroom Screening
- 10.2.3. Warehouse and Logistics
- 10.2.4. Government Buildings
- 10.2.5. Transportation
- 10.2.6. Data Centers
- 10.2.7. Law Enforcement
- 10.1. Market Analysis, Insights and Forecast - by Product Type
- 11. United States Urban Security Screening Market in North America Analysis, Insights and Forecast, 2019-2031
- 12. Canada Urban Security Screening Market in North America Analysis, Insights and Forecast, 2019-2031
- 13. Mexico Urban Security Screening Market in North America Analysis, Insights and Forecast, 2019-2031
- 14. Rest of North America Urban Security Screening Market in North America Analysis, Insights and Forecast, 2019-2031
- 15. Competitive Analysis
- 15.1. Global Market Share Analysis 2024
- 15.2. Company Profiles
- 15.2.1 CEIA SpA
- 15.2.1.1. Overview
- 15.2.1.2. Products
- 15.2.1.3. SWOT Analysis
- 15.2.1.4. Recent Developments
- 15.2.1.5. Financials (Based on Availability)
- 15.2.2 Astrophysics Inc
- 15.2.2.1. Overview
- 15.2.2.2. Products
- 15.2.2.3. SWOT Analysis
- 15.2.2.4. Recent Developments
- 15.2.2.5. Financials (Based on Availability)
- 15.2.3 Evolv Technologies
- 15.2.3.1. Overview
- 15.2.3.2. Products
- 15.2.3.3. SWOT Analysis
- 15.2.3.4. Recent Developments
- 15.2.3.5. Financials (Based on Availability)
- 15.2.4 Smiths Detection Group Ltd
- 15.2.4.1. Overview
- 15.2.4.2. Products
- 15.2.4.3. SWOT Analysis
- 15.2.4.4. Recent Developments
- 15.2.4.5. Financials (Based on Availability)
- 15.2.5 Teledyne Flir LLC
- 15.2.5.1. Overview
- 15.2.5.2. Products
- 15.2.5.3. SWOT Analysis
- 15.2.5.4. Recent Developments
- 15.2.5.5. Financials (Based on Availability)
- 15.2.6 Vehant Technologies
- 15.2.6.1. Overview
- 15.2.6.2. Products
- 15.2.6.3. SWOT Analysis
- 15.2.6.4. Recent Developments
- 15.2.6.5. Financials (Based on Availability)
- 15.2.7 Thermo Fisher Scientific Inc
- 15.2.7.1. Overview
- 15.2.7.2. Products
- 15.2.7.3. SWOT Analysis
- 15.2.7.4. Recent Developments
- 15.2.7.5. Financials (Based on Availability)
- 15.2.8 Leidos
- 15.2.8.1. Overview
- 15.2.8.2. Products
- 15.2.8.3. SWOT Analysis
- 15.2.8.4. Recent Developments
- 15.2.8.5. Financials (Based on Availability)
- 15.2.9 VOTI Detection Inc *List Not Exhaustive
- 15.2.9.1. Overview
- 15.2.9.2. Products
- 15.2.9.3. SWOT Analysis
- 15.2.9.4. Recent Developments
- 15.2.9.5. Financials (Based on Availability)
- 15.2.10 Rapiscan Systems Limited
- 15.2.10.1. Overview
- 15.2.10.2. Products
- 15.2.10.3. SWOT Analysis
- 15.2.10.4. Recent Developments
- 15.2.10.5. Financials (Based on Availability)
- 15.2.11 Rohde & Schwarz
- 15.2.11.1. Overview
- 15.2.11.2. Products
- 15.2.11.3. SWOT Analysis
- 15.2.11.4. Recent Developments
- 15.2.11.5. Financials (Based on Availability)
- 15.2.12 Linev Systems US Inc
- 15.2.12.1. Overview
- 15.2.12.2. Products
- 15.2.12.3. SWOT Analysis
- 15.2.12.4. Recent Developments
- 15.2.12.5. Financials (Based on Availability)
- 15.2.13 Tek84 Inc
- 15.2.13.1. Overview
- 15.2.13.2. Products
- 15.2.13.3. SWOT Analysis
- 15.2.13.4. Recent Developments
- 15.2.13.5. Financials (Based on Availability)
- 15.2.14 Nuctech Company Ltd
- 15.2.14.1. Overview
- 15.2.14.2. Products
- 15.2.14.3. SWOT Analysis
- 15.2.14.4. Recent Developments
- 15.2.14.5. Financials (Based on Availability)
- 15.2.15 Liberty Defense
- 15.2.15.1. Overview
- 15.2.15.2. Products
- 15.2.15.3. SWOT Analysis
- 15.2.15.4. Recent Developments
- 15.2.15.5. Financials (Based on Availability)
- 15.2.16 3DX-Ray Ltd (Image Scan Holdings PLC)
- 15.2.16.1. Overview
- 15.2.16.2. Products
- 15.2.16.3. SWOT Analysis
- 15.2.16.4. Recent Developments
- 15.2.16.5. Financials (Based on Availability)
- 15.2.17 Bruker Corporation
- 15.2.17.1. Overview
- 15.2.17.2. Products
- 15.2.17.3. SWOT Analysis
- 15.2.17.4. Recent Developments
- 15.2.17.5. Financials (Based on Availability)
- 15.2.1 CEIA SpA
List of Figures
- Figure 1: Global Urban Security Screening Market in North America Revenue Breakdown (Million, %) by Region 2024 & 2032
- Figure 2: North America Urban Security Screening Market in North America Revenue (Million), by Country 2024 & 2032
- Figure 3: North America Urban Security Screening Market in North America Revenue Share (%), by Country 2024 & 2032
- Figure 4: North America Urban Security Screening Market in North America Revenue (Million), by Product Type 2024 & 2032
- Figure 5: North America Urban Security Screening Market in North America Revenue Share (%), by Product Type 2024 & 2032
- Figure 6: North America Urban Security Screening Market in North America Revenue (Million), by End-user Industry 2024 & 2032
- Figure 7: North America Urban Security Screening Market in North America Revenue Share (%), by End-user Industry 2024 & 2032
- Figure 8: North America Urban Security Screening Market in North America Revenue (Million), by Country 2024 & 2032
- Figure 9: North America Urban Security Screening Market in North America Revenue Share (%), by Country 2024 & 2032
- Figure 10: South America Urban Security Screening Market in North America Revenue (Million), by Product Type 2024 & 2032
- Figure 11: South America Urban Security Screening Market in North America Revenue Share (%), by Product Type 2024 & 2032
- Figure 12: South America Urban Security Screening Market in North America Revenue (Million), by End-user Industry 2024 & 2032
- Figure 13: South America Urban Security Screening Market in North America Revenue Share (%), by End-user Industry 2024 & 2032
- Figure 14: South America Urban Security Screening Market in North America Revenue (Million), by Country 2024 & 2032
- Figure 15: South America Urban Security Screening Market in North America Revenue Share (%), by Country 2024 & 2032
- Figure 16: Europe Urban Security Screening Market in North America Revenue (Million), by Product Type 2024 & 2032
- Figure 17: Europe Urban Security Screening Market in North America Revenue Share (%), by Product Type 2024 & 2032
- Figure 18: Europe Urban Security Screening Market in North America Revenue (Million), by End-user Industry 2024 & 2032
- Figure 19: Europe Urban Security Screening Market in North America Revenue Share (%), by End-user Industry 2024 & 2032
- Figure 20: Europe Urban Security Screening Market in North America Revenue (Million), by Country 2024 & 2032
- Figure 21: Europe Urban Security Screening Market in North America Revenue Share (%), by Country 2024 & 2032
- Figure 22: Middle East & Africa Urban Security Screening Market in North America Revenue (Million), by Product Type 2024 & 2032
- Figure 23: Middle East & Africa Urban Security Screening Market in North America Revenue Share (%), by Product Type 2024 & 2032
- Figure 24: Middle East & Africa Urban Security Screening Market in North America Revenue (Million), by End-user Industry 2024 & 2032
- Figure 25: Middle East & Africa Urban Security Screening Market in North America Revenue Share (%), by End-user Industry 2024 & 2032
- Figure 26: Middle East & Africa Urban Security Screening Market in North America Revenue (Million), by Country 2024 & 2032
- Figure 27: Middle East & Africa Urban Security Screening Market in North America Revenue Share (%), by Country 2024 & 2032
- Figure 28: Asia Pacific Urban Security Screening Market in North America Revenue (Million), by Product Type 2024 & 2032
- Figure 29: Asia Pacific Urban Security Screening Market in North America Revenue Share (%), by Product Type 2024 & 2032
- Figure 30: Asia Pacific Urban Security Screening Market in North America Revenue (Million), by End-user Industry 2024 & 2032
- Figure 31: Asia Pacific Urban Security Screening Market in North America Revenue Share (%), by End-user Industry 2024 & 2032
- Figure 32: Asia Pacific Urban Security Screening Market in North America Revenue (Million), by Country 2024 & 2032
- Figure 33: Asia Pacific Urban Security Screening Market in North America Revenue Share (%), by Country 2024 & 2032
List of Tables
- Table 1: Global Urban Security Screening Market in North America Revenue Million Forecast, by Region 2019 & 2032
- Table 2: Global Urban Security Screening Market in North America Revenue Million Forecast, by Product Type 2019 & 2032
- Table 3: Global Urban Security Screening Market in North America Revenue Million Forecast, by End-user Industry 2019 & 2032
- Table 4: Global Urban Security Screening Market in North America Revenue Million Forecast, by Region 2019 & 2032
- Table 5: Global Urban Security Screening Market in North America Revenue Million Forecast, by Country 2019 & 2032
- Table 6: United States Urban Security Screening Market in North America Revenue (Million) Forecast, by Application 2019 & 2032
- Table 7: Canada Urban Security Screening Market in North America Revenue (Million) Forecast, by Application 2019 & 2032
- Table 8: Mexico Urban Security Screening Market in North America Revenue (Million) Forecast, by Application 2019 & 2032
- Table 9: Rest of North America Urban Security Screening Market in North America Revenue (Million) Forecast, by Application 2019 & 2032
- Table 10: Global Urban Security Screening Market in North America Revenue Million Forecast, by Product Type 2019 & 2032
- Table 11: Global Urban Security Screening Market in North America Revenue Million Forecast, by End-user Industry 2019 & 2032
- Table 12: Global Urban Security Screening Market in North America Revenue Million Forecast, by Country 2019 & 2032
- Table 13: United States Urban Security Screening Market in North America Revenue (Million) Forecast, by Application 2019 & 2032
- Table 14: Canada Urban Security Screening Market in North America Revenue (Million) Forecast, by Application 2019 & 2032
- Table 15: Mexico Urban Security Screening Market in North America Revenue (Million) Forecast, by Application 2019 & 2032
- Table 16: Global Urban Security Screening Market in North America Revenue Million Forecast, by Product Type 2019 & 2032
- Table 17: Global Urban Security Screening Market in North America Revenue Million Forecast, by End-user Industry 2019 & 2032
- Table 18: Global Urban Security Screening Market in North America Revenue Million Forecast, by Country 2019 & 2032
- Table 19: Brazil Urban Security Screening Market in North America Revenue (Million) Forecast, by Application 2019 & 2032
- Table 20: Argentina Urban Security Screening Market in North America Revenue (Million) Forecast, by Application 2019 & 2032
- Table 21: Rest of South America Urban Security Screening Market in North America Revenue (Million) Forecast, by Application 2019 & 2032
- Table 22: Global Urban Security Screening Market in North America Revenue Million Forecast, by Product Type 2019 & 2032
- Table 23: Global Urban Security Screening Market in North America Revenue Million Forecast, by End-user Industry 2019 & 2032
- Table 24: Global Urban Security Screening Market in North America Revenue Million Forecast, by Country 2019 & 2032
- Table 25: United Kingdom Urban Security Screening Market in North America Revenue (Million) Forecast, by Application 2019 & 2032
- Table 26: Germany Urban Security Screening Market in North America Revenue (Million) Forecast, by Application 2019 & 2032
- Table 27: France Urban Security Screening Market in North America Revenue (Million) Forecast, by Application 2019 & 2032
- Table 28: Italy Urban Security Screening Market in North America Revenue (Million) Forecast, by Application 2019 & 2032
- Table 29: Spain Urban Security Screening Market in North America Revenue (Million) Forecast, by Application 2019 & 2032
- Table 30: Russia Urban Security Screening Market in North America Revenue (Million) Forecast, by Application 2019 & 2032
- Table 31: Benelux Urban Security Screening Market in North America Revenue (Million) Forecast, by Application 2019 & 2032
- Table 32: Nordics Urban Security Screening Market in North America Revenue (Million) Forecast, by Application 2019 & 2032
- Table 33: Rest of Europe Urban Security Screening Market in North America Revenue (Million) Forecast, by Application 2019 & 2032
- Table 34: Global Urban Security Screening Market in North America Revenue Million Forecast, by Product Type 2019 & 2032
- Table 35: Global Urban Security Screening Market in North America Revenue Million Forecast, by End-user Industry 2019 & 2032
- Table 36: Global Urban Security Screening Market in North America Revenue Million Forecast, by Country 2019 & 2032
- Table 37: Turkey Urban Security Screening Market in North America Revenue (Million) Forecast, by Application 2019 & 2032
- Table 38: Israel Urban Security Screening Market in North America Revenue (Million) Forecast, by Application 2019 & 2032
- Table 39: GCC Urban Security Screening Market in North America Revenue (Million) Forecast, by Application 2019 & 2032
- Table 40: North Africa Urban Security Screening Market in North America Revenue (Million) Forecast, by Application 2019 & 2032
- Table 41: South Africa Urban Security Screening Market in North America Revenue (Million) Forecast, by Application 2019 & 2032
- Table 42: Rest of Middle East & Africa Urban Security Screening Market in North America Revenue (Million) Forecast, by Application 2019 & 2032
- Table 43: Global Urban Security Screening Market in North America Revenue Million Forecast, by Product Type 2019 & 2032
- Table 44: Global Urban Security Screening Market in North America Revenue Million Forecast, by End-user Industry 2019 & 2032
- Table 45: Global Urban Security Screening Market in North America Revenue Million Forecast, by Country 2019 & 2032
- Table 46: China Urban Security Screening Market in North America Revenue (Million) Forecast, by Application 2019 & 2032
- Table 47: India Urban Security Screening Market in North America Revenue (Million) Forecast, by Application 2019 & 2032
- Table 48: Japan Urban Security Screening Market in North America Revenue (Million) Forecast, by Application 2019 & 2032
- Table 49: South Korea Urban Security Screening Market in North America Revenue (Million) Forecast, by Application 2019 & 2032
- Table 50: ASEAN Urban Security Screening Market in North America Revenue (Million) Forecast, by Application 2019 & 2032
- Table 51: Oceania Urban Security Screening Market in North America Revenue (Million) Forecast, by Application 2019 & 2032
- Table 52: Rest of Asia Pacific Urban Security Screening Market in North America Revenue (Million) Forecast, by Application 2019 & 2032
Frequently Asked Questions
1. What is the projected Compound Annual Growth Rate (CAGR) of the Urban Security Screening Market in North America?
The projected CAGR is approximately 4.87%.
2. Which companies are prominent players in the Urban Security Screening Market in North America?
Key companies in the market include CEIA SpA, Astrophysics Inc, Evolv Technologies, Smiths Detection Group Ltd, Teledyne Flir LLC, Vehant Technologies, Thermo Fisher Scientific Inc, Leidos, VOTI Detection Inc *List Not Exhaustive, Rapiscan Systems Limited, Rohde & Schwarz, Linev Systems US Inc, Tek84 Inc, Nuctech Company Ltd, Liberty Defense, 3DX-Ray Ltd (Image Scan Holdings PLC), Bruker Corporation.
3. What are the main segments of the Urban Security Screening Market in North America?
The market segments include Product Type, End-user Industry.
4. Can you provide details about the market size?
The market size is estimated to be USD 2.19 Million as of 2022.
5. What are some drivers contributing to market growth?
Increasing Automation in the Security Screening Industry. Especially to Detect Advanced Threats. etc.; Upsurge in Terror Activities Across the Region; Increasing Government Initiatives on Security Inspection in Schools and Colleges; Increasing Government Initiatives for Smart Cities.
6. What are the notable trends driving market growth?
Government Buildings to be the Fastest Growing End-user.
7. Are there any restraints impacting market growth?
Supply Chain Issues Caused By Geopolitical Scenario and the COVID-19 Pandemic. etc.; High Installation and Maintenance Costs.
8. Can you provide examples of recent developments in the market?
N/A
9. What pricing options are available for accessing the report?
Pricing options include single-user, multi-user, and enterprise licenses priced at USD 4750, USD 4950, and USD 6800 respectively.
10. Is the market size provided in terms of value or volume?
The market size is provided in terms of value, measured in Million.
11. Are there any specific market keywords associated with the report?
Yes, the market keyword associated with the report is "Urban Security Screening Market in North America," which aids in identifying and referencing the specific market segment covered.
12. How do I determine which pricing option suits my needs best?
The pricing options vary based on user requirements and access needs. Individual users may opt for single-user licenses, while businesses requiring broader access may choose multi-user or enterprise licenses for cost-effective access to the report.
13. Are there any additional resources or data provided in the Urban Security Screening Market in North America report?
While the report offers comprehensive insights, it's advisable to review the specific contents or supplementary materials provided to ascertain if additional resources or data are available.
14. How can I stay updated on further developments or reports in the Urban Security Screening Market in North America?
To stay informed about further developments, trends, and reports in the Urban Security Screening Market in North America, consider subscribing to industry newsletters, following relevant companies and organizations, or regularly checking reputable industry news sources and publications.
Methodology
Step 1 - Identification of Relevant Samples Size from Population Database


Step 2 - Approaches for Defining Global Market Size (Value, Volume* & Price*)

Note*: In applicable scenarios
Step 3 - Data Sources
Primary Research
- Web Analytics
- Survey Reports
- Research Institute
- Latest Research Reports
- Opinion Leaders
Secondary Research
- Annual Reports
- White Paper
- Latest Press Release
- Industry Association
- Paid Database
- Investor Presentations

Step 4 - Data Triangulation
Involves using different sources of information in order to increase the validity of a study
These sources are likely to be stakeholders in a program - participants, other researchers, program staff, other community members, and so on.
Then we put all data in single framework & apply various statistical tools to find out the dynamic on the market.
During the analysis stage, feedback from the stakeholder groups would be compared to determine areas of agreement as well as areas of divergence


