
Key Insights
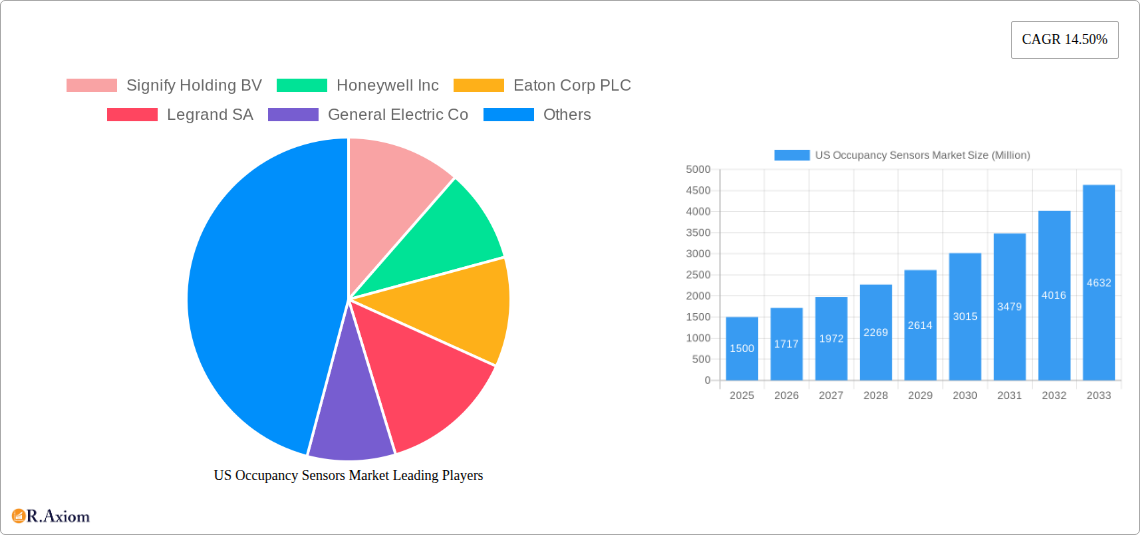
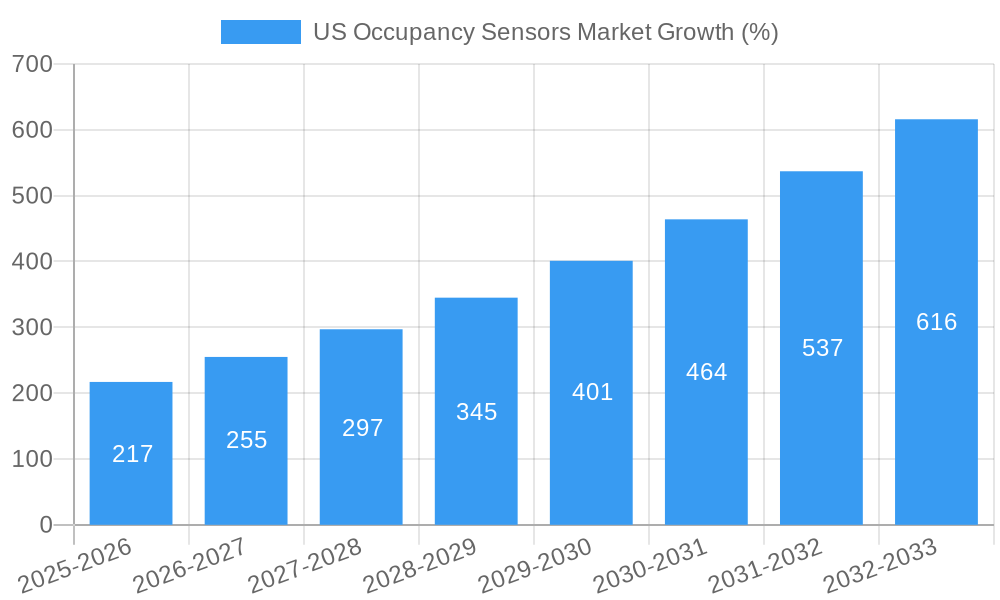
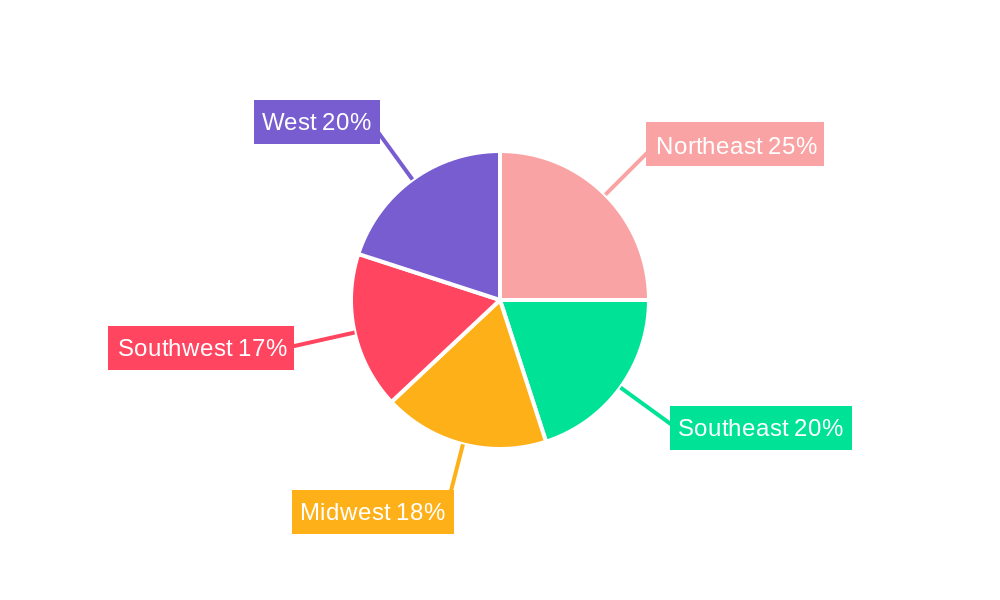
The US occupancy sensor market is experiencing robust growth, driven by increasing demand for energy efficiency in commercial and residential buildings. The market, valued at approximately $1.5 billion in 2025, is projected to expand at a compound annual growth rate (CAGR) of 14.5% from 2025 to 2033. This growth is fueled by several key factors. Stringent energy regulations and rising energy costs are incentivizing building owners and managers to adopt energy-saving technologies, with occupancy sensors playing a crucial role. Furthermore, the increasing adoption of smart building technologies and the Internet of Things (IoT) is driving demand for advanced occupancy sensors with integrated features such as remote monitoring and control. The market is segmented by application (lighting control, HVAC, security & surveillance), building type (residential, commercial), network type (wired, wireless), and technology (ultrasonic, passive infrared, microwave). The commercial sector currently dominates the market due to higher adoption rates in office spaces, retail establishments, and industrial facilities, while wireless sensors are gaining popularity due to their ease of installation and flexibility. Geographic variations exist, with regions such as the Northeast and West showing faster growth compared to others due to higher adoption of energy-efficient building practices.
Technological advancements continue to shape the market landscape. The shift towards more sophisticated sensor technologies, such as those incorporating artificial intelligence (AI) for improved accuracy and data analytics, is expected to fuel further market expansion. However, factors such as the relatively high initial investment cost for sensor installation and concerns regarding data privacy and security could pose challenges to market growth. Despite these potential restraints, the long-term growth outlook for the US occupancy sensor market remains positive, driven by strong environmental and economic incentives for energy efficiency and the continuous integration of smart technologies into building infrastructure. The market is expected to witness further consolidation as larger players continue to acquire smaller companies to expand their product portfolios and market reach.
US Occupancy Sensors Market: A Comprehensive Report (2019-2033)
This detailed report provides a comprehensive analysis of the US Occupancy Sensors Market, encompassing market size, segmentation, growth drivers, challenges, and key players. The study period covers 2019-2033, with 2025 as the base and estimated year, and a forecast period of 2025-2033. The historical period analyzed is 2019-2024. This report is crucial for industry stakeholders, investors, and businesses seeking to understand and capitalize on opportunities within this dynamic market.
US Occupancy Sensors Market Concentration & Innovation
The US occupancy sensors market exhibits a moderately concentrated landscape, with key players like Signify Holding BV, Honeywell Inc, Eaton Corp PLC, Legrand SA, and General Electric Co holding significant market share. The exact market share distribution for 2025 is currently under analysis and will be presented in the full report (estimated at xx%). However, the market is characterized by both established players and emerging companies driving innovation.
Innovation Drivers:
- Technological Advancements: The integration of IoT, AI, and advanced sensor technologies (e.g., ultrasonic, microwave, and LiDAR) is fueling innovation, leading to more accurate, energy-efficient, and feature-rich solutions.
- Smart Building Initiatives: The growing adoption of smart building technologies is significantly driving the demand for occupancy sensors for efficient energy management and enhanced security.
- Government Regulations: Regulations promoting energy efficiency and building automation are creating a favorable environment for occupancy sensor adoption.
Regulatory Frameworks & Product Substitutes: The market is subject to building codes and energy efficiency standards, which influence product design and adoption. While no direct substitutes exist, alternative solutions such as manual controls or timer-based systems offer limited functionality and are less efficient.
End-User Trends & M&A Activities: End-users increasingly prioritize cost savings, energy efficiency, and improved security. Recent M&A activity in the market (total deal value for the period 2019-2024 estimated at $xx Million) reflects a push toward consolidation and expansion into new technologies and markets.
US Occupancy Sensors Market Industry Trends & Insights
The US occupancy sensors market is experiencing robust growth, driven by increasing demand for energy-efficient solutions, the proliferation of smart buildings, and the advancement of sensor technologies. The market is projected to exhibit a CAGR of xx% during the forecast period (2025-2033). Market penetration in commercial buildings is higher than in residential sectors, primarily due to higher initial investment in smart building infrastructure. However, the residential sector is showing promising growth with rising adoption of smart home technologies.
Technological disruptions, such as the emergence of low-power wide-area network (LPWAN) technologies, are enabling the deployment of wireless sensor networks across large areas, reducing installation costs and improving scalability. Consumer preferences are shifting towards integrated solutions that offer seamless data integration with building management systems (BMS). The competitive landscape is characterized by intense rivalry among established players and new entrants, leading to continuous product innovation and price competition.
Dominant Markets & Segments in US Occupancy Sensors Market
By Application: Lighting control holds the largest market share, followed by HVAC and security & surveillance. The growth in smart lighting solutions fuels the lighting control segment's dominance.
By Building Type: The commercial segment is currently dominant, driven by the higher adoption of occupancy sensors in office buildings, retail spaces, and industrial facilities. However, the residential segment is witnessing faster growth due to rising consumer interest in smart home automation.
By Network Type: Wireless sensors are gaining traction over wired sensors due to easy installation, flexible deployment, and lower costs, while wired sensors still retain a significant market share due to their reliability and security features.
By Technology: Passive infrared (PIR) sensors currently dominate the market due to their cost-effectiveness and reliability. However, ultrasonic and microwave sensors are gaining popularity due to their improved accuracy and ability to detect movement through obstacles.
- Key Drivers (Commercial Segment):
- High initial investment in smart building technologies.
- Stringent energy efficiency regulations.
- Increased focus on workplace optimization.
- Key Drivers (Residential Segment):
- Rising disposable incomes and demand for improved home security.
- Increased awareness of energy efficiency benefits.
- Growing adoption of smart home devices.
US Occupancy Sensors Market Product Developments
Recent product innovations focus on enhancing sensor accuracy, reducing power consumption, and improving data analytics capabilities. This includes the integration of advanced algorithms for occupancy detection and sophisticated data processing for energy management applications. New products emphasize seamless integration with building management systems and cloud-based platforms to provide real-time insights and remote monitoring. These advancements cater to the growing demand for integrated solutions that offer efficiency, enhanced security, and data-driven decision-making in smart buildings.
Report Scope & Segmentation Analysis
This report segments the US occupancy sensors market by application (lighting control, HVAC, security and surveillance), building type (residential, commercial), network type (wired, wireless), and technology (ultrasonic, passive infrared, microwave). Each segment is analyzed in terms of its market size, growth rate, competitive dynamics, and key drivers. The report provides detailed forecasts for each segment over the forecast period (2025-2033). Growth projections vary considerably across segments; for instance, the wireless segment is expected to demonstrate faster growth than wired sensors, while the commercial building segment is projected to maintain a larger market size compared to the residential segment.
Key Drivers of US Occupancy Sensors Market Growth
The market growth is primarily driven by:
- Energy Efficiency Regulations: Stringent regulations mandating energy-efficient building designs are driving the adoption of occupancy sensors.
- Smart Building Trends: The increasing popularity of smart buildings and automation systems boosts demand for occupancy sensors for optimized energy consumption and enhanced security.
- Technological Advancements: Continuous advancements in sensor technology, including improved accuracy, lower power consumption, and increased connectivity options, are fueling market expansion.
- Cost Savings: Implementing occupancy sensors contributes to significant cost reductions in energy and operational expenses over the long term.
Challenges in the US Occupancy Sensors Market Sector
The market faces challenges like:
- High Initial Investment: The initial cost of installation can be substantial, particularly for large commercial buildings, potentially hindering adoption, especially in smaller businesses.
- Interoperability Issues: Lack of standardization and interoperability among different sensor brands and systems can complicate integration with existing building management systems.
- Data Security Concerns: Concerns regarding data privacy and security associated with collecting and transmitting occupancy data might limit adoption, especially for sensitive applications. This represents a potential market constraint (estimated at xx% reduction in adoption rate in 2024, for example).
Emerging Opportunities in US Occupancy Sensors Market
Several promising opportunities are emerging:
- Integration with IoT Platforms: The integration of occupancy sensors with broader IoT ecosystems offers substantial potential for enhanced building management and data analytics.
- Advanced Analytics & AI: Incorporating AI and machine learning capabilities allows for predictive maintenance and occupant behavior analysis, offering valuable insights for optimized energy management and facility operations.
- Expansion into New Applications: Expansion into new applications, such as healthcare facilities and industrial settings, presents substantial growth opportunities.
Leading Players in the US Occupancy Sensors Market Market
- Signify Holding BV
- Honeywell Inc
- Eaton Corp PLC
- Legrand SA
- General Electric Co
- Dwyer Instruments Inc
- Schneider Electric SE
- Johnson Controls Inc
- Analog Devices Inc
- Texas Instruments Inc
- *List Not Exhaustive
Key Developments in US Occupancy Sensors Market Industry
- March 2020: Signify introduced new Philips IoT sensor packages that gather and deliver data via the Interact Office connected lighting system and environmental monitoring APIs. These sensor bundles monitor occupancy, number of people, temperature, noise levels, daylight, and humidity, and are Bluetooth enabled for indoor positioning. This launch significantly impacted the market by expanding the capabilities of smart building systems.
Strategic Outlook for US Occupancy Sensors Market Market
The US occupancy sensors market presents a promising outlook, driven by the sustained growth of smart buildings, technological innovations, and stringent energy efficiency regulations. The integration of AI and IoT will transform occupancy sensor technology, improving energy management, security, and workspace optimization. Continued expansion into new applications and markets offers lucrative opportunities for businesses to capitalize on this rapidly evolving sector. The market is expected to maintain strong growth in the coming years, driven by the growing demand for energy-efficient building solutions, advancements in sensor technology, and the increasing adoption of smart home and smart building technologies.
US Occupancy Sensors Market Segmentation
-
1. Network Type
- 1.1. Wired
- 1.2. Wireless
-
2. Technology
- 2.1. Ultrasonic
- 2.2. Passive Infrared
- 2.3. Microwave
-
3. Application
- 3.1. Lighting Control
- 3.2. HVAC
- 3.3. Security and Surveillance
-
4. Building Type
- 4.1. Residential
- 4.2. Commercial
US Occupancy Sensors Market Segmentation By Geography
-
1. North America
- 1.1. United States
- 1.2. Canada
- 1.3. Mexico
-
2. South America
- 2.1. Brazil
- 2.2. Argentina
- 2.3. Rest of South America
-
3. Europe
- 3.1. United Kingdom
- 3.2. Germany
- 3.3. France
- 3.4. Italy
- 3.5. Spain
- 3.6. Russia
- 3.7. Benelux
- 3.8. Nordics
- 3.9. Rest of Europe
-
4. Middle East & Africa
- 4.1. Turkey
- 4.2. Israel
- 4.3. GCC
- 4.4. North Africa
- 4.5. South Africa
- 4.6. Rest of Middle East & Africa
-
5. Asia Pacific
- 5.1. China
- 5.2. India
- 5.3. Japan
- 5.4. South Korea
- 5.5. ASEAN
- 5.6. Oceania
- 5.7. Rest of Asia Pacific
US Occupancy Sensors Market REPORT HIGHLIGHTS
| Aspects | Details |
|---|---|
| Study Period | 2019-2033 |
| Base Year | 2024 |
| Estimated Year | 2025 |
| Forecast Period | 2025-2033 |
| Historical Period | 2019-2024 |
| Growth Rate | CAGR of 14.50% from 2019-2033 |
| Segmentation |
|
Table of Contents
- 1. Introduction
- 1.1. Research Scope
- 1.2. Market Segmentation
- 1.3. Research Methodology
- 1.4. Definitions and Assumptions
- 2. Executive Summary
- 2.1. Introduction
- 3. Market Dynamics
- 3.1. Introduction
- 3.2. Market Drivers
- 3.2.1. Rising Demand for Energy Efficient Devices; Demand for Passive Infrared Due to Low Cost and High Energy Efficiency
- 3.3. Market Restrains
- 3.3.1. Cryptojacking Threats
- 3.4. Market Trends
- 3.4.1. Residential Expected to Witness Significant Growth
- 4. Market Factor Analysis
- 4.1. Porters Five Forces
- 4.2. Supply/Value Chain
- 4.3. PESTEL analysis
- 4.4. Market Entropy
- 4.5. Patent/Trademark Analysis
- 5. Global US Occupancy Sensors Market Analysis, Insights and Forecast, 2019-2031
- 5.1. Market Analysis, Insights and Forecast - by Network Type
- 5.1.1. Wired
- 5.1.2. Wireless
- 5.2. Market Analysis, Insights and Forecast - by Technology
- 5.2.1. Ultrasonic
- 5.2.2. Passive Infrared
- 5.2.3. Microwave
- 5.3. Market Analysis, Insights and Forecast - by Application
- 5.3.1. Lighting Control
- 5.3.2. HVAC
- 5.3.3. Security and Surveillance
- 5.4. Market Analysis, Insights and Forecast - by Building Type
- 5.4.1. Residential
- 5.4.2. Commercial
- 5.5. Market Analysis, Insights and Forecast - by Region
- 5.5.1. North America
- 5.5.2. South America
- 5.5.3. Europe
- 5.5.4. Middle East & Africa
- 5.5.5. Asia Pacific
- 5.1. Market Analysis, Insights and Forecast - by Network Type
- 6. North America US Occupancy Sensors Market Analysis, Insights and Forecast, 2019-2031
- 6.1. Market Analysis, Insights and Forecast - by Network Type
- 6.1.1. Wired
- 6.1.2. Wireless
- 6.2. Market Analysis, Insights and Forecast - by Technology
- 6.2.1. Ultrasonic
- 6.2.2. Passive Infrared
- 6.2.3. Microwave
- 6.3. Market Analysis, Insights and Forecast - by Application
- 6.3.1. Lighting Control
- 6.3.2. HVAC
- 6.3.3. Security and Surveillance
- 6.4. Market Analysis, Insights and Forecast - by Building Type
- 6.4.1. Residential
- 6.4.2. Commercial
- 6.1. Market Analysis, Insights and Forecast - by Network Type
- 7. South America US Occupancy Sensors Market Analysis, Insights and Forecast, 2019-2031
- 7.1. Market Analysis, Insights and Forecast - by Network Type
- 7.1.1. Wired
- 7.1.2. Wireless
- 7.2. Market Analysis, Insights and Forecast - by Technology
- 7.2.1. Ultrasonic
- 7.2.2. Passive Infrared
- 7.2.3. Microwave
- 7.3. Market Analysis, Insights and Forecast - by Application
- 7.3.1. Lighting Control
- 7.3.2. HVAC
- 7.3.3. Security and Surveillance
- 7.4. Market Analysis, Insights and Forecast - by Building Type
- 7.4.1. Residential
- 7.4.2. Commercial
- 7.1. Market Analysis, Insights and Forecast - by Network Type
- 8. Europe US Occupancy Sensors Market Analysis, Insights and Forecast, 2019-2031
- 8.1. Market Analysis, Insights and Forecast - by Network Type
- 8.1.1. Wired
- 8.1.2. Wireless
- 8.2. Market Analysis, Insights and Forecast - by Technology
- 8.2.1. Ultrasonic
- 8.2.2. Passive Infrared
- 8.2.3. Microwave
- 8.3. Market Analysis, Insights and Forecast - by Application
- 8.3.1. Lighting Control
- 8.3.2. HVAC
- 8.3.3. Security and Surveillance
- 8.4. Market Analysis, Insights and Forecast - by Building Type
- 8.4.1. Residential
- 8.4.2. Commercial
- 8.1. Market Analysis, Insights and Forecast - by Network Type
- 9. Middle East & Africa US Occupancy Sensors Market Analysis, Insights and Forecast, 2019-2031
- 9.1. Market Analysis, Insights and Forecast - by Network Type
- 9.1.1. Wired
- 9.1.2. Wireless
- 9.2. Market Analysis, Insights and Forecast - by Technology
- 9.2.1. Ultrasonic
- 9.2.2. Passive Infrared
- 9.2.3. Microwave
- 9.3. Market Analysis, Insights and Forecast - by Application
- 9.3.1. Lighting Control
- 9.3.2. HVAC
- 9.3.3. Security and Surveillance
- 9.4. Market Analysis, Insights and Forecast - by Building Type
- 9.4.1. Residential
- 9.4.2. Commercial
- 9.1. Market Analysis, Insights and Forecast - by Network Type
- 10. Asia Pacific US Occupancy Sensors Market Analysis, Insights and Forecast, 2019-2031
- 10.1. Market Analysis, Insights and Forecast - by Network Type
- 10.1.1. Wired
- 10.1.2. Wireless
- 10.2. Market Analysis, Insights and Forecast - by Technology
- 10.2.1. Ultrasonic
- 10.2.2. Passive Infrared
- 10.2.3. Microwave
- 10.3. Market Analysis, Insights and Forecast - by Application
- 10.3.1. Lighting Control
- 10.3.2. HVAC
- 10.3.3. Security and Surveillance
- 10.4. Market Analysis, Insights and Forecast - by Building Type
- 10.4.1. Residential
- 10.4.2. Commercial
- 10.1. Market Analysis, Insights and Forecast - by Network Type
- 11. Northeast US Occupancy Sensors Market Analysis, Insights and Forecast, 2019-2031
- 12. Southeast US Occupancy Sensors Market Analysis, Insights and Forecast, 2019-2031
- 13. Midwest US Occupancy Sensors Market Analysis, Insights and Forecast, 2019-2031
- 14. Southwest US Occupancy Sensors Market Analysis, Insights and Forecast, 2019-2031
- 15. West US Occupancy Sensors Market Analysis, Insights and Forecast, 2019-2031
- 16. Competitive Analysis
- 16.1. Global Market Share Analysis 2024
- 16.2. Company Profiles
- 16.2.1 Signify Holding BV
- 16.2.1.1. Overview
- 16.2.1.2. Products
- 16.2.1.3. SWOT Analysis
- 16.2.1.4. Recent Developments
- 16.2.1.5. Financials (Based on Availability)
- 16.2.2 Honeywell Inc
- 16.2.2.1. Overview
- 16.2.2.2. Products
- 16.2.2.3. SWOT Analysis
- 16.2.2.4. Recent Developments
- 16.2.2.5. Financials (Based on Availability)
- 16.2.3 Eaton Corp PLC
- 16.2.3.1. Overview
- 16.2.3.2. Products
- 16.2.3.3. SWOT Analysis
- 16.2.3.4. Recent Developments
- 16.2.3.5. Financials (Based on Availability)
- 16.2.4 Legrand SA
- 16.2.4.1. Overview
- 16.2.4.2. Products
- 16.2.4.3. SWOT Analysis
- 16.2.4.4. Recent Developments
- 16.2.4.5. Financials (Based on Availability)
- 16.2.5 General Electric Co
- 16.2.5.1. Overview
- 16.2.5.2. Products
- 16.2.5.3. SWOT Analysis
- 16.2.5.4. Recent Developments
- 16.2.5.5. Financials (Based on Availability)
- 16.2.6 Dwyer Instruments Inc
- 16.2.6.1. Overview
- 16.2.6.2. Products
- 16.2.6.3. SWOT Analysis
- 16.2.6.4. Recent Developments
- 16.2.6.5. Financials (Based on Availability)
- 16.2.7 Schneider Electric SE
- 16.2.7.1. Overview
- 16.2.7.2. Products
- 16.2.7.3. SWOT Analysis
- 16.2.7.4. Recent Developments
- 16.2.7.5. Financials (Based on Availability)
- 16.2.8 Johnson Controls Inc
- 16.2.8.1. Overview
- 16.2.8.2. Products
- 16.2.8.3. SWOT Analysis
- 16.2.8.4. Recent Developments
- 16.2.8.5. Financials (Based on Availability)
- 16.2.9 Analog Devices Inc
- 16.2.9.1. Overview
- 16.2.9.2. Products
- 16.2.9.3. SWOT Analysis
- 16.2.9.4. Recent Developments
- 16.2.9.5. Financials (Based on Availability)
- 16.2.10 Texas Instruments Inc*List Not Exhaustive
- 16.2.10.1. Overview
- 16.2.10.2. Products
- 16.2.10.3. SWOT Analysis
- 16.2.10.4. Recent Developments
- 16.2.10.5. Financials (Based on Availability)
- 16.2.1 Signify Holding BV
List of Figures
- Figure 1: Global US Occupancy Sensors Market Revenue Breakdown (Million, %) by Region 2024 & 2032
- Figure 2: United states US Occupancy Sensors Market Revenue (Million), by Country 2024 & 2032
- Figure 3: United states US Occupancy Sensors Market Revenue Share (%), by Country 2024 & 2032
- Figure 4: North America US Occupancy Sensors Market Revenue (Million), by Network Type 2024 & 2032
- Figure 5: North America US Occupancy Sensors Market Revenue Share (%), by Network Type 2024 & 2032
- Figure 6: North America US Occupancy Sensors Market Revenue (Million), by Technology 2024 & 2032
- Figure 7: North America US Occupancy Sensors Market Revenue Share (%), by Technology 2024 & 2032
- Figure 8: North America US Occupancy Sensors Market Revenue (Million), by Application 2024 & 2032
- Figure 9: North America US Occupancy Sensors Market Revenue Share (%), by Application 2024 & 2032
- Figure 10: North America US Occupancy Sensors Market Revenue (Million), by Building Type 2024 & 2032
- Figure 11: North America US Occupancy Sensors Market Revenue Share (%), by Building Type 2024 & 2032
- Figure 12: North America US Occupancy Sensors Market Revenue (Million), by Country 2024 & 2032
- Figure 13: North America US Occupancy Sensors Market Revenue Share (%), by Country 2024 & 2032
- Figure 14: South America US Occupancy Sensors Market Revenue (Million), by Network Type 2024 & 2032
- Figure 15: South America US Occupancy Sensors Market Revenue Share (%), by Network Type 2024 & 2032
- Figure 16: South America US Occupancy Sensors Market Revenue (Million), by Technology 2024 & 2032
- Figure 17: South America US Occupancy Sensors Market Revenue Share (%), by Technology 2024 & 2032
- Figure 18: South America US Occupancy Sensors Market Revenue (Million), by Application 2024 & 2032
- Figure 19: South America US Occupancy Sensors Market Revenue Share (%), by Application 2024 & 2032
- Figure 20: South America US Occupancy Sensors Market Revenue (Million), by Building Type 2024 & 2032
- Figure 21: South America US Occupancy Sensors Market Revenue Share (%), by Building Type 2024 & 2032
- Figure 22: South America US Occupancy Sensors Market Revenue (Million), by Country 2024 & 2032
- Figure 23: South America US Occupancy Sensors Market Revenue Share (%), by Country 2024 & 2032
- Figure 24: Europe US Occupancy Sensors Market Revenue (Million), by Network Type 2024 & 2032
- Figure 25: Europe US Occupancy Sensors Market Revenue Share (%), by Network Type 2024 & 2032
- Figure 26: Europe US Occupancy Sensors Market Revenue (Million), by Technology 2024 & 2032
- Figure 27: Europe US Occupancy Sensors Market Revenue Share (%), by Technology 2024 & 2032
- Figure 28: Europe US Occupancy Sensors Market Revenue (Million), by Application 2024 & 2032
- Figure 29: Europe US Occupancy Sensors Market Revenue Share (%), by Application 2024 & 2032
- Figure 30: Europe US Occupancy Sensors Market Revenue (Million), by Building Type 2024 & 2032
- Figure 31: Europe US Occupancy Sensors Market Revenue Share (%), by Building Type 2024 & 2032
- Figure 32: Europe US Occupancy Sensors Market Revenue (Million), by Country 2024 & 2032
- Figure 33: Europe US Occupancy Sensors Market Revenue Share (%), by Country 2024 & 2032
- Figure 34: Middle East & Africa US Occupancy Sensors Market Revenue (Million), by Network Type 2024 & 2032
- Figure 35: Middle East & Africa US Occupancy Sensors Market Revenue Share (%), by Network Type 2024 & 2032
- Figure 36: Middle East & Africa US Occupancy Sensors Market Revenue (Million), by Technology 2024 & 2032
- Figure 37: Middle East & Africa US Occupancy Sensors Market Revenue Share (%), by Technology 2024 & 2032
- Figure 38: Middle East & Africa US Occupancy Sensors Market Revenue (Million), by Application 2024 & 2032
- Figure 39: Middle East & Africa US Occupancy Sensors Market Revenue Share (%), by Application 2024 & 2032
- Figure 40: Middle East & Africa US Occupancy Sensors Market Revenue (Million), by Building Type 2024 & 2032
- Figure 41: Middle East & Africa US Occupancy Sensors Market Revenue Share (%), by Building Type 2024 & 2032
- Figure 42: Middle East & Africa US Occupancy Sensors Market Revenue (Million), by Country 2024 & 2032
- Figure 43: Middle East & Africa US Occupancy Sensors Market Revenue Share (%), by Country 2024 & 2032
- Figure 44: Asia Pacific US Occupancy Sensors Market Revenue (Million), by Network Type 2024 & 2032
- Figure 45: Asia Pacific US Occupancy Sensors Market Revenue Share (%), by Network Type 2024 & 2032
- Figure 46: Asia Pacific US Occupancy Sensors Market Revenue (Million), by Technology 2024 & 2032
- Figure 47: Asia Pacific US Occupancy Sensors Market Revenue Share (%), by Technology 2024 & 2032
- Figure 48: Asia Pacific US Occupancy Sensors Market Revenue (Million), by Application 2024 & 2032
- Figure 49: Asia Pacific US Occupancy Sensors Market Revenue Share (%), by Application 2024 & 2032
- Figure 50: Asia Pacific US Occupancy Sensors Market Revenue (Million), by Building Type 2024 & 2032
- Figure 51: Asia Pacific US Occupancy Sensors Market Revenue Share (%), by Building Type 2024 & 2032
- Figure 52: Asia Pacific US Occupancy Sensors Market Revenue (Million), by Country 2024 & 2032
- Figure 53: Asia Pacific US Occupancy Sensors Market Revenue Share (%), by Country 2024 & 2032
List of Tables
- Table 1: Global US Occupancy Sensors Market Revenue Million Forecast, by Region 2019 & 2032
- Table 2: Global US Occupancy Sensors Market Revenue Million Forecast, by Network Type 2019 & 2032
- Table 3: Global US Occupancy Sensors Market Revenue Million Forecast, by Technology 2019 & 2032
- Table 4: Global US Occupancy Sensors Market Revenue Million Forecast, by Application 2019 & 2032
- Table 5: Global US Occupancy Sensors Market Revenue Million Forecast, by Building Type 2019 & 2032
- Table 6: Global US Occupancy Sensors Market Revenue Million Forecast, by Region 2019 & 2032
- Table 7: Global US Occupancy Sensors Market Revenue Million Forecast, by Country 2019 & 2032
- Table 8: Northeast US Occupancy Sensors Market Revenue (Million) Forecast, by Application 2019 & 2032
- Table 9: Southeast US Occupancy Sensors Market Revenue (Million) Forecast, by Application 2019 & 2032
- Table 10: Midwest US Occupancy Sensors Market Revenue (Million) Forecast, by Application 2019 & 2032
- Table 11: Southwest US Occupancy Sensors Market Revenue (Million) Forecast, by Application 2019 & 2032
- Table 12: West US Occupancy Sensors Market Revenue (Million) Forecast, by Application 2019 & 2032
- Table 13: Global US Occupancy Sensors Market Revenue Million Forecast, by Network Type 2019 & 2032
- Table 14: Global US Occupancy Sensors Market Revenue Million Forecast, by Technology 2019 & 2032
- Table 15: Global US Occupancy Sensors Market Revenue Million Forecast, by Application 2019 & 2032
- Table 16: Global US Occupancy Sensors Market Revenue Million Forecast, by Building Type 2019 & 2032
- Table 17: Global US Occupancy Sensors Market Revenue Million Forecast, by Country 2019 & 2032
- Table 18: United States US Occupancy Sensors Market Revenue (Million) Forecast, by Application 2019 & 2032
- Table 19: Canada US Occupancy Sensors Market Revenue (Million) Forecast, by Application 2019 & 2032
- Table 20: Mexico US Occupancy Sensors Market Revenue (Million) Forecast, by Application 2019 & 2032
- Table 21: Global US Occupancy Sensors Market Revenue Million Forecast, by Network Type 2019 & 2032
- Table 22: Global US Occupancy Sensors Market Revenue Million Forecast, by Technology 2019 & 2032
- Table 23: Global US Occupancy Sensors Market Revenue Million Forecast, by Application 2019 & 2032
- Table 24: Global US Occupancy Sensors Market Revenue Million Forecast, by Building Type 2019 & 2032
- Table 25: Global US Occupancy Sensors Market Revenue Million Forecast, by Country 2019 & 2032
- Table 26: Brazil US Occupancy Sensors Market Revenue (Million) Forecast, by Application 2019 & 2032
- Table 27: Argentina US Occupancy Sensors Market Revenue (Million) Forecast, by Application 2019 & 2032
- Table 28: Rest of South America US Occupancy Sensors Market Revenue (Million) Forecast, by Application 2019 & 2032
- Table 29: Global US Occupancy Sensors Market Revenue Million Forecast, by Network Type 2019 & 2032
- Table 30: Global US Occupancy Sensors Market Revenue Million Forecast, by Technology 2019 & 2032
- Table 31: Global US Occupancy Sensors Market Revenue Million Forecast, by Application 2019 & 2032
- Table 32: Global US Occupancy Sensors Market Revenue Million Forecast, by Building Type 2019 & 2032
- Table 33: Global US Occupancy Sensors Market Revenue Million Forecast, by Country 2019 & 2032
- Table 34: United Kingdom US Occupancy Sensors Market Revenue (Million) Forecast, by Application 2019 & 2032
- Table 35: Germany US Occupancy Sensors Market Revenue (Million) Forecast, by Application 2019 & 2032
- Table 36: France US Occupancy Sensors Market Revenue (Million) Forecast, by Application 2019 & 2032
- Table 37: Italy US Occupancy Sensors Market Revenue (Million) Forecast, by Application 2019 & 2032
- Table 38: Spain US Occupancy Sensors Market Revenue (Million) Forecast, by Application 2019 & 2032
- Table 39: Russia US Occupancy Sensors Market Revenue (Million) Forecast, by Application 2019 & 2032
- Table 40: Benelux US Occupancy Sensors Market Revenue (Million) Forecast, by Application 2019 & 2032
- Table 41: Nordics US Occupancy Sensors Market Revenue (Million) Forecast, by Application 2019 & 2032
- Table 42: Rest of Europe US Occupancy Sensors Market Revenue (Million) Forecast, by Application 2019 & 2032
- Table 43: Global US Occupancy Sensors Market Revenue Million Forecast, by Network Type 2019 & 2032
- Table 44: Global US Occupancy Sensors Market Revenue Million Forecast, by Technology 2019 & 2032
- Table 45: Global US Occupancy Sensors Market Revenue Million Forecast, by Application 2019 & 2032
- Table 46: Global US Occupancy Sensors Market Revenue Million Forecast, by Building Type 2019 & 2032
- Table 47: Global US Occupancy Sensors Market Revenue Million Forecast, by Country 2019 & 2032
- Table 48: Turkey US Occupancy Sensors Market Revenue (Million) Forecast, by Application 2019 & 2032
- Table 49: Israel US Occupancy Sensors Market Revenue (Million) Forecast, by Application 2019 & 2032
- Table 50: GCC US Occupancy Sensors Market Revenue (Million) Forecast, by Application 2019 & 2032
- Table 51: North Africa US Occupancy Sensors Market Revenue (Million) Forecast, by Application 2019 & 2032
- Table 52: South Africa US Occupancy Sensors Market Revenue (Million) Forecast, by Application 2019 & 2032
- Table 53: Rest of Middle East & Africa US Occupancy Sensors Market Revenue (Million) Forecast, by Application 2019 & 2032
- Table 54: Global US Occupancy Sensors Market Revenue Million Forecast, by Network Type 2019 & 2032
- Table 55: Global US Occupancy Sensors Market Revenue Million Forecast, by Technology 2019 & 2032
- Table 56: Global US Occupancy Sensors Market Revenue Million Forecast, by Application 2019 & 2032
- Table 57: Global US Occupancy Sensors Market Revenue Million Forecast, by Building Type 2019 & 2032
- Table 58: Global US Occupancy Sensors Market Revenue Million Forecast, by Country 2019 & 2032
- Table 59: China US Occupancy Sensors Market Revenue (Million) Forecast, by Application 2019 & 2032
- Table 60: India US Occupancy Sensors Market Revenue (Million) Forecast, by Application 2019 & 2032
- Table 61: Japan US Occupancy Sensors Market Revenue (Million) Forecast, by Application 2019 & 2032
- Table 62: South Korea US Occupancy Sensors Market Revenue (Million) Forecast, by Application 2019 & 2032
- Table 63: ASEAN US Occupancy Sensors Market Revenue (Million) Forecast, by Application 2019 & 2032
- Table 64: Oceania US Occupancy Sensors Market Revenue (Million) Forecast, by Application 2019 & 2032
- Table 65: Rest of Asia Pacific US Occupancy Sensors Market Revenue (Million) Forecast, by Application 2019 & 2032
Frequently Asked Questions
1. What is the projected Compound Annual Growth Rate (CAGR) of the US Occupancy Sensors Market?
The projected CAGR is approximately 14.50%.
2. Which companies are prominent players in the US Occupancy Sensors Market?
Key companies in the market include Signify Holding BV, Honeywell Inc, Eaton Corp PLC, Legrand SA, General Electric Co, Dwyer Instruments Inc, Schneider Electric SE, Johnson Controls Inc, Analog Devices Inc, Texas Instruments Inc*List Not Exhaustive.
3. What are the main segments of the US Occupancy Sensors Market?
The market segments include Network Type, Technology, Application, Building Type.
4. Can you provide details about the market size?
The market size is estimated to be USD XX Million as of 2022.
5. What are some drivers contributing to market growth?
Rising Demand for Energy Efficient Devices; Demand for Passive Infrared Due to Low Cost and High Energy Efficiency.
6. What are the notable trends driving market growth?
Residential Expected to Witness Significant Growth.
7. Are there any restraints impacting market growth?
Cryptojacking Threats.
8. Can you provide examples of recent developments in the market?
March 2020 - Signify introduced new Philips IoT sensor packages that gather and deliver data via the Interact Office connected lighting system and environmental monitoring APIs. The sensor bundles can observe occupancy, the total of people in the room, temperature (at the room and desk level), noise levels, daylight levels, relative humidity, and are Bluetooth enabled, allowing for indoor positioning and navigation.
9. What pricing options are available for accessing the report?
Pricing options include single-user, multi-user, and enterprise licenses priced at USD 3800, USD 4500, and USD 5800 respectively.
10. Is the market size provided in terms of value or volume?
The market size is provided in terms of value, measured in Million.
11. Are there any specific market keywords associated with the report?
Yes, the market keyword associated with the report is "US Occupancy Sensors Market," which aids in identifying and referencing the specific market segment covered.
12. How do I determine which pricing option suits my needs best?
The pricing options vary based on user requirements and access needs. Individual users may opt for single-user licenses, while businesses requiring broader access may choose multi-user or enterprise licenses for cost-effective access to the report.
13. Are there any additional resources or data provided in the US Occupancy Sensors Market report?
While the report offers comprehensive insights, it's advisable to review the specific contents or supplementary materials provided to ascertain if additional resources or data are available.
14. How can I stay updated on further developments or reports in the US Occupancy Sensors Market?
To stay informed about further developments, trends, and reports in the US Occupancy Sensors Market, consider subscribing to industry newsletters, following relevant companies and organizations, or regularly checking reputable industry news sources and publications.
Methodology
Step 1 - Identification of Relevant Samples Size from Population Database


Step 2 - Approaches for Defining Global Market Size (Value, Volume* & Price*)

Note*: In applicable scenarios
Step 3 - Data Sources
Primary Research
- Web Analytics
- Survey Reports
- Research Institute
- Latest Research Reports
- Opinion Leaders
Secondary Research
- Annual Reports
- White Paper
- Latest Press Release
- Industry Association
- Paid Database
- Investor Presentations

Step 4 - Data Triangulation
Involves using different sources of information in order to increase the validity of a study
These sources are likely to be stakeholders in a program - participants, other researchers, program staff, other community members, and so on.
Then we put all data in single framework & apply various statistical tools to find out the dynamic on the market.
During the analysis stage, feedback from the stakeholder groups would be compared to determine areas of agreement as well as areas of divergence


