
Key Insights
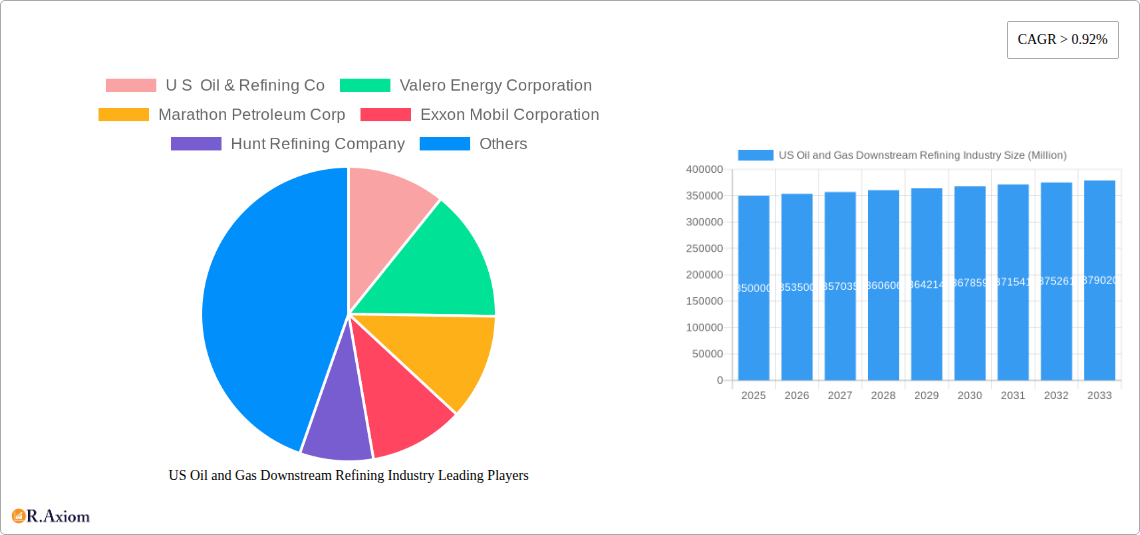
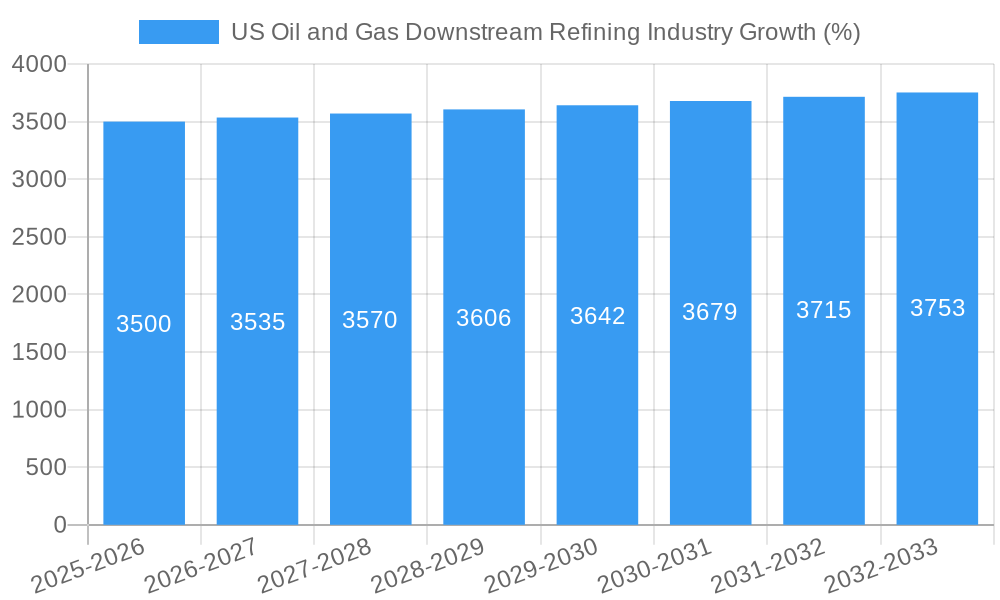
The US oil and gas downstream refining industry, valued at approximately $350 billion in 2025, is projected to experience robust growth, fueled by a compound annual growth rate (CAGR) exceeding 0.92% from 2025 to 2033. This growth is driven primarily by increasing demand for refined petroleum products across various end-user industries, particularly the transportation sector, which remains heavily reliant on gasoline and diesel fuel. The power generation industry also contributes significantly, utilizing fuel oil and other refined products. Furthermore, robust economic activity and a growing population are contributing to this positive outlook. However, the industry faces challenges including increasing environmental regulations aimed at reducing carbon emissions, leading to investments in cleaner technologies and potentially impacting profitability. Fluctuations in crude oil prices and geopolitical instability also represent significant headwinds. Segmentation within the market reveals that gasoline and diesel continue to dominate product-wise, while the transportation sector remains the largest end-user. Key players such as ExxonMobil, Valero, and Marathon Petroleum are strategically navigating these trends through operational efficiency improvements, diversification into renewable fuels, and strategic acquisitions to maintain competitiveness.
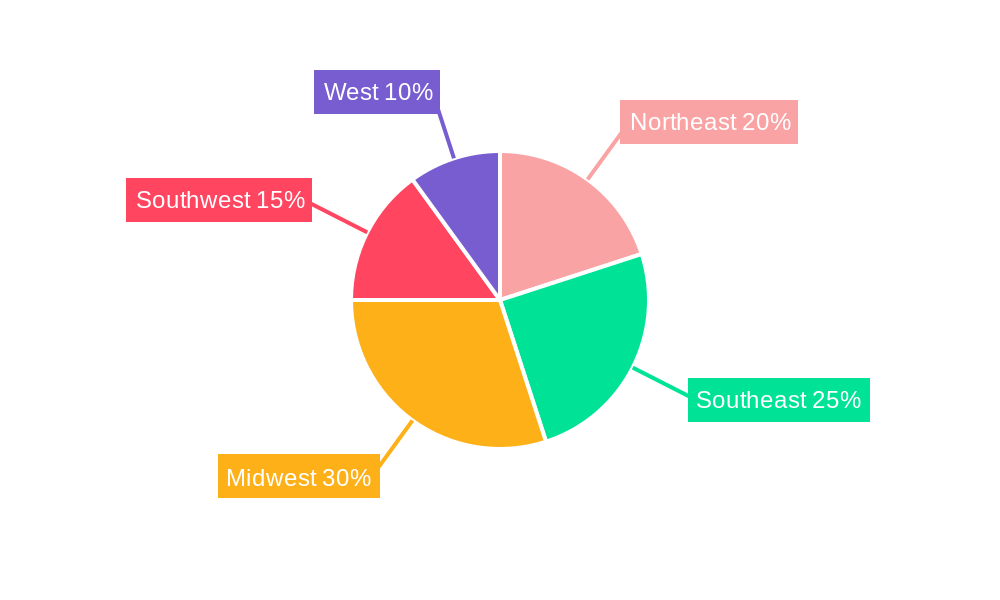
The geographical distribution of refining capacity is concentrated across various regions of the United States. The Northeast, Southeast, Midwest, Southwest, and West regions all contribute to the overall market, with variations in demand and refining capacity impacting their respective market shares. The Midwest, with its established industrial base, and the Southwest, driven by population growth and transportation needs, are expected to witness particularly strong growth. However, regulatory pressures and potential shifts towards electric vehicles could moderate the growth trajectory in the long term. The industry's success will hinge on the ability of companies to adapt to evolving consumer preferences, technological advancements, and environmental concerns. A proactive approach towards sustainability and investment in cleaner technologies will be essential for long-term success and maintaining a strong market position.
US Oil and Gas Downstream Refining Industry: A Comprehensive Market Report (2019-2033)
This in-depth report provides a comprehensive analysis of the US Oil and Gas Downstream Refining Industry, covering market size, growth projections, competitive landscape, and key trends from 2019 to 2033. The report leverages rigorous data analysis and expert insights to offer actionable intelligence for industry stakeholders, including refiners, investors, and policymakers. With a focus on key segments, including gasoline, diesel, jet fuel, and heating oil, this report provides a 360-degree view of this dynamic market.
Study Period: 2019–2033 Base Year: 2025 Estimated Year: 2025 Forecast Period: 2025–2033 Historical Period: 2019–2024
US Oil and Gas Downstream Refining Industry Market Concentration & Innovation
This section analyzes the competitive landscape of the US downstream refining industry, focusing on market concentration, innovation drivers, regulatory frameworks, and recent M&A activity. The industry is characterized by a relatively concentrated market structure, with a few major players controlling a significant share. Market share data for 2024 reveals that the top five players – ExxonMobil, Marathon Petroleum, Valero Energy, Phillips 66, and Chevron – hold approximately xx% of the market. However, smaller independent refiners also play a significant role, particularly in regional markets.
Market Concentration Metrics:
- Top 5 players market share: xx% (2024)
- Herfindahl-Hirschman Index (HHI): xx (2024)
Innovation Drivers:
- Technological advancements in refining processes to enhance efficiency and reduce emissions.
- Development of cleaner fuels to meet increasingly stringent environmental regulations.
- Investment in renewable fuel production, including biofuels and sustainable aviation fuel.
Regulatory Framework:
- The Environmental Protection Agency (EPA) plays a crucial role in setting emissions standards and fuel quality regulations.
- State-level regulations also impact the industry, adding to the complexity of the regulatory landscape.
Product Substitutes:
- Electric vehicles and alternative transportation modes pose a long-term threat to the demand for gasoline and diesel.
- Renewable energy sources are increasingly competing with oil and gas in the power generation sector.
M&A Activity:
- The industry has witnessed several significant mergers and acquisitions in recent years, driven by consolidation and expansion strategies. Total M&A deal value in the past five years exceeded $xx Million. Examples include Chevron’s acquisition of Beyond6 LLC in 2022, highlighting a move towards alternative fuels.
US Oil and Gas Downstream Refining Industry Industry Trends & Insights
The US oil and gas downstream refining industry is characterized by significant dynamism, shaped by evolving consumer preferences, technological advancements, and economic fluctuations. Market growth is influenced by factors such as fluctuations in crude oil prices, economic growth, and government regulations. The increasing demand for transportation fuels continues to be a significant market driver, though growth is expected to moderate in the coming years due to increasing adoption of electric vehicles and fuel efficiency standards. Technological disruptions like automation, digitalization, and advanced analytics are impacting refinery operations, leading to improved efficiency and safety. However, geopolitical instability and supply chain disruptions pose considerable challenges to the industry.
- CAGR (2025-2033): xx%
- Market Penetration of Renewable Fuels (2024): xx%
Dominant Markets & Segments in US Oil and Gas Downstream Refining Industry
The transportation sector remains the dominant end-user industry for refined products, primarily gasoline and diesel. The Gulf Coast region is the leading refining hub in the US, owing to its proximity to crude oil supplies and established infrastructure.
Dominant Product Segments:
- Gasoline: Continues to be the largest segment, driven by the high number of gasoline-powered vehicles.
- Diesel: Strong demand from the trucking industry and other heavy-duty transportation sectors.
- Jet Fuel: Significant growth is anticipated due to increasing air travel, though tempered by the emergence of sustainable aviation fuels.
Dominant End-User Industries:
- Transportation: The largest segment by far, with gasoline and diesel fuels dominating.
- Power Generation: While a smaller segment, growing demand for on-site power generation and industrial uses supports some segment growth.
Key Drivers of Segment Dominance:
- Economic Policies: Government incentives for fuel efficiency and renewable energy sources affect the relative demand for different refined products.
- Infrastructure: The existing infrastructure for transportation fuel distribution contributes to the dominance of the transportation sector.
US Oil and Gas Downstream Refining Industry Product Developments
Recent product developments focus on cleaner fuels, improving fuel efficiency, and expanding the use of biofuels and renewable fuels. Refineries are investing in technologies to reduce emissions and produce higher-quality fuels that meet increasingly stringent environmental regulations. The integration of renewable feedstocks into refining processes is gaining traction, driven by both environmental concerns and economic incentives. Companies are also focusing on developing advanced additives to enhance fuel performance and reduce emissions.
Report Scope & Segmentation Analysis
This report segments the US oil and gas downstream refining industry by product (gasoline, diesel, jet fuel, heating oil, other refined products) and end-user industry (transportation, power generation, manufacturing, residential/commercial). Each segment is analyzed in detail, providing insights into market size, growth projections, and competitive dynamics. Growth projections vary significantly by segment, with gasoline and diesel facing slower growth due to competition from EVs. Conversely, the jet fuel and other refined products segments offer diverse growth opportunities.
Key Drivers of US Oil and Gas Downstream Refining Industry Growth
Key growth drivers include increasing global energy demand, particularly in developing economies, and ongoing investments in refinery modernization and expansion. Furthermore, technological advancements enabling higher efficiency and cleaner fuel production contribute significantly. Favorable government policies supporting infrastructure development also play a crucial role. The development and adoption of biofuels and sustainable aviation fuel present promising growth opportunities.
Challenges in the US Oil and Gas Downstream Refining Industry Sector
The industry faces challenges including stringent environmental regulations, price volatility of crude oil, and increased competition from alternative fuels and energy sources. Supply chain disruptions and geopolitical instability further exacerbate these challenges. The high capital expenditure required for refinery upgrades and expansions also presents a significant barrier to entry and growth for smaller companies.
Emerging Opportunities in US Oil and Gas Downstream Refining Industry
The industry’s growth prospects are tied to the expansion of renewable fuels like biofuels and sustainable aviation fuels (SAF). Advances in carbon capture, utilization, and storage (CCUS) technologies offer opportunities to reduce emissions and enhance environmental sustainability. Moreover, the growing demand for petrochemicals and specialty products presents new market opportunities for refiners.
Leading Players in the US Oil and Gas Downstream Refining Industry Market
- U S Oil & Refining Co
- Valero Energy Corporation
- Marathon Petroleum Corp
- Exxon Mobil Corporation
- Hunt Refining Company
- Royal Dutch Shell PLC
- Phillips 66
Key Developments in US Oil and Gas Downstream Refining Industry Industry
- Nov 2022: Chevron U.S.A. Inc. acquired full ownership of Beyond6 LLC, expanding its presence in the CNG market. This signifies investment in alternative fuel infrastructure.
- Jan 2022: Airbus SE commenced manufacturing aircraft in the US, utilizing a blend of renewable and conventional jet fuel. This highlights the growing adoption of sustainable aviation fuel.
Strategic Outlook for US Oil and Gas Downstream Refining Industry Market
The future of the US oil and gas downstream refining industry hinges on adaptation and innovation. While the long-term demand for traditional fuels may decline, opportunities abound in renewable fuels, carbon capture technologies, and the production of specialty chemicals. Strategic partnerships and investments in research and development will be critical for companies to navigate the evolving landscape and achieve sustainable growth.
US Oil and Gas Downstream Refining Industry Segmentation
- 1. Refining
- 2. Petrochemical
US Oil and Gas Downstream Refining Industry Segmentation By Geography
-
1. North America
- 1.1. United States
- 1.2. Canada
- 1.3. Mexico
-
2. South America
- 2.1. Brazil
- 2.2. Argentina
- 2.3. Rest of South America
-
3. Europe
- 3.1. United Kingdom
- 3.2. Germany
- 3.3. France
- 3.4. Italy
- 3.5. Spain
- 3.6. Russia
- 3.7. Benelux
- 3.8. Nordics
- 3.9. Rest of Europe
-
4. Middle East & Africa
- 4.1. Turkey
- 4.2. Israel
- 4.3. GCC
- 4.4. North Africa
- 4.5. South Africa
- 4.6. Rest of Middle East & Africa
-
5. Asia Pacific
- 5.1. China
- 5.2. India
- 5.3. Japan
- 5.4. South Korea
- 5.5. ASEAN
- 5.6. Oceania
- 5.7. Rest of Asia Pacific
US Oil and Gas Downstream Refining Industry REPORT HIGHLIGHTS
| Aspects | Details |
|---|---|
| Study Period | 2019-2033 |
| Base Year | 2024 |
| Estimated Year | 2025 |
| Forecast Period | 2025-2033 |
| Historical Period | 2019-2024 |
| Growth Rate | CAGR of > 0.92% from 2019-2033 |
| Segmentation |
|
Table of Contents
- 1. Introduction
- 1.1. Research Scope
- 1.2. Market Segmentation
- 1.3. Research Methodology
- 1.4. Definitions and Assumptions
- 2. Executive Summary
- 2.1. Introduction
- 3. Market Dynamics
- 3.1. Introduction
- 3.2. Market Drivers
- 3.2.1. Increasing Demand from Various End-user Industries
- 3.3. Market Restrains
- 3.3.1. Higher Capital and Operational Cost
- 3.4. Market Trends
- 3.4.1. Refining Sector to Register a Modest Growth
- 4. Market Factor Analysis
- 4.1. Porters Five Forces
- 4.2. Supply/Value Chain
- 4.3. PESTEL analysis
- 4.4. Market Entropy
- 4.5. Patent/Trademark Analysis
- 5. Global US Oil and Gas Downstream Refining Industry Analysis, Insights and Forecast, 2019-2031
- 5.1. Market Analysis, Insights and Forecast - by Refining
- 5.2. Market Analysis, Insights and Forecast - by Petrochemical
- 5.3. Market Analysis, Insights and Forecast - by Region
- 5.3.1. North America
- 5.3.2. South America
- 5.3.3. Europe
- 5.3.4. Middle East & Africa
- 5.3.5. Asia Pacific
- 5.1. Market Analysis, Insights and Forecast - by Refining
- 6. North America US Oil and Gas Downstream Refining Industry Analysis, Insights and Forecast, 2019-2031
- 6.1. Market Analysis, Insights and Forecast - by Refining
- 6.2. Market Analysis, Insights and Forecast - by Petrochemical
- 6.1. Market Analysis, Insights and Forecast - by Refining
- 7. South America US Oil and Gas Downstream Refining Industry Analysis, Insights and Forecast, 2019-2031
- 7.1. Market Analysis, Insights and Forecast - by Refining
- 7.2. Market Analysis, Insights and Forecast - by Petrochemical
- 7.1. Market Analysis, Insights and Forecast - by Refining
- 8. Europe US Oil and Gas Downstream Refining Industry Analysis, Insights and Forecast, 2019-2031
- 8.1. Market Analysis, Insights and Forecast - by Refining
- 8.2. Market Analysis, Insights and Forecast - by Petrochemical
- 8.1. Market Analysis, Insights and Forecast - by Refining
- 9. Middle East & Africa US Oil and Gas Downstream Refining Industry Analysis, Insights and Forecast, 2019-2031
- 9.1. Market Analysis, Insights and Forecast - by Refining
- 9.2. Market Analysis, Insights and Forecast - by Petrochemical
- 9.1. Market Analysis, Insights and Forecast - by Refining
- 10. Asia Pacific US Oil and Gas Downstream Refining Industry Analysis, Insights and Forecast, 2019-2031
- 10.1. Market Analysis, Insights and Forecast - by Refining
- 10.2. Market Analysis, Insights and Forecast - by Petrochemical
- 10.1. Market Analysis, Insights and Forecast - by Refining
- 11. Northeast US Oil and Gas Downstream Refining Industry Analysis, Insights and Forecast, 2019-2031
- 12. Southeast US Oil and Gas Downstream Refining Industry Analysis, Insights and Forecast, 2019-2031
- 13. Midwest US Oil and Gas Downstream Refining Industry Analysis, Insights and Forecast, 2019-2031
- 14. Southwest US Oil and Gas Downstream Refining Industry Analysis, Insights and Forecast, 2019-2031
- 15. West US Oil and Gas Downstream Refining Industry Analysis, Insights and Forecast, 2019-2031
- 16. Competitive Analysis
- 16.1. Global Market Share Analysis 2024
- 16.2. Company Profiles
- 16.2.1 U S Oil & Refining Co
- 16.2.1.1. Overview
- 16.2.1.2. Products
- 16.2.1.3. SWOT Analysis
- 16.2.1.4. Recent Developments
- 16.2.1.5. Financials (Based on Availability)
- 16.2.2 Valero Energy Corporation
- 16.2.2.1. Overview
- 16.2.2.2. Products
- 16.2.2.3. SWOT Analysis
- 16.2.2.4. Recent Developments
- 16.2.2.5. Financials (Based on Availability)
- 16.2.3 Marathon Petroleum Corp
- 16.2.3.1. Overview
- 16.2.3.2. Products
- 16.2.3.3. SWOT Analysis
- 16.2.3.4. Recent Developments
- 16.2.3.5. Financials (Based on Availability)
- 16.2.4 Exxon Mobil Corporation
- 16.2.4.1. Overview
- 16.2.4.2. Products
- 16.2.4.3. SWOT Analysis
- 16.2.4.4. Recent Developments
- 16.2.4.5. Financials (Based on Availability)
- 16.2.5 Hunt Refining Company
- 16.2.5.1. Overview
- 16.2.5.2. Products
- 16.2.5.3. SWOT Analysis
- 16.2.5.4. Recent Developments
- 16.2.5.5. Financials (Based on Availability)
- 16.2.6 Royal Dutch Shell PLC
- 16.2.6.1. Overview
- 16.2.6.2. Products
- 16.2.6.3. SWOT Analysis
- 16.2.6.4. Recent Developments
- 16.2.6.5. Financials (Based on Availability)
- 16.2.7 Phillips
- 16.2.7.1. Overview
- 16.2.7.2. Products
- 16.2.7.3. SWOT Analysis
- 16.2.7.4. Recent Developments
- 16.2.7.5. Financials (Based on Availability)
- 16.2.1 U S Oil & Refining Co
List of Figures
- Figure 1: Global US Oil and Gas Downstream Refining Industry Revenue Breakdown (Million, %) by Region 2024 & 2032
- Figure 2: Global US Oil and Gas Downstream Refining Industry Volume Breakdown (N, %) by Region 2024 & 2032
- Figure 3: United states US Oil and Gas Downstream Refining Industry Revenue (Million), by Country 2024 & 2032
- Figure 4: United states US Oil and Gas Downstream Refining Industry Volume (N), by Country 2024 & 2032
- Figure 5: United states US Oil and Gas Downstream Refining Industry Revenue Share (%), by Country 2024 & 2032
- Figure 6: United states US Oil and Gas Downstream Refining Industry Volume Share (%), by Country 2024 & 2032
- Figure 7: North America US Oil and Gas Downstream Refining Industry Revenue (Million), by Refining 2024 & 2032
- Figure 8: North America US Oil and Gas Downstream Refining Industry Volume (N), by Refining 2024 & 2032
- Figure 9: North America US Oil and Gas Downstream Refining Industry Revenue Share (%), by Refining 2024 & 2032
- Figure 10: North America US Oil and Gas Downstream Refining Industry Volume Share (%), by Refining 2024 & 2032
- Figure 11: North America US Oil and Gas Downstream Refining Industry Revenue (Million), by Petrochemical 2024 & 2032
- Figure 12: North America US Oil and Gas Downstream Refining Industry Volume (N), by Petrochemical 2024 & 2032
- Figure 13: North America US Oil and Gas Downstream Refining Industry Revenue Share (%), by Petrochemical 2024 & 2032
- Figure 14: North America US Oil and Gas Downstream Refining Industry Volume Share (%), by Petrochemical 2024 & 2032
- Figure 15: North America US Oil and Gas Downstream Refining Industry Revenue (Million), by Country 2024 & 2032
- Figure 16: North America US Oil and Gas Downstream Refining Industry Volume (N), by Country 2024 & 2032
- Figure 17: North America US Oil and Gas Downstream Refining Industry Revenue Share (%), by Country 2024 & 2032
- Figure 18: North America US Oil and Gas Downstream Refining Industry Volume Share (%), by Country 2024 & 2032
- Figure 19: South America US Oil and Gas Downstream Refining Industry Revenue (Million), by Refining 2024 & 2032
- Figure 20: South America US Oil and Gas Downstream Refining Industry Volume (N), by Refining 2024 & 2032
- Figure 21: South America US Oil and Gas Downstream Refining Industry Revenue Share (%), by Refining 2024 & 2032
- Figure 22: South America US Oil and Gas Downstream Refining Industry Volume Share (%), by Refining 2024 & 2032
- Figure 23: South America US Oil and Gas Downstream Refining Industry Revenue (Million), by Petrochemical 2024 & 2032
- Figure 24: South America US Oil and Gas Downstream Refining Industry Volume (N), by Petrochemical 2024 & 2032
- Figure 25: South America US Oil and Gas Downstream Refining Industry Revenue Share (%), by Petrochemical 2024 & 2032
- Figure 26: South America US Oil and Gas Downstream Refining Industry Volume Share (%), by Petrochemical 2024 & 2032
- Figure 27: South America US Oil and Gas Downstream Refining Industry Revenue (Million), by Country 2024 & 2032
- Figure 28: South America US Oil and Gas Downstream Refining Industry Volume (N), by Country 2024 & 2032
- Figure 29: South America US Oil and Gas Downstream Refining Industry Revenue Share (%), by Country 2024 & 2032
- Figure 30: South America US Oil and Gas Downstream Refining Industry Volume Share (%), by Country 2024 & 2032
- Figure 31: Europe US Oil and Gas Downstream Refining Industry Revenue (Million), by Refining 2024 & 2032
- Figure 32: Europe US Oil and Gas Downstream Refining Industry Volume (N), by Refining 2024 & 2032
- Figure 33: Europe US Oil and Gas Downstream Refining Industry Revenue Share (%), by Refining 2024 & 2032
- Figure 34: Europe US Oil and Gas Downstream Refining Industry Volume Share (%), by Refining 2024 & 2032
- Figure 35: Europe US Oil and Gas Downstream Refining Industry Revenue (Million), by Petrochemical 2024 & 2032
- Figure 36: Europe US Oil and Gas Downstream Refining Industry Volume (N), by Petrochemical 2024 & 2032
- Figure 37: Europe US Oil and Gas Downstream Refining Industry Revenue Share (%), by Petrochemical 2024 & 2032
- Figure 38: Europe US Oil and Gas Downstream Refining Industry Volume Share (%), by Petrochemical 2024 & 2032
- Figure 39: Europe US Oil and Gas Downstream Refining Industry Revenue (Million), by Country 2024 & 2032
- Figure 40: Europe US Oil and Gas Downstream Refining Industry Volume (N), by Country 2024 & 2032
- Figure 41: Europe US Oil and Gas Downstream Refining Industry Revenue Share (%), by Country 2024 & 2032
- Figure 42: Europe US Oil and Gas Downstream Refining Industry Volume Share (%), by Country 2024 & 2032
- Figure 43: Middle East & Africa US Oil and Gas Downstream Refining Industry Revenue (Million), by Refining 2024 & 2032
- Figure 44: Middle East & Africa US Oil and Gas Downstream Refining Industry Volume (N), by Refining 2024 & 2032
- Figure 45: Middle East & Africa US Oil and Gas Downstream Refining Industry Revenue Share (%), by Refining 2024 & 2032
- Figure 46: Middle East & Africa US Oil and Gas Downstream Refining Industry Volume Share (%), by Refining 2024 & 2032
- Figure 47: Middle East & Africa US Oil and Gas Downstream Refining Industry Revenue (Million), by Petrochemical 2024 & 2032
- Figure 48: Middle East & Africa US Oil and Gas Downstream Refining Industry Volume (N), by Petrochemical 2024 & 2032
- Figure 49: Middle East & Africa US Oil and Gas Downstream Refining Industry Revenue Share (%), by Petrochemical 2024 & 2032
- Figure 50: Middle East & Africa US Oil and Gas Downstream Refining Industry Volume Share (%), by Petrochemical 2024 & 2032
- Figure 51: Middle East & Africa US Oil and Gas Downstream Refining Industry Revenue (Million), by Country 2024 & 2032
- Figure 52: Middle East & Africa US Oil and Gas Downstream Refining Industry Volume (N), by Country 2024 & 2032
- Figure 53: Middle East & Africa US Oil and Gas Downstream Refining Industry Revenue Share (%), by Country 2024 & 2032
- Figure 54: Middle East & Africa US Oil and Gas Downstream Refining Industry Volume Share (%), by Country 2024 & 2032
- Figure 55: Asia Pacific US Oil and Gas Downstream Refining Industry Revenue (Million), by Refining 2024 & 2032
- Figure 56: Asia Pacific US Oil and Gas Downstream Refining Industry Volume (N), by Refining 2024 & 2032
- Figure 57: Asia Pacific US Oil and Gas Downstream Refining Industry Revenue Share (%), by Refining 2024 & 2032
- Figure 58: Asia Pacific US Oil and Gas Downstream Refining Industry Volume Share (%), by Refining 2024 & 2032
- Figure 59: Asia Pacific US Oil and Gas Downstream Refining Industry Revenue (Million), by Petrochemical 2024 & 2032
- Figure 60: Asia Pacific US Oil and Gas Downstream Refining Industry Volume (N), by Petrochemical 2024 & 2032
- Figure 61: Asia Pacific US Oil and Gas Downstream Refining Industry Revenue Share (%), by Petrochemical 2024 & 2032
- Figure 62: Asia Pacific US Oil and Gas Downstream Refining Industry Volume Share (%), by Petrochemical 2024 & 2032
- Figure 63: Asia Pacific US Oil and Gas Downstream Refining Industry Revenue (Million), by Country 2024 & 2032
- Figure 64: Asia Pacific US Oil and Gas Downstream Refining Industry Volume (N), by Country 2024 & 2032
- Figure 65: Asia Pacific US Oil and Gas Downstream Refining Industry Revenue Share (%), by Country 2024 & 2032
- Figure 66: Asia Pacific US Oil and Gas Downstream Refining Industry Volume Share (%), by Country 2024 & 2032
List of Tables
- Table 1: Global US Oil and Gas Downstream Refining Industry Revenue Million Forecast, by Region 2019 & 2032
- Table 2: Global US Oil and Gas Downstream Refining Industry Volume N Forecast, by Region 2019 & 2032
- Table 3: Global US Oil and Gas Downstream Refining Industry Revenue Million Forecast, by Refining 2019 & 2032
- Table 4: Global US Oil and Gas Downstream Refining Industry Volume N Forecast, by Refining 2019 & 2032
- Table 5: Global US Oil and Gas Downstream Refining Industry Revenue Million Forecast, by Petrochemical 2019 & 2032
- Table 6: Global US Oil and Gas Downstream Refining Industry Volume N Forecast, by Petrochemical 2019 & 2032
- Table 7: Global US Oil and Gas Downstream Refining Industry Revenue Million Forecast, by Region 2019 & 2032
- Table 8: Global US Oil and Gas Downstream Refining Industry Volume N Forecast, by Region 2019 & 2032
- Table 9: Global US Oil and Gas Downstream Refining Industry Revenue Million Forecast, by Country 2019 & 2032
- Table 10: Global US Oil and Gas Downstream Refining Industry Volume N Forecast, by Country 2019 & 2032
- Table 11: Northeast US Oil and Gas Downstream Refining Industry Revenue (Million) Forecast, by Application 2019 & 2032
- Table 12: Northeast US Oil and Gas Downstream Refining Industry Volume (N) Forecast, by Application 2019 & 2032
- Table 13: Southeast US Oil and Gas Downstream Refining Industry Revenue (Million) Forecast, by Application 2019 & 2032
- Table 14: Southeast US Oil and Gas Downstream Refining Industry Volume (N) Forecast, by Application 2019 & 2032
- Table 15: Midwest US Oil and Gas Downstream Refining Industry Revenue (Million) Forecast, by Application 2019 & 2032
- Table 16: Midwest US Oil and Gas Downstream Refining Industry Volume (N) Forecast, by Application 2019 & 2032
- Table 17: Southwest US Oil and Gas Downstream Refining Industry Revenue (Million) Forecast, by Application 2019 & 2032
- Table 18: Southwest US Oil and Gas Downstream Refining Industry Volume (N) Forecast, by Application 2019 & 2032
- Table 19: West US Oil and Gas Downstream Refining Industry Revenue (Million) Forecast, by Application 2019 & 2032
- Table 20: West US Oil and Gas Downstream Refining Industry Volume (N) Forecast, by Application 2019 & 2032
- Table 21: Global US Oil and Gas Downstream Refining Industry Revenue Million Forecast, by Refining 2019 & 2032
- Table 22: Global US Oil and Gas Downstream Refining Industry Volume N Forecast, by Refining 2019 & 2032
- Table 23: Global US Oil and Gas Downstream Refining Industry Revenue Million Forecast, by Petrochemical 2019 & 2032
- Table 24: Global US Oil and Gas Downstream Refining Industry Volume N Forecast, by Petrochemical 2019 & 2032
- Table 25: Global US Oil and Gas Downstream Refining Industry Revenue Million Forecast, by Country 2019 & 2032
- Table 26: Global US Oil and Gas Downstream Refining Industry Volume N Forecast, by Country 2019 & 2032
- Table 27: United States US Oil and Gas Downstream Refining Industry Revenue (Million) Forecast, by Application 2019 & 2032
- Table 28: United States US Oil and Gas Downstream Refining Industry Volume (N) Forecast, by Application 2019 & 2032
- Table 29: Canada US Oil and Gas Downstream Refining Industry Revenue (Million) Forecast, by Application 2019 & 2032
- Table 30: Canada US Oil and Gas Downstream Refining Industry Volume (N) Forecast, by Application 2019 & 2032
- Table 31: Mexico US Oil and Gas Downstream Refining Industry Revenue (Million) Forecast, by Application 2019 & 2032
- Table 32: Mexico US Oil and Gas Downstream Refining Industry Volume (N) Forecast, by Application 2019 & 2032
- Table 33: Global US Oil and Gas Downstream Refining Industry Revenue Million Forecast, by Refining 2019 & 2032
- Table 34: Global US Oil and Gas Downstream Refining Industry Volume N Forecast, by Refining 2019 & 2032
- Table 35: Global US Oil and Gas Downstream Refining Industry Revenue Million Forecast, by Petrochemical 2019 & 2032
- Table 36: Global US Oil and Gas Downstream Refining Industry Volume N Forecast, by Petrochemical 2019 & 2032
- Table 37: Global US Oil and Gas Downstream Refining Industry Revenue Million Forecast, by Country 2019 & 2032
- Table 38: Global US Oil and Gas Downstream Refining Industry Volume N Forecast, by Country 2019 & 2032
- Table 39: Brazil US Oil and Gas Downstream Refining Industry Revenue (Million) Forecast, by Application 2019 & 2032
- Table 40: Brazil US Oil and Gas Downstream Refining Industry Volume (N) Forecast, by Application 2019 & 2032
- Table 41: Argentina US Oil and Gas Downstream Refining Industry Revenue (Million) Forecast, by Application 2019 & 2032
- Table 42: Argentina US Oil and Gas Downstream Refining Industry Volume (N) Forecast, by Application 2019 & 2032
- Table 43: Rest of South America US Oil and Gas Downstream Refining Industry Revenue (Million) Forecast, by Application 2019 & 2032
- Table 44: Rest of South America US Oil and Gas Downstream Refining Industry Volume (N) Forecast, by Application 2019 & 2032
- Table 45: Global US Oil and Gas Downstream Refining Industry Revenue Million Forecast, by Refining 2019 & 2032
- Table 46: Global US Oil and Gas Downstream Refining Industry Volume N Forecast, by Refining 2019 & 2032
- Table 47: Global US Oil and Gas Downstream Refining Industry Revenue Million Forecast, by Petrochemical 2019 & 2032
- Table 48: Global US Oil and Gas Downstream Refining Industry Volume N Forecast, by Petrochemical 2019 & 2032
- Table 49: Global US Oil and Gas Downstream Refining Industry Revenue Million Forecast, by Country 2019 & 2032
- Table 50: Global US Oil and Gas Downstream Refining Industry Volume N Forecast, by Country 2019 & 2032
- Table 51: United Kingdom US Oil and Gas Downstream Refining Industry Revenue (Million) Forecast, by Application 2019 & 2032
- Table 52: United Kingdom US Oil and Gas Downstream Refining Industry Volume (N) Forecast, by Application 2019 & 2032
- Table 53: Germany US Oil and Gas Downstream Refining Industry Revenue (Million) Forecast, by Application 2019 & 2032
- Table 54: Germany US Oil and Gas Downstream Refining Industry Volume (N) Forecast, by Application 2019 & 2032
- Table 55: France US Oil and Gas Downstream Refining Industry Revenue (Million) Forecast, by Application 2019 & 2032
- Table 56: France US Oil and Gas Downstream Refining Industry Volume (N) Forecast, by Application 2019 & 2032
- Table 57: Italy US Oil and Gas Downstream Refining Industry Revenue (Million) Forecast, by Application 2019 & 2032
- Table 58: Italy US Oil and Gas Downstream Refining Industry Volume (N) Forecast, by Application 2019 & 2032
- Table 59: Spain US Oil and Gas Downstream Refining Industry Revenue (Million) Forecast, by Application 2019 & 2032
- Table 60: Spain US Oil and Gas Downstream Refining Industry Volume (N) Forecast, by Application 2019 & 2032
- Table 61: Russia US Oil and Gas Downstream Refining Industry Revenue (Million) Forecast, by Application 2019 & 2032
- Table 62: Russia US Oil and Gas Downstream Refining Industry Volume (N) Forecast, by Application 2019 & 2032
- Table 63: Benelux US Oil and Gas Downstream Refining Industry Revenue (Million) Forecast, by Application 2019 & 2032
- Table 64: Benelux US Oil and Gas Downstream Refining Industry Volume (N) Forecast, by Application 2019 & 2032
- Table 65: Nordics US Oil and Gas Downstream Refining Industry Revenue (Million) Forecast, by Application 2019 & 2032
- Table 66: Nordics US Oil and Gas Downstream Refining Industry Volume (N) Forecast, by Application 2019 & 2032
- Table 67: Rest of Europe US Oil and Gas Downstream Refining Industry Revenue (Million) Forecast, by Application 2019 & 2032
- Table 68: Rest of Europe US Oil and Gas Downstream Refining Industry Volume (N) Forecast, by Application 2019 & 2032
- Table 69: Global US Oil and Gas Downstream Refining Industry Revenue Million Forecast, by Refining 2019 & 2032
- Table 70: Global US Oil and Gas Downstream Refining Industry Volume N Forecast, by Refining 2019 & 2032
- Table 71: Global US Oil and Gas Downstream Refining Industry Revenue Million Forecast, by Petrochemical 2019 & 2032
- Table 72: Global US Oil and Gas Downstream Refining Industry Volume N Forecast, by Petrochemical 2019 & 2032
- Table 73: Global US Oil and Gas Downstream Refining Industry Revenue Million Forecast, by Country 2019 & 2032
- Table 74: Global US Oil and Gas Downstream Refining Industry Volume N Forecast, by Country 2019 & 2032
- Table 75: Turkey US Oil and Gas Downstream Refining Industry Revenue (Million) Forecast, by Application 2019 & 2032
- Table 76: Turkey US Oil and Gas Downstream Refining Industry Volume (N) Forecast, by Application 2019 & 2032
- Table 77: Israel US Oil and Gas Downstream Refining Industry Revenue (Million) Forecast, by Application 2019 & 2032
- Table 78: Israel US Oil and Gas Downstream Refining Industry Volume (N) Forecast, by Application 2019 & 2032
- Table 79: GCC US Oil and Gas Downstream Refining Industry Revenue (Million) Forecast, by Application 2019 & 2032
- Table 80: GCC US Oil and Gas Downstream Refining Industry Volume (N) Forecast, by Application 2019 & 2032
- Table 81: North Africa US Oil and Gas Downstream Refining Industry Revenue (Million) Forecast, by Application 2019 & 2032
- Table 82: North Africa US Oil and Gas Downstream Refining Industry Volume (N) Forecast, by Application 2019 & 2032
- Table 83: South Africa US Oil and Gas Downstream Refining Industry Revenue (Million) Forecast, by Application 2019 & 2032
- Table 84: South Africa US Oil and Gas Downstream Refining Industry Volume (N) Forecast, by Application 2019 & 2032
- Table 85: Rest of Middle East & Africa US Oil and Gas Downstream Refining Industry Revenue (Million) Forecast, by Application 2019 & 2032
- Table 86: Rest of Middle East & Africa US Oil and Gas Downstream Refining Industry Volume (N) Forecast, by Application 2019 & 2032
- Table 87: Global US Oil and Gas Downstream Refining Industry Revenue Million Forecast, by Refining 2019 & 2032
- Table 88: Global US Oil and Gas Downstream Refining Industry Volume N Forecast, by Refining 2019 & 2032
- Table 89: Global US Oil and Gas Downstream Refining Industry Revenue Million Forecast, by Petrochemical 2019 & 2032
- Table 90: Global US Oil and Gas Downstream Refining Industry Volume N Forecast, by Petrochemical 2019 & 2032
- Table 91: Global US Oil and Gas Downstream Refining Industry Revenue Million Forecast, by Country 2019 & 2032
- Table 92: Global US Oil and Gas Downstream Refining Industry Volume N Forecast, by Country 2019 & 2032
- Table 93: China US Oil and Gas Downstream Refining Industry Revenue (Million) Forecast, by Application 2019 & 2032
- Table 94: China US Oil and Gas Downstream Refining Industry Volume (N) Forecast, by Application 2019 & 2032
- Table 95: India US Oil and Gas Downstream Refining Industry Revenue (Million) Forecast, by Application 2019 & 2032
- Table 96: India US Oil and Gas Downstream Refining Industry Volume (N) Forecast, by Application 2019 & 2032
- Table 97: Japan US Oil and Gas Downstream Refining Industry Revenue (Million) Forecast, by Application 2019 & 2032
- Table 98: Japan US Oil and Gas Downstream Refining Industry Volume (N) Forecast, by Application 2019 & 2032
- Table 99: South Korea US Oil and Gas Downstream Refining Industry Revenue (Million) Forecast, by Application 2019 & 2032
- Table 100: South Korea US Oil and Gas Downstream Refining Industry Volume (N) Forecast, by Application 2019 & 2032
- Table 101: ASEAN US Oil and Gas Downstream Refining Industry Revenue (Million) Forecast, by Application 2019 & 2032
- Table 102: ASEAN US Oil and Gas Downstream Refining Industry Volume (N) Forecast, by Application 2019 & 2032
- Table 103: Oceania US Oil and Gas Downstream Refining Industry Revenue (Million) Forecast, by Application 2019 & 2032
- Table 104: Oceania US Oil and Gas Downstream Refining Industry Volume (N) Forecast, by Application 2019 & 2032
- Table 105: Rest of Asia Pacific US Oil and Gas Downstream Refining Industry Revenue (Million) Forecast, by Application 2019 & 2032
- Table 106: Rest of Asia Pacific US Oil and Gas Downstream Refining Industry Volume (N) Forecast, by Application 2019 & 2032
Frequently Asked Questions
1. What is the projected Compound Annual Growth Rate (CAGR) of the US Oil and Gas Downstream Refining Industry?
The projected CAGR is approximately > 0.92%.
2. Which companies are prominent players in the US Oil and Gas Downstream Refining Industry?
Key companies in the market include U S Oil & Refining Co, Valero Energy Corporation, Marathon Petroleum Corp, Exxon Mobil Corporation, Hunt Refining Company, Royal Dutch Shell PLC, Phillips.
3. What are the main segments of the US Oil and Gas Downstream Refining Industry?
The market segments include Refining, Petrochemical.
4. Can you provide details about the market size?
The market size is estimated to be USD XX Million as of 2022.
5. What are some drivers contributing to market growth?
Increasing Demand from Various End-user Industries.
6. What are the notable trends driving market growth?
Refining Sector to Register a Modest Growth.
7. Are there any restraints impacting market growth?
Higher Capital and Operational Cost.
8. Can you provide examples of recent developments in the market?
Nov 2022: Chevron U.S.A. Inc., a subsidiary of Chevron Corporation, announced it had signed an agreement to acquire full ownership of Beyond6 LLC (B6) and its network of 55 compressed natural gas (CNG) stations across the United States from Chevron's current B6 co-owners, a subsidiary of Mercuria Energy Trading and B6 CEO Andrew West.
9. What pricing options are available for accessing the report?
Pricing options include single-user, multi-user, and enterprise licenses priced at USD 3800, USD 4500, and USD 5800 respectively.
10. Is the market size provided in terms of value or volume?
The market size is provided in terms of value, measured in Million and volume, measured in N.
11. Are there any specific market keywords associated with the report?
Yes, the market keyword associated with the report is "US Oil and Gas Downstream Refining Industry," which aids in identifying and referencing the specific market segment covered.
12. How do I determine which pricing option suits my needs best?
The pricing options vary based on user requirements and access needs. Individual users may opt for single-user licenses, while businesses requiring broader access may choose multi-user or enterprise licenses for cost-effective access to the report.
13. Are there any additional resources or data provided in the US Oil and Gas Downstream Refining Industry report?
While the report offers comprehensive insights, it's advisable to review the specific contents or supplementary materials provided to ascertain if additional resources or data are available.
14. How can I stay updated on further developments or reports in the US Oil and Gas Downstream Refining Industry?
To stay informed about further developments, trends, and reports in the US Oil and Gas Downstream Refining Industry, consider subscribing to industry newsletters, following relevant companies and organizations, or regularly checking reputable industry news sources and publications.
Methodology
Step 1 - Identification of Relevant Samples Size from Population Database


Step 2 - Approaches for Defining Global Market Size (Value, Volume* & Price*)

Note*: In applicable scenarios
Step 3 - Data Sources
Primary Research
- Web Analytics
- Survey Reports
- Research Institute
- Latest Research Reports
- Opinion Leaders
Secondary Research
- Annual Reports
- White Paper
- Latest Press Release
- Industry Association
- Paid Database
- Investor Presentations

Step 4 - Data Triangulation
Involves using different sources of information in order to increase the validity of a study
These sources are likely to be stakeholders in a program - participants, other researchers, program staff, other community members, and so on.
Then we put all data in single framework & apply various statistical tools to find out the dynamic on the market.
During the analysis stage, feedback from the stakeholder groups would be compared to determine areas of agreement as well as areas of divergence


