
Key Insights
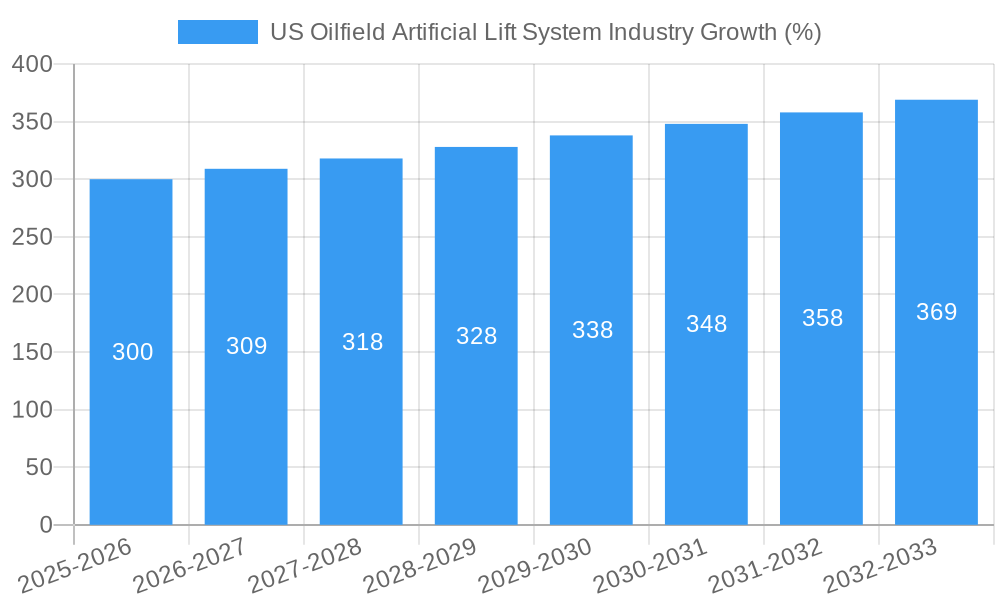
The US oilfield artificial lift system market is experiencing robust growth, driven by increasing oil and gas production activities and the need for enhanced recovery techniques. The market, valued at approximately $10 billion in 2025, is projected to expand at a Compound Annual Growth Rate (CAGR) exceeding 3% through 2033. This growth is fueled by several factors: the ongoing exploration and production in established and unconventional oil and gas reserves, particularly shale formations, coupled with a sustained demand for energy. Technological advancements in artificial lift systems, particularly the development of more efficient and reliable Electric Submersible Pumps (ESPs) and Progressive Cavity Pumps (PCPs), are further contributing to market expansion. The onshore segment currently dominates the market due to the high concentration of oil and gas production activities in land-based regions, though the offshore segment is expected to show moderate growth, driven by investments in deepwater exploration and production. Key players like Halliburton, Schlumberger, Baker Hughes, and Weatherford are strategically investing in research and development to improve efficiency, reduce operational costs, and enhance the longevity of their artificial lift systems. Furthermore, the increasing adoption of smart technologies and data analytics for optimizing artificial lift operations is driving growth.
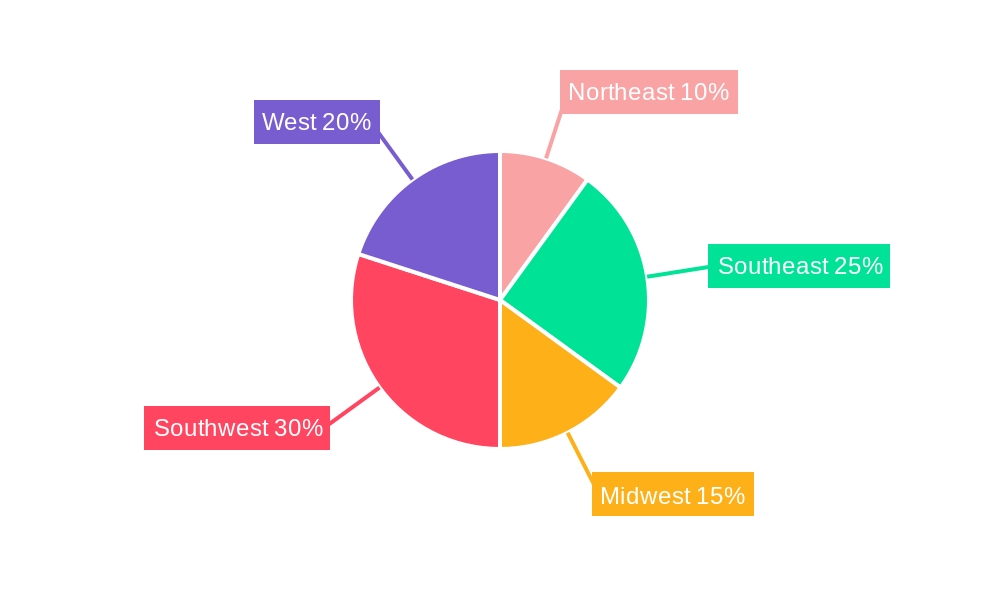
However, the market faces certain restraints. Fluctuations in oil and gas prices can significantly impact investment decisions in the upstream sector, thereby affecting the demand for artificial lift systems. Stringent environmental regulations aimed at minimizing the environmental footprint of oil and gas production can also impose additional costs and complexities. Additionally, the competitive landscape, with several major players vying for market share, necessitates continuous innovation and cost optimization strategies to maintain a strong position. Despite these challenges, the long-term outlook for the US oilfield artificial lift system market remains positive, fueled by the continued reliance on fossil fuels and technological innovations driving efficiency gains. Regional variations exist, with Texas and other key production states driving significant market demand within the US, showing diverse growth across the Northeast, Southeast, Midwest, Southwest, and West regions.
US Oilfield Artificial Lift System Industry: A Comprehensive Market Report (2019-2033)
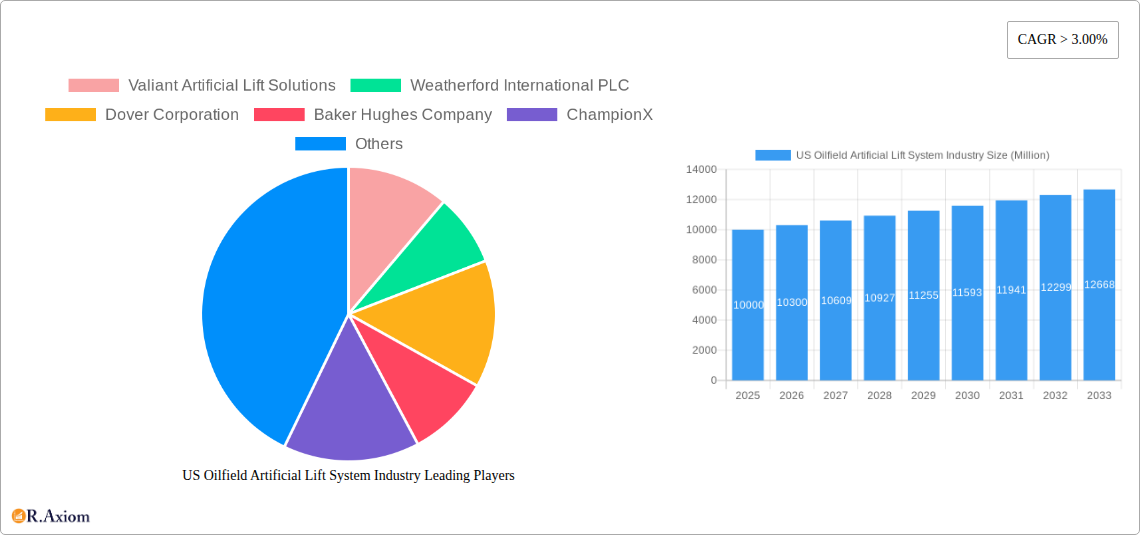
This comprehensive report provides an in-depth analysis of the US Oilfield Artificial Lift System industry, offering valuable insights for stakeholders, investors, and industry professionals. The study covers the period from 2019 to 2033, with a focus on the forecast period of 2025-2033 and a base year of 2025. The report segments the market by type (Progressive Cavity Pumps (PCP), Electric Submersible Pumps (ESP), Gas Lift Systems, Other Types) and area of deployment (Onshore, Offshore), providing a granular understanding of market dynamics and future growth potential. Key players analyzed include Valiant Artificial Lift Solutions, Weatherford International PLC, Dover Corporation, Baker Hughes Company, ChampionX, Halliburton Company, Schlumberger Limited, NOV Inc, JJ Tech, and KBA Engineering. The report projects a market size of xx Million by 2033, with a Compound Annual Growth Rate (CAGR) of xx% during the forecast period.
US Oilfield Artificial Lift System Industry Market Concentration & Innovation
The US oilfield artificial lift system market exhibits a moderately concentrated landscape, with a few major players holding significant market share. The top five companies, including Baker Hughes, Schlumberger, Halliburton, Weatherford, and ChampionX, collectively account for an estimated xx% of the market in 2025. However, smaller, specialized players like Valiant Artificial Lift Solutions and JJ Tech are also gaining traction through innovation and niche market focus.
Market innovation is driven by the need for improved energy efficiency, reduced operational costs, and enhanced production optimization in challenging environments. This includes the development of advanced automation solutions like Baker Hughes' ProductionLink Edge, which leverages smart technology and analytics for enhanced efficiency. Regulatory frameworks, such as environmental regulations targeting methane emissions, further stimulate the adoption of advanced, environmentally friendly technologies. Product substitution is primarily seen in the shift towards more efficient and reliable systems like ESPs, replacing older technologies. Furthermore, M&A activities are contributing to market consolidation, with deals primarily focusing on technological integration and market expansion. The total value of M&A deals in the sector between 2019 and 2024 is estimated at xx Million. This consolidation is expected to continue, influencing the market concentration in the forecast period.
- Market Concentration: Top 5 players hold xx% market share (2025).
- Innovation Drivers: Enhanced energy efficiency, cost reduction, environmental regulations, and technological advancements.
- M&A Activity: Total deal value (2019-2024) estimated at xx Million.
- Regulatory Landscape: Focus on environmental regulations driving innovation in emission reduction technologies.
US Oilfield Artificial Lift System Industry Industry Trends & Insights
The US oilfield artificial lift system market is experiencing significant growth, driven by increasing oil and gas production, particularly from unconventional resources like shale formations. The exploration and production activities, coupled with the rising demand for oil and gas, are the primary drivers for market expansion. Technological disruptions, such as the adoption of digital technologies and automation, are significantly improving operational efficiencies and reducing costs. Consumer preferences are shifting towards advanced systems that offer enhanced reliability, lower maintenance requirements, and optimized energy consumption. The competitive dynamics are shaped by intense competition among major players, driving innovation and price competitiveness. The market penetration of advanced technologies like ESPs and PCPs is increasing steadily, reflecting the industry's move toward sophisticated solutions. This continuous technological advancement is estimated to drive a CAGR of xx% from 2025 to 2033, with market penetration expected to reach xx% by 2033. The market is witnessing a substantial shift toward automation and digitalization to improve operational efficiency and sustainability.
Dominant Markets & Segments in US Oilfield Artificial Lift System Industry
The onshore segment dominates the US oilfield artificial lift system market due to the extensive presence of oil and gas wells in onshore areas. The increasing exploration and production activities in shale formations further propel the growth of the onshore segment. Among the different types of artificial lift systems, Electric Submersible Pumps (ESPs) hold the largest market share, owing to their high efficiency, reliability, and suitability for various well conditions. The Texas and Permian Basin regions are particularly significant contributors, benefitting from favorable economic policies, robust infrastructure, and extensive oil and gas reserves.
Key Drivers for Onshore Dominance: Extensive well presence, shale gas exploration, and favorable regulatory environment.
Key Drivers for ESP Dominance: High efficiency, reliability, and suitability for diverse well conditions.
Regional Dominance: Texas and the Permian Basin are leading regions due to resource availability and supportive infrastructure.
Onshore Segment: Drivers include extensive well presence and shale gas exploration. Market size in 2025: xx Million.
Offshore Segment: Drivers include high production in offshore regions and technological advancements for deepwater applications. Market size in 2025: xx Million.
ESP Segment: Drivers include high efficiency and suitability for various well conditions. Market size in 2025: xx Million.
PCP Segment: Drivers include suitability for high viscosity fluids and adaptability for various applications. Market size in 2025: xx Million.
Gas Lift Systems Segment: Drivers include cost-effectiveness for specific applications. Market size in 2025: xx Million.
Other Types Segment: Drivers include niche applications and specialized solutions. Market size in 2025: xx Million.
US Oilfield Artificial Lift System Industry Product Developments
Recent product innovations focus on enhancing efficiency, reliability, and sustainability. This includes the development of smarter, more automated systems incorporating advanced analytics and predictive maintenance capabilities. These systems offer improved performance, reduced downtime, and lower operational costs, directly addressing the needs of oil and gas operators. The integration of IoT and digital technologies is further enhancing the capabilities of these systems, allowing for real-time monitoring, remote control, and optimized production management. The market fit for these advanced solutions is strong, given the growing demand for efficient and sustainable oil and gas production.
Report Scope & Segmentation Analysis
This report segments the US oilfield artificial lift system market by type (Progressive Cavity Pumps (PCP), Electric Submersible Pumps (ESP), Gas Lift Systems, Other Types) and area of deployment (Onshore, Offshore). Each segment is analyzed in detail, providing market size, growth projections, and competitive dynamics. The report provides a comprehensive overview of the market, including historical data (2019-2024), current estimates (2025), and future forecasts (2025-2033). The analysis considers key factors influencing the growth trajectory of each segment, including technological advancements, regulatory changes, and economic conditions.
Key Drivers of US Oilfield Artificial Lift System Industry Growth
The growth of the US oilfield artificial lift system market is propelled by several factors. Increasing oil and gas production, particularly from unconventional resources like shale, drives the demand for efficient lift systems. Technological advancements, like the development of advanced ESPs and PCPs, are improving efficiency and reducing operational costs. Favorable government policies supporting domestic energy production further enhance market expansion. Finally, the need for environmentally friendly and sustainable production methods is leading to increased adoption of efficient systems that reduce methane emissions.
Challenges in the US Oilfield Artificial Lift System Industry Sector
The industry faces challenges such as fluctuating oil and gas prices, impacting investment decisions. Supply chain disruptions can cause delays and increase costs, particularly for specialized components. Intense competition among established players and new entrants puts pressure on pricing and profitability. Stringent environmental regulations increase the cost of compliance and necessitate the adoption of newer technologies. These factors can constrain market growth and profitability if not effectively managed.
Emerging Opportunities in US Oilfield Artificial Lift System Industry
Emerging opportunities lie in the adoption of digital technologies, including IoT and AI, for improved monitoring, predictive maintenance, and optimized production. The growing focus on sustainability is driving demand for eco-friendly lift systems with reduced emissions. Expanding into new markets and unconventional resources, coupled with developing advanced solutions for harsh environments, presents further opportunities for growth. The development of hybrid systems combining multiple technologies offers further potential.
Leading Players in the US Oilfield Artificial Lift System Industry Market
- Valiant Artificial Lift Solutions
- Weatherford International PLC
- Dover Corporation
- Baker Hughes Company
- ChampionX
- Halliburton Company
- Schlumberger Limited
- NOV Inc
- JJ Tech
- KBA Engineering
Key Developments in US Oilfield Artificial Lift System Industry Industry
- September 2021: Baker Hughes secured a contract with Vine Energy to deploy its ProductionLink Edge solution across 100 natural gas wells in Louisiana's Haynesville Shale, highlighting the growing adoption of advanced automation and analytics solutions for enhanced production and emission reduction.
Strategic Outlook for US Oilfield Artificial Lift System Market
The US oilfield artificial lift system market holds significant future potential, driven by continuous technological innovation, increasing oil and gas production, and the growing emphasis on operational efficiency and environmental sustainability. The adoption of advanced automation, digitalization, and eco-friendly solutions will continue to shape market growth, with opportunities for companies that can effectively leverage these trends. The market is expected to witness strong growth in the coming years, with significant investment and expansion anticipated within the industry.
US Oilfield Artificial Lift System Industry Segmentation
-
1. Type
- 1.1. Progressive Cavity Pumps (PCP)
- 1.2. Electric Submersible Pumps (ESP)
- 1.3. Gas Lift Systems
- 1.4. Other Types
-
2. Area of Deployment
- 2.1. Onshore
- 2.2. Offshore
US Oilfield Artificial Lift System Industry Segmentation By Geography
-
1. North America
- 1.1. United States
- 1.2. Canada
- 1.3. Mexico
-
2. South America
- 2.1. Brazil
- 2.2. Argentina
- 2.3. Rest of South America
-
3. Europe
- 3.1. United Kingdom
- 3.2. Germany
- 3.3. France
- 3.4. Italy
- 3.5. Spain
- 3.6. Russia
- 3.7. Benelux
- 3.8. Nordics
- 3.9. Rest of Europe
-
4. Middle East & Africa
- 4.1. Turkey
- 4.2. Israel
- 4.3. GCC
- 4.4. North Africa
- 4.5. South Africa
- 4.6. Rest of Middle East & Africa
-
5. Asia Pacific
- 5.1. China
- 5.2. India
- 5.3. Japan
- 5.4. South Korea
- 5.5. ASEAN
- 5.6. Oceania
- 5.7. Rest of Asia Pacific
US Oilfield Artificial Lift System Industry REPORT HIGHLIGHTS
| Aspects | Details |
|---|---|
| Study Period | 2019-2033 |
| Base Year | 2024 |
| Estimated Year | 2025 |
| Forecast Period | 2025-2033 |
| Historical Period | 2019-2024 |
| Growth Rate | CAGR of > 3.00% from 2019-2033 |
| Segmentation |
|
Table of Contents
- 1. Introduction
- 1.1. Research Scope
- 1.2. Market Segmentation
- 1.3. Research Methodology
- 1.4. Definitions and Assumptions
- 2. Executive Summary
- 2.1. Introduction
- 3. Market Dynamics
- 3.1. Introduction
- 3.2. Market Drivers
- 3.2.1. 4.; Declining Cost of Solar PV Installations4.; Supportive Government Policies For Renewable Energy
- 3.3. Market Restrains
- 3.3.1. 4.; Penetration of Other Energy Sources
- 3.4. Market Trends
- 3.4.1. Offshore Segment to Witness Significant Growth
- 4. Market Factor Analysis
- 4.1. Porters Five Forces
- 4.2. Supply/Value Chain
- 4.3. PESTEL analysis
- 4.4. Market Entropy
- 4.5. Patent/Trademark Analysis
- 5. Global US Oilfield Artificial Lift System Industry Analysis, Insights and Forecast, 2019-2031
- 5.1. Market Analysis, Insights and Forecast - by Type
- 5.1.1. Progressive Cavity Pumps (PCP)
- 5.1.2. Electric Submersible Pumps (ESP)
- 5.1.3. Gas Lift Systems
- 5.1.4. Other Types
- 5.2. Market Analysis, Insights and Forecast - by Area of Deployment
- 5.2.1. Onshore
- 5.2.2. Offshore
- 5.3. Market Analysis, Insights and Forecast - by Region
- 5.3.1. North America
- 5.3.2. South America
- 5.3.3. Europe
- 5.3.4. Middle East & Africa
- 5.3.5. Asia Pacific
- 5.1. Market Analysis, Insights and Forecast - by Type
- 6. North America US Oilfield Artificial Lift System Industry Analysis, Insights and Forecast, 2019-2031
- 6.1. Market Analysis, Insights and Forecast - by Type
- 6.1.1. Progressive Cavity Pumps (PCP)
- 6.1.2. Electric Submersible Pumps (ESP)
- 6.1.3. Gas Lift Systems
- 6.1.4. Other Types
- 6.2. Market Analysis, Insights and Forecast - by Area of Deployment
- 6.2.1. Onshore
- 6.2.2. Offshore
- 6.1. Market Analysis, Insights and Forecast - by Type
- 7. South America US Oilfield Artificial Lift System Industry Analysis, Insights and Forecast, 2019-2031
- 7.1. Market Analysis, Insights and Forecast - by Type
- 7.1.1. Progressive Cavity Pumps (PCP)
- 7.1.2. Electric Submersible Pumps (ESP)
- 7.1.3. Gas Lift Systems
- 7.1.4. Other Types
- 7.2. Market Analysis, Insights and Forecast - by Area of Deployment
- 7.2.1. Onshore
- 7.2.2. Offshore
- 7.1. Market Analysis, Insights and Forecast - by Type
- 8. Europe US Oilfield Artificial Lift System Industry Analysis, Insights and Forecast, 2019-2031
- 8.1. Market Analysis, Insights and Forecast - by Type
- 8.1.1. Progressive Cavity Pumps (PCP)
- 8.1.2. Electric Submersible Pumps (ESP)
- 8.1.3. Gas Lift Systems
- 8.1.4. Other Types
- 8.2. Market Analysis, Insights and Forecast - by Area of Deployment
- 8.2.1. Onshore
- 8.2.2. Offshore
- 8.1. Market Analysis, Insights and Forecast - by Type
- 9. Middle East & Africa US Oilfield Artificial Lift System Industry Analysis, Insights and Forecast, 2019-2031
- 9.1. Market Analysis, Insights and Forecast - by Type
- 9.1.1. Progressive Cavity Pumps (PCP)
- 9.1.2. Electric Submersible Pumps (ESP)
- 9.1.3. Gas Lift Systems
- 9.1.4. Other Types
- 9.2. Market Analysis, Insights and Forecast - by Area of Deployment
- 9.2.1. Onshore
- 9.2.2. Offshore
- 9.1. Market Analysis, Insights and Forecast - by Type
- 10. Asia Pacific US Oilfield Artificial Lift System Industry Analysis, Insights and Forecast, 2019-2031
- 10.1. Market Analysis, Insights and Forecast - by Type
- 10.1.1. Progressive Cavity Pumps (PCP)
- 10.1.2. Electric Submersible Pumps (ESP)
- 10.1.3. Gas Lift Systems
- 10.1.4. Other Types
- 10.2. Market Analysis, Insights and Forecast - by Area of Deployment
- 10.2.1. Onshore
- 10.2.2. Offshore
- 10.1. Market Analysis, Insights and Forecast - by Type
- 11. Northeast US Oilfield Artificial Lift System Industry Analysis, Insights and Forecast, 2019-2031
- 12. Southeast US Oilfield Artificial Lift System Industry Analysis, Insights and Forecast, 2019-2031
- 13. Midwest US Oilfield Artificial Lift System Industry Analysis, Insights and Forecast, 2019-2031
- 14. Southwest US Oilfield Artificial Lift System Industry Analysis, Insights and Forecast, 2019-2031
- 15. West US Oilfield Artificial Lift System Industry Analysis, Insights and Forecast, 2019-2031
- 16. Competitive Analysis
- 16.1. Global Market Share Analysis 2024
- 16.2. Company Profiles
- 16.2.1 Valiant Artificial Lift Solutions
- 16.2.1.1. Overview
- 16.2.1.2. Products
- 16.2.1.3. SWOT Analysis
- 16.2.1.4. Recent Developments
- 16.2.1.5. Financials (Based on Availability)
- 16.2.2 Weatherford International PLC
- 16.2.2.1. Overview
- 16.2.2.2. Products
- 16.2.2.3. SWOT Analysis
- 16.2.2.4. Recent Developments
- 16.2.2.5. Financials (Based on Availability)
- 16.2.3 Dover Corporation
- 16.2.3.1. Overview
- 16.2.3.2. Products
- 16.2.3.3. SWOT Analysis
- 16.2.3.4. Recent Developments
- 16.2.3.5. Financials (Based on Availability)
- 16.2.4 Baker Hughes Company
- 16.2.4.1. Overview
- 16.2.4.2. Products
- 16.2.4.3. SWOT Analysis
- 16.2.4.4. Recent Developments
- 16.2.4.5. Financials (Based on Availability)
- 16.2.5 ChampionX
- 16.2.5.1. Overview
- 16.2.5.2. Products
- 16.2.5.3. SWOT Analysis
- 16.2.5.4. Recent Developments
- 16.2.5.5. Financials (Based on Availability)
- 16.2.6 Halliburton Company
- 16.2.6.1. Overview
- 16.2.6.2. Products
- 16.2.6.3. SWOT Analysis
- 16.2.6.4. Recent Developments
- 16.2.6.5. Financials (Based on Availability)
- 16.2.7 Schlumberger Limited
- 16.2.7.1. Overview
- 16.2.7.2. Products
- 16.2.7.3. SWOT Analysis
- 16.2.7.4. Recent Developments
- 16.2.7.5. Financials (Based on Availability)
- 16.2.8 NOV Inc
- 16.2.8.1. Overview
- 16.2.8.2. Products
- 16.2.8.3. SWOT Analysis
- 16.2.8.4. Recent Developments
- 16.2.8.5. Financials (Based on Availability)
- 16.2.9 JJ Tech
- 16.2.9.1. Overview
- 16.2.9.2. Products
- 16.2.9.3. SWOT Analysis
- 16.2.9.4. Recent Developments
- 16.2.9.5. Financials (Based on Availability)
- 16.2.10 KBA Engineering
- 16.2.10.1. Overview
- 16.2.10.2. Products
- 16.2.10.3. SWOT Analysis
- 16.2.10.4. Recent Developments
- 16.2.10.5. Financials (Based on Availability)
- 16.2.1 Valiant Artificial Lift Solutions
List of Figures
- Figure 1: Global US Oilfield Artificial Lift System Industry Revenue Breakdown (Million, %) by Region 2024 & 2032
- Figure 2: United states US Oilfield Artificial Lift System Industry Revenue (Million), by Country 2024 & 2032
- Figure 3: United states US Oilfield Artificial Lift System Industry Revenue Share (%), by Country 2024 & 2032
- Figure 4: North America US Oilfield Artificial Lift System Industry Revenue (Million), by Type 2024 & 2032
- Figure 5: North America US Oilfield Artificial Lift System Industry Revenue Share (%), by Type 2024 & 2032
- Figure 6: North America US Oilfield Artificial Lift System Industry Revenue (Million), by Area of Deployment 2024 & 2032
- Figure 7: North America US Oilfield Artificial Lift System Industry Revenue Share (%), by Area of Deployment 2024 & 2032
- Figure 8: North America US Oilfield Artificial Lift System Industry Revenue (Million), by Country 2024 & 2032
- Figure 9: North America US Oilfield Artificial Lift System Industry Revenue Share (%), by Country 2024 & 2032
- Figure 10: South America US Oilfield Artificial Lift System Industry Revenue (Million), by Type 2024 & 2032
- Figure 11: South America US Oilfield Artificial Lift System Industry Revenue Share (%), by Type 2024 & 2032
- Figure 12: South America US Oilfield Artificial Lift System Industry Revenue (Million), by Area of Deployment 2024 & 2032
- Figure 13: South America US Oilfield Artificial Lift System Industry Revenue Share (%), by Area of Deployment 2024 & 2032
- Figure 14: South America US Oilfield Artificial Lift System Industry Revenue (Million), by Country 2024 & 2032
- Figure 15: South America US Oilfield Artificial Lift System Industry Revenue Share (%), by Country 2024 & 2032
- Figure 16: Europe US Oilfield Artificial Lift System Industry Revenue (Million), by Type 2024 & 2032
- Figure 17: Europe US Oilfield Artificial Lift System Industry Revenue Share (%), by Type 2024 & 2032
- Figure 18: Europe US Oilfield Artificial Lift System Industry Revenue (Million), by Area of Deployment 2024 & 2032
- Figure 19: Europe US Oilfield Artificial Lift System Industry Revenue Share (%), by Area of Deployment 2024 & 2032
- Figure 20: Europe US Oilfield Artificial Lift System Industry Revenue (Million), by Country 2024 & 2032
- Figure 21: Europe US Oilfield Artificial Lift System Industry Revenue Share (%), by Country 2024 & 2032
- Figure 22: Middle East & Africa US Oilfield Artificial Lift System Industry Revenue (Million), by Type 2024 & 2032
- Figure 23: Middle East & Africa US Oilfield Artificial Lift System Industry Revenue Share (%), by Type 2024 & 2032
- Figure 24: Middle East & Africa US Oilfield Artificial Lift System Industry Revenue (Million), by Area of Deployment 2024 & 2032
- Figure 25: Middle East & Africa US Oilfield Artificial Lift System Industry Revenue Share (%), by Area of Deployment 2024 & 2032
- Figure 26: Middle East & Africa US Oilfield Artificial Lift System Industry Revenue (Million), by Country 2024 & 2032
- Figure 27: Middle East & Africa US Oilfield Artificial Lift System Industry Revenue Share (%), by Country 2024 & 2032
- Figure 28: Asia Pacific US Oilfield Artificial Lift System Industry Revenue (Million), by Type 2024 & 2032
- Figure 29: Asia Pacific US Oilfield Artificial Lift System Industry Revenue Share (%), by Type 2024 & 2032
- Figure 30: Asia Pacific US Oilfield Artificial Lift System Industry Revenue (Million), by Area of Deployment 2024 & 2032
- Figure 31: Asia Pacific US Oilfield Artificial Lift System Industry Revenue Share (%), by Area of Deployment 2024 & 2032
- Figure 32: Asia Pacific US Oilfield Artificial Lift System Industry Revenue (Million), by Country 2024 & 2032
- Figure 33: Asia Pacific US Oilfield Artificial Lift System Industry Revenue Share (%), by Country 2024 & 2032
List of Tables
- Table 1: Global US Oilfield Artificial Lift System Industry Revenue Million Forecast, by Region 2019 & 2032
- Table 2: Global US Oilfield Artificial Lift System Industry Revenue Million Forecast, by Type 2019 & 2032
- Table 3: Global US Oilfield Artificial Lift System Industry Revenue Million Forecast, by Area of Deployment 2019 & 2032
- Table 4: Global US Oilfield Artificial Lift System Industry Revenue Million Forecast, by Region 2019 & 2032
- Table 5: Global US Oilfield Artificial Lift System Industry Revenue Million Forecast, by Country 2019 & 2032
- Table 6: Northeast US Oilfield Artificial Lift System Industry Revenue (Million) Forecast, by Application 2019 & 2032
- Table 7: Southeast US Oilfield Artificial Lift System Industry Revenue (Million) Forecast, by Application 2019 & 2032
- Table 8: Midwest US Oilfield Artificial Lift System Industry Revenue (Million) Forecast, by Application 2019 & 2032
- Table 9: Southwest US Oilfield Artificial Lift System Industry Revenue (Million) Forecast, by Application 2019 & 2032
- Table 10: West US Oilfield Artificial Lift System Industry Revenue (Million) Forecast, by Application 2019 & 2032
- Table 11: Global US Oilfield Artificial Lift System Industry Revenue Million Forecast, by Type 2019 & 2032
- Table 12: Global US Oilfield Artificial Lift System Industry Revenue Million Forecast, by Area of Deployment 2019 & 2032
- Table 13: Global US Oilfield Artificial Lift System Industry Revenue Million Forecast, by Country 2019 & 2032
- Table 14: United States US Oilfield Artificial Lift System Industry Revenue (Million) Forecast, by Application 2019 & 2032
- Table 15: Canada US Oilfield Artificial Lift System Industry Revenue (Million) Forecast, by Application 2019 & 2032
- Table 16: Mexico US Oilfield Artificial Lift System Industry Revenue (Million) Forecast, by Application 2019 & 2032
- Table 17: Global US Oilfield Artificial Lift System Industry Revenue Million Forecast, by Type 2019 & 2032
- Table 18: Global US Oilfield Artificial Lift System Industry Revenue Million Forecast, by Area of Deployment 2019 & 2032
- Table 19: Global US Oilfield Artificial Lift System Industry Revenue Million Forecast, by Country 2019 & 2032
- Table 20: Brazil US Oilfield Artificial Lift System Industry Revenue (Million) Forecast, by Application 2019 & 2032
- Table 21: Argentina US Oilfield Artificial Lift System Industry Revenue (Million) Forecast, by Application 2019 & 2032
- Table 22: Rest of South America US Oilfield Artificial Lift System Industry Revenue (Million) Forecast, by Application 2019 & 2032
- Table 23: Global US Oilfield Artificial Lift System Industry Revenue Million Forecast, by Type 2019 & 2032
- Table 24: Global US Oilfield Artificial Lift System Industry Revenue Million Forecast, by Area of Deployment 2019 & 2032
- Table 25: Global US Oilfield Artificial Lift System Industry Revenue Million Forecast, by Country 2019 & 2032
- Table 26: United Kingdom US Oilfield Artificial Lift System Industry Revenue (Million) Forecast, by Application 2019 & 2032
- Table 27: Germany US Oilfield Artificial Lift System Industry Revenue (Million) Forecast, by Application 2019 & 2032
- Table 28: France US Oilfield Artificial Lift System Industry Revenue (Million) Forecast, by Application 2019 & 2032
- Table 29: Italy US Oilfield Artificial Lift System Industry Revenue (Million) Forecast, by Application 2019 & 2032
- Table 30: Spain US Oilfield Artificial Lift System Industry Revenue (Million) Forecast, by Application 2019 & 2032
- Table 31: Russia US Oilfield Artificial Lift System Industry Revenue (Million) Forecast, by Application 2019 & 2032
- Table 32: Benelux US Oilfield Artificial Lift System Industry Revenue (Million) Forecast, by Application 2019 & 2032
- Table 33: Nordics US Oilfield Artificial Lift System Industry Revenue (Million) Forecast, by Application 2019 & 2032
- Table 34: Rest of Europe US Oilfield Artificial Lift System Industry Revenue (Million) Forecast, by Application 2019 & 2032
- Table 35: Global US Oilfield Artificial Lift System Industry Revenue Million Forecast, by Type 2019 & 2032
- Table 36: Global US Oilfield Artificial Lift System Industry Revenue Million Forecast, by Area of Deployment 2019 & 2032
- Table 37: Global US Oilfield Artificial Lift System Industry Revenue Million Forecast, by Country 2019 & 2032
- Table 38: Turkey US Oilfield Artificial Lift System Industry Revenue (Million) Forecast, by Application 2019 & 2032
- Table 39: Israel US Oilfield Artificial Lift System Industry Revenue (Million) Forecast, by Application 2019 & 2032
- Table 40: GCC US Oilfield Artificial Lift System Industry Revenue (Million) Forecast, by Application 2019 & 2032
- Table 41: North Africa US Oilfield Artificial Lift System Industry Revenue (Million) Forecast, by Application 2019 & 2032
- Table 42: South Africa US Oilfield Artificial Lift System Industry Revenue (Million) Forecast, by Application 2019 & 2032
- Table 43: Rest of Middle East & Africa US Oilfield Artificial Lift System Industry Revenue (Million) Forecast, by Application 2019 & 2032
- Table 44: Global US Oilfield Artificial Lift System Industry Revenue Million Forecast, by Type 2019 & 2032
- Table 45: Global US Oilfield Artificial Lift System Industry Revenue Million Forecast, by Area of Deployment 2019 & 2032
- Table 46: Global US Oilfield Artificial Lift System Industry Revenue Million Forecast, by Country 2019 & 2032
- Table 47: China US Oilfield Artificial Lift System Industry Revenue (Million) Forecast, by Application 2019 & 2032
- Table 48: India US Oilfield Artificial Lift System Industry Revenue (Million) Forecast, by Application 2019 & 2032
- Table 49: Japan US Oilfield Artificial Lift System Industry Revenue (Million) Forecast, by Application 2019 & 2032
- Table 50: South Korea US Oilfield Artificial Lift System Industry Revenue (Million) Forecast, by Application 2019 & 2032
- Table 51: ASEAN US Oilfield Artificial Lift System Industry Revenue (Million) Forecast, by Application 2019 & 2032
- Table 52: Oceania US Oilfield Artificial Lift System Industry Revenue (Million) Forecast, by Application 2019 & 2032
- Table 53: Rest of Asia Pacific US Oilfield Artificial Lift System Industry Revenue (Million) Forecast, by Application 2019 & 2032
Frequently Asked Questions
1. What is the projected Compound Annual Growth Rate (CAGR) of the US Oilfield Artificial Lift System Industry?
The projected CAGR is approximately > 3.00%.
2. Which companies are prominent players in the US Oilfield Artificial Lift System Industry?
Key companies in the market include Valiant Artificial Lift Solutions, Weatherford International PLC, Dover Corporation, Baker Hughes Company, ChampionX, Halliburton Company, Schlumberger Limited, NOV Inc, JJ Tech, KBA Engineering.
3. What are the main segments of the US Oilfield Artificial Lift System Industry?
The market segments include Type, Area of Deployment.
4. Can you provide details about the market size?
The market size is estimated to be USD XX Million as of 2022.
5. What are some drivers contributing to market growth?
4.; Declining Cost of Solar PV Installations4.; Supportive Government Policies For Renewable Energy.
6. What are the notable trends driving market growth?
Offshore Segment to Witness Significant Growth.
7. Are there any restraints impacting market growth?
4.; Penetration of Other Energy Sources.
8. Can you provide examples of recent developments in the market?
In September 2021, natural gas producer Vine Energy signed a contract with Baker Hughes to deploy its artificial lift solution, ProductionLink Edge, across 100 natural gas wells in Louisiana's Haynesville Shale. The automation solution uses advanced analytics and 'smart' edge technology to boost production and reduce associated methane emissions from oil and gas wells.
9. What pricing options are available for accessing the report?
Pricing options include single-user, multi-user, and enterprise licenses priced at USD 3800, USD 4500, and USD 5800 respectively.
10. Is the market size provided in terms of value or volume?
The market size is provided in terms of value, measured in Million.
11. Are there any specific market keywords associated with the report?
Yes, the market keyword associated with the report is "US Oilfield Artificial Lift System Industry," which aids in identifying and referencing the specific market segment covered.
12. How do I determine which pricing option suits my needs best?
The pricing options vary based on user requirements and access needs. Individual users may opt for single-user licenses, while businesses requiring broader access may choose multi-user or enterprise licenses for cost-effective access to the report.
13. Are there any additional resources or data provided in the US Oilfield Artificial Lift System Industry report?
While the report offers comprehensive insights, it's advisable to review the specific contents or supplementary materials provided to ascertain if additional resources or data are available.
14. How can I stay updated on further developments or reports in the US Oilfield Artificial Lift System Industry?
To stay informed about further developments, trends, and reports in the US Oilfield Artificial Lift System Industry, consider subscribing to industry newsletters, following relevant companies and organizations, or regularly checking reputable industry news sources and publications.
Methodology
Step 1 - Identification of Relevant Samples Size from Population Database


Step 2 - Approaches for Defining Global Market Size (Value, Volume* & Price*)

Note*: In applicable scenarios
Step 3 - Data Sources
Primary Research
- Web Analytics
- Survey Reports
- Research Institute
- Latest Research Reports
- Opinion Leaders
Secondary Research
- Annual Reports
- White Paper
- Latest Press Release
- Industry Association
- Paid Database
- Investor Presentations

Step 4 - Data Triangulation
Involves using different sources of information in order to increase the validity of a study
These sources are likely to be stakeholders in a program - participants, other researchers, program staff, other community members, and so on.
Then we put all data in single framework & apply various statistical tools to find out the dynamic on the market.
During the analysis stage, feedback from the stakeholder groups would be compared to determine areas of agreement as well as areas of divergence


