
Key Insights
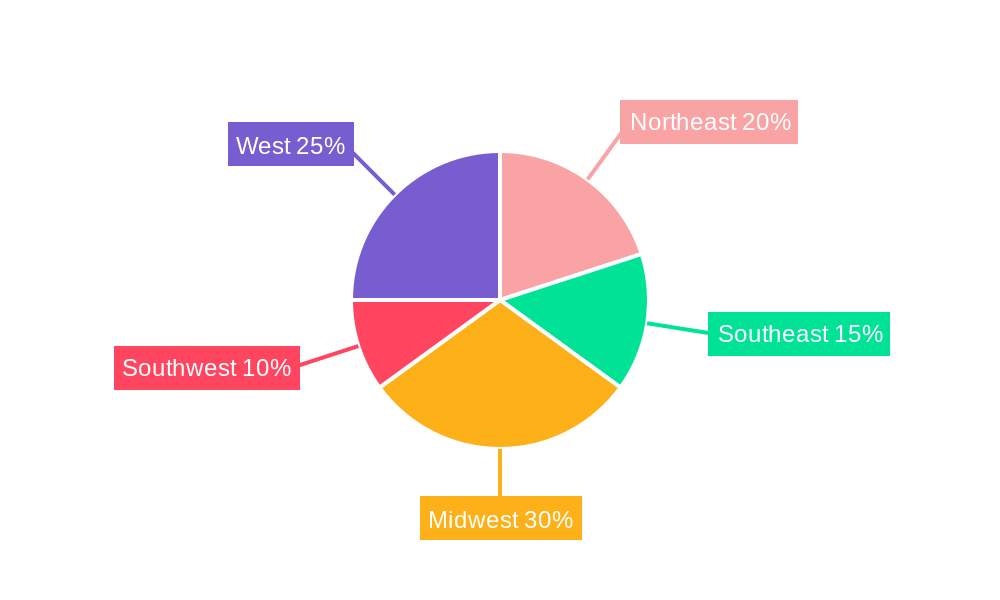
The US wind energy market, currently experiencing robust growth, is projected to expand significantly over the next decade. Driven by increasing demand for renewable energy sources, supportive government policies like tax credits and renewable portfolio standards (RPS), and decreasing technology costs, the market is poised for substantial expansion. The onshore segment currently dominates, but offshore wind is expected to witness exponential growth, particularly along the East Coast, due to favorable wind resources and substantial federal investment. Key players like Siemens Gamesa, Vestas, and General Electric are heavily involved in both equipment supply and project development, competing for market share within this dynamic landscape. The Midwest and West regions, possessing abundant land resources and suitable wind conditions, represent major growth areas for onshore wind. While regulatory hurdles and grid infrastructure limitations remain challenges, ongoing technological advancements in turbine design and energy storage solutions are mitigating these constraints.
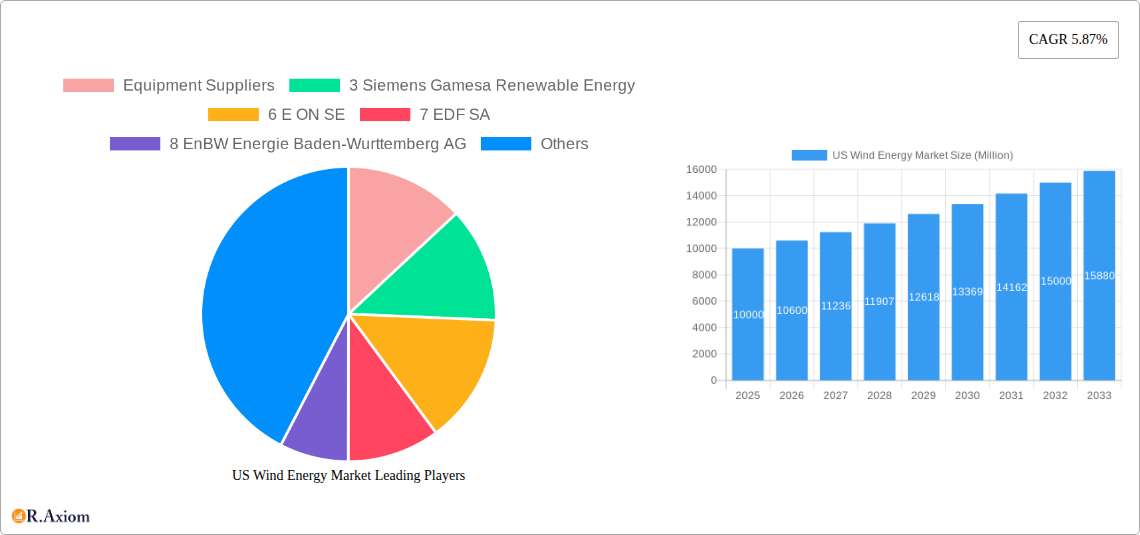
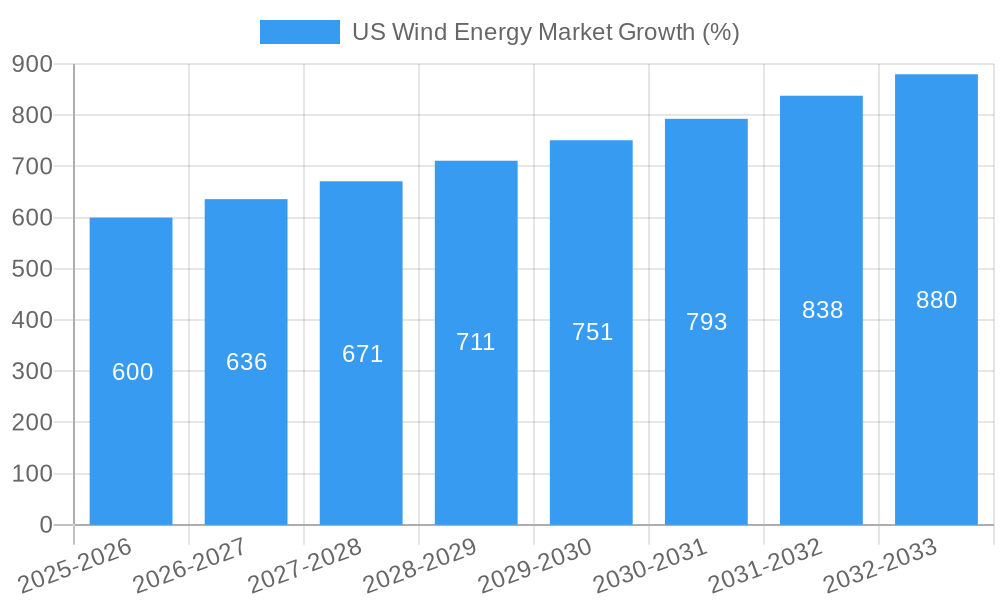
The market's trajectory is largely influenced by fluctuating energy prices, technological innovation, and the evolving regulatory environment. The forecast period of 2025-2033 suggests a sustained CAGR of 5.87%, indicating consistent expansion. Competition is fierce among both equipment suppliers and wind farm operators, with established players and newer entrants vying for prominence. Strategic partnerships, mergers, and acquisitions are expected to shape the market landscape, driving consolidation and potentially accelerating the adoption of innovative technologies. Further segmentation analysis, focusing on specific state-level data within the Northeast, Southeast, Midwest, Southwest, and West regions, would provide a granular understanding of the market's geographical distribution and growth potential within the United States.
US Wind Energy Market: A Comprehensive Report (2019-2033)
This in-depth report provides a comprehensive analysis of the US wind energy market, covering historical performance (2019-2024), the current state (2025), and future projections (2025-2033). The study meticulously examines market dynamics, including technological advancements, regulatory landscapes, competitive strategies, and emerging opportunities, offering actionable insights for stakeholders across the value chain.
Keywords: US Wind Energy Market, Wind Energy, Renewable Energy, Onshore Wind, Offshore Wind, Wind Turbine, Wind Farm, Market Analysis, Market Size, Market Share, Market Growth, CAGR, Investment, Siemens Gamesa, Vestas, GE, NextEra Energy, Equinor, BP, M&A, Regulatory Landscape, Technology Trends, Market Forecast.
US Wind Energy Market Market Concentration & Innovation
The US wind energy market exhibits a moderately concentrated structure, with a few dominant players controlling significant market share. Key equipment suppliers like Siemens Gamesa Renewable Energy, Vestas Wind Systems AS, and General Electric Company hold substantial market power, shaping technological advancements and influencing pricing. Wind farm operators like NextEra Energy Inc. and Orsted AS play a crucial role in project development and deployment. The market is characterized by continuous innovation, driven by the need for higher efficiency, cost reduction, and improved grid integration.
Market Concentration Metrics (2025):
- Top 3 Equipment Suppliers control approximately xx% of the market.
- Top 3 Wind Farm Operators account for roughly xx% of installed capacity.
Innovation Drivers:
- Advancements in turbine technology (larger rotor diameters, higher capacity factors).
- Development of offshore wind technologies for deeper waters.
- Integration of smart grids and energy storage solutions.
Regulatory Framework & M&A Activities:
Favorable government policies, including tax incentives and renewable energy standards, have significantly boosted market growth. The industry has witnessed several mergers and acquisitions (M&A) deals, with total transaction values exceeding USD xx Billion in the period 2019-2024. For instance, Equinor's acquisition of a stake in the Beacon Wind project highlights the strategic importance of offshore wind development.
US Wind Energy Market Industry Trends & Insights
The US wind energy market is experiencing robust growth, driven by several key factors. Increasing concerns about climate change and the need for cleaner energy sources are primary drivers. Government support through policies like the Inflation Reduction Act continues to fuel market expansion. Technological advancements, such as the development of larger and more efficient wind turbines, are significantly reducing the cost of energy, making wind power increasingly competitive with fossil fuels. The market is also witnessing an increasing adoption of offshore wind energy, unlocking substantial untapped potential.
Key Market Trends:
- CAGR for the US wind energy market during 2025-2033 is projected to be xx%.
- Market penetration of renewable energy in the US electricity mix is steadily increasing.
- Offshore wind is emerging as a major growth driver, with significant investments and project developments along the US East Coast.
Competitive Dynamics:
The market is characterized by intense competition among equipment suppliers, developers, and operators. Companies are focusing on differentiation through technological innovation, cost optimization, and strategic partnerships.
Dominant Markets & Segments in US Wind Energy Market
The US wind energy market is geographically diversified, with significant activity across several states. However, certain regions, particularly those with favorable wind resources and supportive policies, dominate. Onshore wind currently accounts for a larger share of the market compared to Offshore wind, driven by lower initial investment costs and established infrastructure. However, offshore wind is expected to experience exponential growth in the coming years.
Dominant Segments:
Onshore Wind: States like Texas, Iowa, Oklahoma, and Kansas benefit from favorable wind resources and established transmission infrastructure. Key drivers include:
- Abundant wind resources.
- Established supply chains.
- Supportive state-level policies.
Offshore Wind: The US East Coast is emerging as a key hub for offshore wind development, with several large-scale projects underway. Key drivers include:
- Significant untapped wind resource potential.
- Government support and incentives.
- Increasing technological advancements to address challenges in deeper waters.
US Wind Energy Market Product Developments
Significant advancements in wind turbine technology have led to larger rotor diameters, higher capacity factors, and improved energy efficiency. This has directly translated to lower levelized cost of energy (LCOE), enhancing the competitiveness of wind power. The development of floating offshore wind technology is expanding the potential deployment areas beyond shallow waters. Furthermore, integration of smart grid technologies and energy storage solutions enhances grid stability and improves power quality.
Report Scope & Segmentation Analysis
This report segments the US wind energy market by Location: Onshore and Offshore.
Onshore Wind: This segment encompasses wind farms located on land. The market size for onshore wind in 2025 is estimated at USD xx Million, with a projected growth driven by increasing demand for renewable energy and cost reductions.
Offshore Wind: This segment focuses on wind farms constructed in the ocean. The market size is considerably smaller than onshore in 2025 (USD xx Million) but is anticipated to grow significantly, driven by substantial investments and technological advancements.
Key Drivers of US Wind Energy Market Growth
The US wind energy market's growth is fueled by several factors, including:
- Government policies: Strong government support, including tax credits and renewable portfolio standards, incentivizes wind energy development.
- Technological advancements: Continuous innovation in turbine technology, resulting in higher efficiency and lower costs.
- Falling costs: LCOE for wind energy has declined dramatically, making it increasingly competitive with conventional energy sources.
- Environmental concerns: Growing awareness of climate change has accelerated the shift towards cleaner energy options.
Challenges in the US Wind Energy Market Sector
The US wind energy market faces several challenges, including:
- Intermittency: Wind power is an intermittent energy source, requiring effective grid integration and energy storage solutions.
- Transmission infrastructure: Upgrading existing transmission infrastructure to accommodate increased renewable energy generation is crucial.
- Permitting and regulatory processes: Streamlining the permitting process can accelerate project development and reduce costs.
- Supply chain constraints: Ensuring a stable and reliable supply chain for wind turbine components is critical.
Emerging Opportunities in US Wind Energy Market
Significant opportunities exist within the US wind energy market, including:
- Offshore wind development: Unlocking the vast potential of offshore wind resources along the US coast.
- Hybrid projects: Integrating wind energy with other renewable energy technologies such as solar PV.
- Energy storage solutions: Developing and deploying advanced energy storage technologies to address wind power intermittency.
- Green hydrogen production: Utilizing wind energy to produce green hydrogen for various industrial applications.
Leading Players in the US Wind Energy Market Market
- Siemens Gamesa Renewable Energy
- E.ON SE
- EDF SA
- EnBW Energie Baden-Wurttemberg AG
- General Electric Company
- Envision Energy
- Trident Winds Inc
- Orsted AS
- Vestas Wind Systems AS
- NextEra Energy Inc
- Acciona Energia SA
- Duke Energy Corporation
Key Developments in US Wind Energy Market Industry
- October 2020: Equinor announces the Empire Wind project (816 MW) in New York, scheduled for commissioning in 2024.
- September 2020: Equinor sells a 50% stake in the Empire Wind project to BP PLC for USD 1.1 Billion, also including a 50% stake in the Beacon Wind project.
Strategic Outlook for US Wind Energy Market Market
The US wind energy market is poised for sustained growth, driven by strong government support, technological advancements, and declining costs. Offshore wind will play a crucial role in shaping future market expansion, along with the increasing integration of energy storage solutions. The market's long-term prospects remain positive, offering significant opportunities for investors and industry participants alike.
US Wind Energy Market Segmentation
- 1. Onshore
- 2. Offshore
US Wind Energy Market Segmentation By Geography
-
1. North America
- 1.1. United States
- 1.2. Canada
- 1.3. Mexico
-
2. South America
- 2.1. Brazil
- 2.2. Argentina
- 2.3. Rest of South America
-
3. Europe
- 3.1. United Kingdom
- 3.2. Germany
- 3.3. France
- 3.4. Italy
- 3.5. Spain
- 3.6. Russia
- 3.7. Benelux
- 3.8. Nordics
- 3.9. Rest of Europe
-
4. Middle East & Africa
- 4.1. Turkey
- 4.2. Israel
- 4.3. GCC
- 4.4. North Africa
- 4.5. South Africa
- 4.6. Rest of Middle East & Africa
-
5. Asia Pacific
- 5.1. China
- 5.2. India
- 5.3. Japan
- 5.4. South Korea
- 5.5. ASEAN
- 5.6. Oceania
- 5.7. Rest of Asia Pacific
US Wind Energy Market REPORT HIGHLIGHTS
| Aspects | Details |
|---|---|
| Study Period | 2019-2033 |
| Base Year | 2024 |
| Estimated Year | 2025 |
| Forecast Period | 2025-2033 |
| Historical Period | 2019-2024 |
| Growth Rate | CAGR of 5.87% from 2019-2033 |
| Segmentation |
|
Table of Contents
- 1. Introduction
- 1.1. Research Scope
- 1.2. Market Segmentation
- 1.3. Research Methodology
- 1.4. Definitions and Assumptions
- 2. Executive Summary
- 2.1. Introduction
- 3. Market Dynamics
- 3.1. Introduction
- 3.2. Market Drivers
- 3.2.1. 4.; Global Inclination toward Renewable-based Power Generation4.; Increased Power Demand in Line with the Increasing Population
- 3.3. Market Restrains
- 3.3.1. 4.; High Initial Cost
- 3.4. Market Trends
- 3.4.1. Onshore Segment to Dominate the Market
- 4. Market Factor Analysis
- 4.1. Porters Five Forces
- 4.2. Supply/Value Chain
- 4.3. PESTEL analysis
- 4.4. Market Entropy
- 4.5. Patent/Trademark Analysis
- 5. Global US Wind Energy Market Analysis, Insights and Forecast, 2019-2031
- 5.1. Market Analysis, Insights and Forecast - by Onshore
- 5.2. Market Analysis, Insights and Forecast - by Offshore
- 5.3. Market Analysis, Insights and Forecast - by Region
- 5.3.1. North America
- 5.3.2. South America
- 5.3.3. Europe
- 5.3.4. Middle East & Africa
- 5.3.5. Asia Pacific
- 5.1. Market Analysis, Insights and Forecast - by Onshore
- 6. North America US Wind Energy Market Analysis, Insights and Forecast, 2019-2031
- 6.1. Market Analysis, Insights and Forecast - by Onshore
- 6.2. Market Analysis, Insights and Forecast - by Offshore
- 6.1. Market Analysis, Insights and Forecast - by Onshore
- 7. South America US Wind Energy Market Analysis, Insights and Forecast, 2019-2031
- 7.1. Market Analysis, Insights and Forecast - by Onshore
- 7.2. Market Analysis, Insights and Forecast - by Offshore
- 7.1. Market Analysis, Insights and Forecast - by Onshore
- 8. Europe US Wind Energy Market Analysis, Insights and Forecast, 2019-2031
- 8.1. Market Analysis, Insights and Forecast - by Onshore
- 8.2. Market Analysis, Insights and Forecast - by Offshore
- 8.1. Market Analysis, Insights and Forecast - by Onshore
- 9. Middle East & Africa US Wind Energy Market Analysis, Insights and Forecast, 2019-2031
- 9.1. Market Analysis, Insights and Forecast - by Onshore
- 9.2. Market Analysis, Insights and Forecast - by Offshore
- 9.1. Market Analysis, Insights and Forecast - by Onshore
- 10. Asia Pacific US Wind Energy Market Analysis, Insights and Forecast, 2019-2031
- 10.1. Market Analysis, Insights and Forecast - by Onshore
- 10.2. Market Analysis, Insights and Forecast - by Offshore
- 10.1. Market Analysis, Insights and Forecast - by Onshore
- 11. Northeast US Wind Energy Market Analysis, Insights and Forecast, 2019-2031
- 12. Southeast US Wind Energy Market Analysis, Insights and Forecast, 2019-2031
- 13. Midwest US Wind Energy Market Analysis, Insights and Forecast, 2019-2031
- 14. Southwest US Wind Energy Market Analysis, Insights and Forecast, 2019-2031
- 15. West US Wind Energy Market Analysis, Insights and Forecast, 2019-2031
- 16. Competitive Analysis
- 16.1. Global Market Share Analysis 2024
- 16.2. Company Profiles
- 16.2.1 Equipment Suppliers
- 16.2.1.1. Overview
- 16.2.1.2. Products
- 16.2.1.3. SWOT Analysis
- 16.2.1.4. Recent Developments
- 16.2.1.5. Financials (Based on Availability)
- 16.2.2 3 Siemens Gamesa Renewable Energy
- 16.2.2.1. Overview
- 16.2.2.2. Products
- 16.2.2.3. SWOT Analysis
- 16.2.2.4. Recent Developments
- 16.2.2.5. Financials (Based on Availability)
- 16.2.3 6 E ON SE
- 16.2.3.1. Overview
- 16.2.3.2. Products
- 16.2.3.3. SWOT Analysis
- 16.2.3.4. Recent Developments
- 16.2.3.5. Financials (Based on Availability)
- 16.2.4 7 EDF SA
- 16.2.4.1. Overview
- 16.2.4.2. Products
- 16.2.4.3. SWOT Analysis
- 16.2.4.4. Recent Developments
- 16.2.4.5. Financials (Based on Availability)
- 16.2.5 8 EnBW Energie Baden-Wurttemberg AG
- 16.2.5.1. Overview
- 16.2.5.2. Products
- 16.2.5.3. SWOT Analysis
- 16.2.5.4. Recent Developments
- 16.2.5.5. Financials (Based on Availability)
- 16.2.6 2 General Electric Company
- 16.2.6.1. Overview
- 16.2.6.2. Products
- 16.2.6.3. SWOT Analysis
- 16.2.6.4. Recent Developments
- 16.2.6.5. Financials (Based on Availability)
- 16.2.7 1 Envision Energy
- 16.2.7.1. Overview
- 16.2.7.2. Products
- 16.2.7.3. SWOT Analysis
- 16.2.7.4. Recent Developments
- 16.2.7.5. Financials (Based on Availability)
- 16.2.8 5 Trident Winds Inc
- 16.2.8.1. Overview
- 16.2.8.2. Products
- 16.2.8.3. SWOT Analysis
- 16.2.8.4. Recent Developments
- 16.2.8.5. Financials (Based on Availability)
- 16.2.9 2 Orsted AS
- 16.2.9.1. Overview
- 16.2.9.2. Products
- 16.2.9.3. SWOT Analysis
- 16.2.9.4. Recent Developments
- 16.2.9.5. Financials (Based on Availability)
- 16.2.10 Wind Farm Operators
- 16.2.10.1. Overview
- 16.2.10.2. Products
- 16.2.10.3. SWOT Analysis
- 16.2.10.4. Recent Developments
- 16.2.10.5. Financials (Based on Availability)
- 16.2.11 4 Vestas Wind Systems AS
- 16.2.11.1. Overview
- 16.2.11.2. Products
- 16.2.11.3. SWOT Analysis
- 16.2.11.4. Recent Developments
- 16.2.11.5. Financials (Based on Availability)
- 16.2.12 4 NextEra Energy Inc
- 16.2.12.1. Overview
- 16.2.12.2. Products
- 16.2.12.3. SWOT Analysis
- 16.2.12.4. Recent Developments
- 16.2.12.5. Financials (Based on Availability)
- 16.2.13 1 Acciona Energia SA
- 16.2.13.1. Overview
- 16.2.13.2. Products
- 16.2.13.3. SWOT Analysis
- 16.2.13.4. Recent Developments
- 16.2.13.5. Financials (Based on Availability)
- 16.2.14 3 Duke Energy Corporation
- 16.2.14.1. Overview
- 16.2.14.2. Products
- 16.2.14.3. SWOT Analysis
- 16.2.14.4. Recent Developments
- 16.2.14.5. Financials (Based on Availability)
- 16.2.1 Equipment Suppliers
List of Figures
- Figure 1: Global US Wind Energy Market Revenue Breakdown (Million, %) by Region 2024 & 2032
- Figure 2: Global US Wind Energy Market Volume Breakdown (gigawatt, %) by Region 2024 & 2032
- Figure 3: United states US Wind Energy Market Revenue (Million), by Country 2024 & 2032
- Figure 4: United states US Wind Energy Market Volume (gigawatt), by Country 2024 & 2032
- Figure 5: United states US Wind Energy Market Revenue Share (%), by Country 2024 & 2032
- Figure 6: United states US Wind Energy Market Volume Share (%), by Country 2024 & 2032
- Figure 7: North America US Wind Energy Market Revenue (Million), by Onshore 2024 & 2032
- Figure 8: North America US Wind Energy Market Volume (gigawatt), by Onshore 2024 & 2032
- Figure 9: North America US Wind Energy Market Revenue Share (%), by Onshore 2024 & 2032
- Figure 10: North America US Wind Energy Market Volume Share (%), by Onshore 2024 & 2032
- Figure 11: North America US Wind Energy Market Revenue (Million), by Offshore 2024 & 2032
- Figure 12: North America US Wind Energy Market Volume (gigawatt), by Offshore 2024 & 2032
- Figure 13: North America US Wind Energy Market Revenue Share (%), by Offshore 2024 & 2032
- Figure 14: North America US Wind Energy Market Volume Share (%), by Offshore 2024 & 2032
- Figure 15: North America US Wind Energy Market Revenue (Million), by Country 2024 & 2032
- Figure 16: North America US Wind Energy Market Volume (gigawatt), by Country 2024 & 2032
- Figure 17: North America US Wind Energy Market Revenue Share (%), by Country 2024 & 2032
- Figure 18: North America US Wind Energy Market Volume Share (%), by Country 2024 & 2032
- Figure 19: South America US Wind Energy Market Revenue (Million), by Onshore 2024 & 2032
- Figure 20: South America US Wind Energy Market Volume (gigawatt), by Onshore 2024 & 2032
- Figure 21: South America US Wind Energy Market Revenue Share (%), by Onshore 2024 & 2032
- Figure 22: South America US Wind Energy Market Volume Share (%), by Onshore 2024 & 2032
- Figure 23: South America US Wind Energy Market Revenue (Million), by Offshore 2024 & 2032
- Figure 24: South America US Wind Energy Market Volume (gigawatt), by Offshore 2024 & 2032
- Figure 25: South America US Wind Energy Market Revenue Share (%), by Offshore 2024 & 2032
- Figure 26: South America US Wind Energy Market Volume Share (%), by Offshore 2024 & 2032
- Figure 27: South America US Wind Energy Market Revenue (Million), by Country 2024 & 2032
- Figure 28: South America US Wind Energy Market Volume (gigawatt), by Country 2024 & 2032
- Figure 29: South America US Wind Energy Market Revenue Share (%), by Country 2024 & 2032
- Figure 30: South America US Wind Energy Market Volume Share (%), by Country 2024 & 2032
- Figure 31: Europe US Wind Energy Market Revenue (Million), by Onshore 2024 & 2032
- Figure 32: Europe US Wind Energy Market Volume (gigawatt), by Onshore 2024 & 2032
- Figure 33: Europe US Wind Energy Market Revenue Share (%), by Onshore 2024 & 2032
- Figure 34: Europe US Wind Energy Market Volume Share (%), by Onshore 2024 & 2032
- Figure 35: Europe US Wind Energy Market Revenue (Million), by Offshore 2024 & 2032
- Figure 36: Europe US Wind Energy Market Volume (gigawatt), by Offshore 2024 & 2032
- Figure 37: Europe US Wind Energy Market Revenue Share (%), by Offshore 2024 & 2032
- Figure 38: Europe US Wind Energy Market Volume Share (%), by Offshore 2024 & 2032
- Figure 39: Europe US Wind Energy Market Revenue (Million), by Country 2024 & 2032
- Figure 40: Europe US Wind Energy Market Volume (gigawatt), by Country 2024 & 2032
- Figure 41: Europe US Wind Energy Market Revenue Share (%), by Country 2024 & 2032
- Figure 42: Europe US Wind Energy Market Volume Share (%), by Country 2024 & 2032
- Figure 43: Middle East & Africa US Wind Energy Market Revenue (Million), by Onshore 2024 & 2032
- Figure 44: Middle East & Africa US Wind Energy Market Volume (gigawatt), by Onshore 2024 & 2032
- Figure 45: Middle East & Africa US Wind Energy Market Revenue Share (%), by Onshore 2024 & 2032
- Figure 46: Middle East & Africa US Wind Energy Market Volume Share (%), by Onshore 2024 & 2032
- Figure 47: Middle East & Africa US Wind Energy Market Revenue (Million), by Offshore 2024 & 2032
- Figure 48: Middle East & Africa US Wind Energy Market Volume (gigawatt), by Offshore 2024 & 2032
- Figure 49: Middle East & Africa US Wind Energy Market Revenue Share (%), by Offshore 2024 & 2032
- Figure 50: Middle East & Africa US Wind Energy Market Volume Share (%), by Offshore 2024 & 2032
- Figure 51: Middle East & Africa US Wind Energy Market Revenue (Million), by Country 2024 & 2032
- Figure 52: Middle East & Africa US Wind Energy Market Volume (gigawatt), by Country 2024 & 2032
- Figure 53: Middle East & Africa US Wind Energy Market Revenue Share (%), by Country 2024 & 2032
- Figure 54: Middle East & Africa US Wind Energy Market Volume Share (%), by Country 2024 & 2032
- Figure 55: Asia Pacific US Wind Energy Market Revenue (Million), by Onshore 2024 & 2032
- Figure 56: Asia Pacific US Wind Energy Market Volume (gigawatt), by Onshore 2024 & 2032
- Figure 57: Asia Pacific US Wind Energy Market Revenue Share (%), by Onshore 2024 & 2032
- Figure 58: Asia Pacific US Wind Energy Market Volume Share (%), by Onshore 2024 & 2032
- Figure 59: Asia Pacific US Wind Energy Market Revenue (Million), by Offshore 2024 & 2032
- Figure 60: Asia Pacific US Wind Energy Market Volume (gigawatt), by Offshore 2024 & 2032
- Figure 61: Asia Pacific US Wind Energy Market Revenue Share (%), by Offshore 2024 & 2032
- Figure 62: Asia Pacific US Wind Energy Market Volume Share (%), by Offshore 2024 & 2032
- Figure 63: Asia Pacific US Wind Energy Market Revenue (Million), by Country 2024 & 2032
- Figure 64: Asia Pacific US Wind Energy Market Volume (gigawatt), by Country 2024 & 2032
- Figure 65: Asia Pacific US Wind Energy Market Revenue Share (%), by Country 2024 & 2032
- Figure 66: Asia Pacific US Wind Energy Market Volume Share (%), by Country 2024 & 2032
List of Tables
- Table 1: Global US Wind Energy Market Revenue Million Forecast, by Region 2019 & 2032
- Table 2: Global US Wind Energy Market Volume gigawatt Forecast, by Region 2019 & 2032
- Table 3: Global US Wind Energy Market Revenue Million Forecast, by Onshore 2019 & 2032
- Table 4: Global US Wind Energy Market Volume gigawatt Forecast, by Onshore 2019 & 2032
- Table 5: Global US Wind Energy Market Revenue Million Forecast, by Offshore 2019 & 2032
- Table 6: Global US Wind Energy Market Volume gigawatt Forecast, by Offshore 2019 & 2032
- Table 7: Global US Wind Energy Market Revenue Million Forecast, by Region 2019 & 2032
- Table 8: Global US Wind Energy Market Volume gigawatt Forecast, by Region 2019 & 2032
- Table 9: Global US Wind Energy Market Revenue Million Forecast, by Country 2019 & 2032
- Table 10: Global US Wind Energy Market Volume gigawatt Forecast, by Country 2019 & 2032
- Table 11: Northeast US Wind Energy Market Revenue (Million) Forecast, by Application 2019 & 2032
- Table 12: Northeast US Wind Energy Market Volume (gigawatt) Forecast, by Application 2019 & 2032
- Table 13: Southeast US Wind Energy Market Revenue (Million) Forecast, by Application 2019 & 2032
- Table 14: Southeast US Wind Energy Market Volume (gigawatt) Forecast, by Application 2019 & 2032
- Table 15: Midwest US Wind Energy Market Revenue (Million) Forecast, by Application 2019 & 2032
- Table 16: Midwest US Wind Energy Market Volume (gigawatt) Forecast, by Application 2019 & 2032
- Table 17: Southwest US Wind Energy Market Revenue (Million) Forecast, by Application 2019 & 2032
- Table 18: Southwest US Wind Energy Market Volume (gigawatt) Forecast, by Application 2019 & 2032
- Table 19: West US Wind Energy Market Revenue (Million) Forecast, by Application 2019 & 2032
- Table 20: West US Wind Energy Market Volume (gigawatt) Forecast, by Application 2019 & 2032
- Table 21: Global US Wind Energy Market Revenue Million Forecast, by Onshore 2019 & 2032
- Table 22: Global US Wind Energy Market Volume gigawatt Forecast, by Onshore 2019 & 2032
- Table 23: Global US Wind Energy Market Revenue Million Forecast, by Offshore 2019 & 2032
- Table 24: Global US Wind Energy Market Volume gigawatt Forecast, by Offshore 2019 & 2032
- Table 25: Global US Wind Energy Market Revenue Million Forecast, by Country 2019 & 2032
- Table 26: Global US Wind Energy Market Volume gigawatt Forecast, by Country 2019 & 2032
- Table 27: United States US Wind Energy Market Revenue (Million) Forecast, by Application 2019 & 2032
- Table 28: United States US Wind Energy Market Volume (gigawatt) Forecast, by Application 2019 & 2032
- Table 29: Canada US Wind Energy Market Revenue (Million) Forecast, by Application 2019 & 2032
- Table 30: Canada US Wind Energy Market Volume (gigawatt) Forecast, by Application 2019 & 2032
- Table 31: Mexico US Wind Energy Market Revenue (Million) Forecast, by Application 2019 & 2032
- Table 32: Mexico US Wind Energy Market Volume (gigawatt) Forecast, by Application 2019 & 2032
- Table 33: Global US Wind Energy Market Revenue Million Forecast, by Onshore 2019 & 2032
- Table 34: Global US Wind Energy Market Volume gigawatt Forecast, by Onshore 2019 & 2032
- Table 35: Global US Wind Energy Market Revenue Million Forecast, by Offshore 2019 & 2032
- Table 36: Global US Wind Energy Market Volume gigawatt Forecast, by Offshore 2019 & 2032
- Table 37: Global US Wind Energy Market Revenue Million Forecast, by Country 2019 & 2032
- Table 38: Global US Wind Energy Market Volume gigawatt Forecast, by Country 2019 & 2032
- Table 39: Brazil US Wind Energy Market Revenue (Million) Forecast, by Application 2019 & 2032
- Table 40: Brazil US Wind Energy Market Volume (gigawatt) Forecast, by Application 2019 & 2032
- Table 41: Argentina US Wind Energy Market Revenue (Million) Forecast, by Application 2019 & 2032
- Table 42: Argentina US Wind Energy Market Volume (gigawatt) Forecast, by Application 2019 & 2032
- Table 43: Rest of South America US Wind Energy Market Revenue (Million) Forecast, by Application 2019 & 2032
- Table 44: Rest of South America US Wind Energy Market Volume (gigawatt) Forecast, by Application 2019 & 2032
- Table 45: Global US Wind Energy Market Revenue Million Forecast, by Onshore 2019 & 2032
- Table 46: Global US Wind Energy Market Volume gigawatt Forecast, by Onshore 2019 & 2032
- Table 47: Global US Wind Energy Market Revenue Million Forecast, by Offshore 2019 & 2032
- Table 48: Global US Wind Energy Market Volume gigawatt Forecast, by Offshore 2019 & 2032
- Table 49: Global US Wind Energy Market Revenue Million Forecast, by Country 2019 & 2032
- Table 50: Global US Wind Energy Market Volume gigawatt Forecast, by Country 2019 & 2032
- Table 51: United Kingdom US Wind Energy Market Revenue (Million) Forecast, by Application 2019 & 2032
- Table 52: United Kingdom US Wind Energy Market Volume (gigawatt) Forecast, by Application 2019 & 2032
- Table 53: Germany US Wind Energy Market Revenue (Million) Forecast, by Application 2019 & 2032
- Table 54: Germany US Wind Energy Market Volume (gigawatt) Forecast, by Application 2019 & 2032
- Table 55: France US Wind Energy Market Revenue (Million) Forecast, by Application 2019 & 2032
- Table 56: France US Wind Energy Market Volume (gigawatt) Forecast, by Application 2019 & 2032
- Table 57: Italy US Wind Energy Market Revenue (Million) Forecast, by Application 2019 & 2032
- Table 58: Italy US Wind Energy Market Volume (gigawatt) Forecast, by Application 2019 & 2032
- Table 59: Spain US Wind Energy Market Revenue (Million) Forecast, by Application 2019 & 2032
- Table 60: Spain US Wind Energy Market Volume (gigawatt) Forecast, by Application 2019 & 2032
- Table 61: Russia US Wind Energy Market Revenue (Million) Forecast, by Application 2019 & 2032
- Table 62: Russia US Wind Energy Market Volume (gigawatt) Forecast, by Application 2019 & 2032
- Table 63: Benelux US Wind Energy Market Revenue (Million) Forecast, by Application 2019 & 2032
- Table 64: Benelux US Wind Energy Market Volume (gigawatt) Forecast, by Application 2019 & 2032
- Table 65: Nordics US Wind Energy Market Revenue (Million) Forecast, by Application 2019 & 2032
- Table 66: Nordics US Wind Energy Market Volume (gigawatt) Forecast, by Application 2019 & 2032
- Table 67: Rest of Europe US Wind Energy Market Revenue (Million) Forecast, by Application 2019 & 2032
- Table 68: Rest of Europe US Wind Energy Market Volume (gigawatt) Forecast, by Application 2019 & 2032
- Table 69: Global US Wind Energy Market Revenue Million Forecast, by Onshore 2019 & 2032
- Table 70: Global US Wind Energy Market Volume gigawatt Forecast, by Onshore 2019 & 2032
- Table 71: Global US Wind Energy Market Revenue Million Forecast, by Offshore 2019 & 2032
- Table 72: Global US Wind Energy Market Volume gigawatt Forecast, by Offshore 2019 & 2032
- Table 73: Global US Wind Energy Market Revenue Million Forecast, by Country 2019 & 2032
- Table 74: Global US Wind Energy Market Volume gigawatt Forecast, by Country 2019 & 2032
- Table 75: Turkey US Wind Energy Market Revenue (Million) Forecast, by Application 2019 & 2032
- Table 76: Turkey US Wind Energy Market Volume (gigawatt) Forecast, by Application 2019 & 2032
- Table 77: Israel US Wind Energy Market Revenue (Million) Forecast, by Application 2019 & 2032
- Table 78: Israel US Wind Energy Market Volume (gigawatt) Forecast, by Application 2019 & 2032
- Table 79: GCC US Wind Energy Market Revenue (Million) Forecast, by Application 2019 & 2032
- Table 80: GCC US Wind Energy Market Volume (gigawatt) Forecast, by Application 2019 & 2032
- Table 81: North Africa US Wind Energy Market Revenue (Million) Forecast, by Application 2019 & 2032
- Table 82: North Africa US Wind Energy Market Volume (gigawatt) Forecast, by Application 2019 & 2032
- Table 83: South Africa US Wind Energy Market Revenue (Million) Forecast, by Application 2019 & 2032
- Table 84: South Africa US Wind Energy Market Volume (gigawatt) Forecast, by Application 2019 & 2032
- Table 85: Rest of Middle East & Africa US Wind Energy Market Revenue (Million) Forecast, by Application 2019 & 2032
- Table 86: Rest of Middle East & Africa US Wind Energy Market Volume (gigawatt) Forecast, by Application 2019 & 2032
- Table 87: Global US Wind Energy Market Revenue Million Forecast, by Onshore 2019 & 2032
- Table 88: Global US Wind Energy Market Volume gigawatt Forecast, by Onshore 2019 & 2032
- Table 89: Global US Wind Energy Market Revenue Million Forecast, by Offshore 2019 & 2032
- Table 90: Global US Wind Energy Market Volume gigawatt Forecast, by Offshore 2019 & 2032
- Table 91: Global US Wind Energy Market Revenue Million Forecast, by Country 2019 & 2032
- Table 92: Global US Wind Energy Market Volume gigawatt Forecast, by Country 2019 & 2032
- Table 93: China US Wind Energy Market Revenue (Million) Forecast, by Application 2019 & 2032
- Table 94: China US Wind Energy Market Volume (gigawatt) Forecast, by Application 2019 & 2032
- Table 95: India US Wind Energy Market Revenue (Million) Forecast, by Application 2019 & 2032
- Table 96: India US Wind Energy Market Volume (gigawatt) Forecast, by Application 2019 & 2032
- Table 97: Japan US Wind Energy Market Revenue (Million) Forecast, by Application 2019 & 2032
- Table 98: Japan US Wind Energy Market Volume (gigawatt) Forecast, by Application 2019 & 2032
- Table 99: South Korea US Wind Energy Market Revenue (Million) Forecast, by Application 2019 & 2032
- Table 100: South Korea US Wind Energy Market Volume (gigawatt) Forecast, by Application 2019 & 2032
- Table 101: ASEAN US Wind Energy Market Revenue (Million) Forecast, by Application 2019 & 2032
- Table 102: ASEAN US Wind Energy Market Volume (gigawatt) Forecast, by Application 2019 & 2032
- Table 103: Oceania US Wind Energy Market Revenue (Million) Forecast, by Application 2019 & 2032
- Table 104: Oceania US Wind Energy Market Volume (gigawatt) Forecast, by Application 2019 & 2032
- Table 105: Rest of Asia Pacific US Wind Energy Market Revenue (Million) Forecast, by Application 2019 & 2032
- Table 106: Rest of Asia Pacific US Wind Energy Market Volume (gigawatt) Forecast, by Application 2019 & 2032
Frequently Asked Questions
1. What is the projected Compound Annual Growth Rate (CAGR) of the US Wind Energy Market?
The projected CAGR is approximately 5.87%.
2. Which companies are prominent players in the US Wind Energy Market?
Key companies in the market include Equipment Suppliers, 3 Siemens Gamesa Renewable Energy, 6 E ON SE, 7 EDF SA, 8 EnBW Energie Baden-Wurttemberg AG, 2 General Electric Company, 1 Envision Energy, 5 Trident Winds Inc, 2 Orsted AS, Wind Farm Operators, 4 Vestas Wind Systems AS, 4 NextEra Energy Inc, 1 Acciona Energia SA, 3 Duke Energy Corporation.
3. What are the main segments of the US Wind Energy Market?
The market segments include Onshore, Offshore.
4. Can you provide details about the market size?
The market size is estimated to be USD XX Million as of 2022.
5. What are some drivers contributing to market growth?
4.; Global Inclination toward Renewable-based Power Generation4.; Increased Power Demand in Line with the Increasing Population.
6. What are the notable trends driving market growth?
Onshore Segment to Dominate the Market.
7. Are there any restraints impacting market growth?
4.; High Initial Cost.
8. Can you provide examples of recent developments in the market?
In October 2020, Equinor announced its Empire wind project with an installed capacity of 816MW, scheduled to be commissioned by 2024. The project will meet the power needs of more than half a million households in New York. Equinor is currently the sole owner of the Empire wind project and will remain the operator throughout the development, construction, and operations phases.
9. What pricing options are available for accessing the report?
Pricing options include single-user, multi-user, and enterprise licenses priced at USD 3800, USD 4500, and USD 5800 respectively.
10. Is the market size provided in terms of value or volume?
The market size is provided in terms of value, measured in Million and volume, measured in gigawatt.
11. Are there any specific market keywords associated with the report?
Yes, the market keyword associated with the report is "US Wind Energy Market," which aids in identifying and referencing the specific market segment covered.
12. How do I determine which pricing option suits my needs best?
The pricing options vary based on user requirements and access needs. Individual users may opt for single-user licenses, while businesses requiring broader access may choose multi-user or enterprise licenses for cost-effective access to the report.
13. Are there any additional resources or data provided in the US Wind Energy Market report?
While the report offers comprehensive insights, it's advisable to review the specific contents or supplementary materials provided to ascertain if additional resources or data are available.
14. How can I stay updated on further developments or reports in the US Wind Energy Market?
To stay informed about further developments, trends, and reports in the US Wind Energy Market, consider subscribing to industry newsletters, following relevant companies and organizations, or regularly checking reputable industry news sources and publications.
Methodology
Step 1 - Identification of Relevant Samples Size from Population Database


Step 2 - Approaches for Defining Global Market Size (Value, Volume* & Price*)

Note*: In applicable scenarios
Step 3 - Data Sources
Primary Research
- Web Analytics
- Survey Reports
- Research Institute
- Latest Research Reports
- Opinion Leaders
Secondary Research
- Annual Reports
- White Paper
- Latest Press Release
- Industry Association
- Paid Database
- Investor Presentations

Step 4 - Data Triangulation
Involves using different sources of information in order to increase the validity of a study
These sources are likely to be stakeholders in a program - participants, other researchers, program staff, other community members, and so on.
Then we put all data in single framework & apply various statistical tools to find out the dynamic on the market.
During the analysis stage, feedback from the stakeholder groups would be compared to determine areas of agreement as well as areas of divergence


