
Key Insights
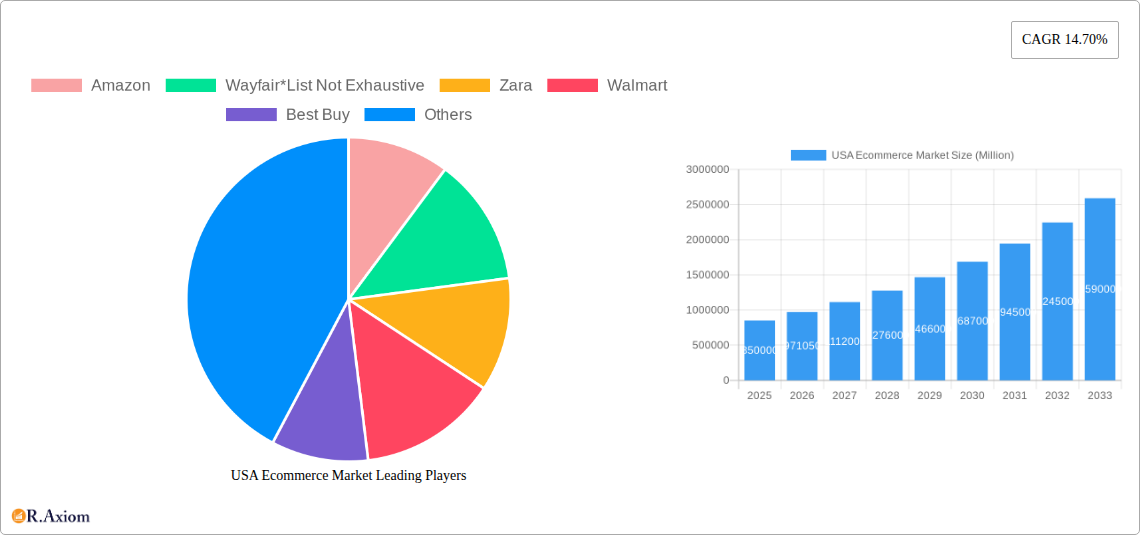
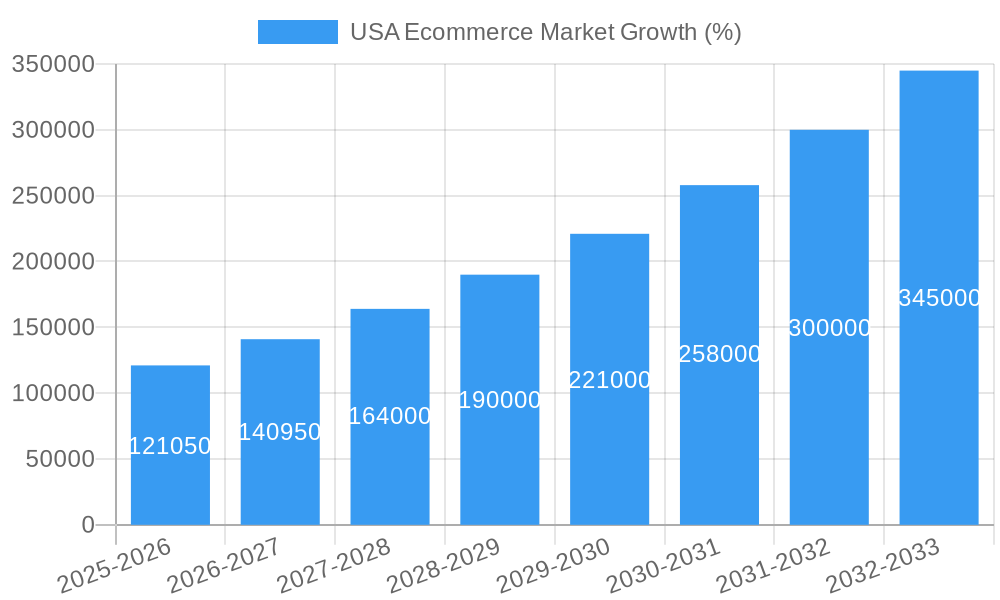
The US e-commerce market, exhibiting a robust CAGR of 14.70%, presents a compelling investment landscape. The market's expansion is fueled by several key drivers, including increasing internet and smartphone penetration, the growing preference for convenience and online shopping, and the proliferation of mobile commerce. Expanding logistics networks and improved payment infrastructure further contribute to this growth. While specific market size figures for 2025 are unavailable, leveraging the provided CAGR and assuming a reasonable 2019 base value (estimated based on publicly available reports of the total US retail market at that time and the portion allocated to e-commerce), we can project substantial growth. Major players like Amazon, Walmart, Target, and Best Buy dominate the market, leveraging extensive logistics networks and brand recognition. However, smaller niche players also thrive by focusing on specific customer segments or product categories. Market segmentation by application (e.g., apparel, electronics, groceries) reveals diverse growth rates, with certain segments experiencing faster expansion than others. Geographic distribution across the US reveals regional variations in e-commerce penetration, influenced by factors like population density, income levels, and internet access. Future growth will depend on several factors including continued technological advancements, evolving consumer behavior, effective management of supply chain logistics, and the ability of companies to adapt to emerging trends in personalized marketing and AI-driven customer service.
The forecast period (2025-2033) anticipates continued significant growth driven by factors such as the increasing adoption of omnichannel strategies by retailers, the rise of social commerce, and the continuing integration of augmented and virtual reality into the shopping experience. Competition will intensify, with existing players investing in technological advancements and new market entrants constantly emerging. Regulatory considerations regarding data privacy, consumer protection, and fair competition will also play a significant role in shaping the market's trajectory. A deeper understanding of consumer preferences, coupled with strategic investments in technology and logistics, will be crucial for companies aiming to succeed in this dynamic and rapidly evolving market. Specific regional analyses will showcase potential growth areas and highlight opportunities for strategic expansion.
USA Ecommerce Market: A Comprehensive Report (2019-2033)
This in-depth report provides a comprehensive analysis of the USA Ecommerce Market, covering market size, growth drivers, competitive landscape, and future projections from 2019 to 2033. The report is designed for industry stakeholders, investors, and businesses seeking to understand and capitalize on the dynamic opportunities within this thriving sector. With a base year of 2025 and a forecast period spanning 2025-2033, this report offers actionable insights and strategic recommendations for navigating the complexities of the US ecommerce landscape. The analysis incorporates key players such as Amazon, Wayfair, Zara, Walmart, Best Buy, Home Depot, Kroger, Costco, Target, and Apple, but the list is not exhaustive.
USA Ecommerce Market Market Concentration & Innovation
The USA ecommerce market exhibits a high degree of concentration, with a few dominant players holding significant market share. Amazon, for instance, commands a substantial portion, estimated at xx Million in 2025, followed by Walmart and other major players. However, the market also displays significant innovation, driven by technological advancements, evolving consumer preferences, and increasing competition. This leads to continuous product development, improved logistics, and personalized shopping experiences.
Regulatory frameworks, such as data privacy regulations and antitrust laws, play a crucial role in shaping market dynamics. The presence of product substitutes, such as physical retail stores and direct-to-consumer brands, adds further complexity to the competitive landscape. End-user trends, characterized by a preference for convenience, personalization, and seamless omnichannel experiences, are key factors driving market evolution. Furthermore, the market witnesses significant M&A activities, with deal values reaching xx Million in 2024. These mergers and acquisitions aim to expand market reach, enhance technology capabilities, and broaden product offerings.
- Key Metrics:
- Amazon Market Share (2025): xx%
- Walmart Market Share (2025): xx%
- Total M&A Deal Value (2024): xx Million
USA Ecommerce Market Industry Trends & Insights
The USA ecommerce market has experienced robust growth, with a Compound Annual Growth Rate (CAGR) of xx% during the historical period (2019-2024). This growth is propelled by several factors, including increasing internet and smartphone penetration, shifting consumer preferences towards online shopping, and the expansion of logistics and delivery infrastructure. Technological disruptions, such as the rise of mobile commerce, artificial intelligence, and big data analytics, are reshaping the industry landscape. Consumer preferences are evolving toward personalized experiences, faster delivery options, and enhanced customer service. Competitive dynamics are characterized by intense rivalry among major players and the emergence of niche players catering to specific customer segments. Market penetration has reached xx% in 2024, indicating significant growth potential.
Dominant Markets & Segments in USA Ecommerce Market
The USA ecommerce market is geographically diverse, with varying levels of penetration across different regions. However, major metropolitan areas and densely populated states generally exhibit higher market penetration due to greater internet access, higher disposable incomes, and established logistics networks. The dominance of specific segments within the market segmentation by application (which needs to be specified in the full report) is influenced by various factors.
- Key Drivers of Segment Dominance:
- Economic Policies: Government initiatives promoting digitalization and e-commerce contribute significantly.
- Infrastructure: Robust logistics networks and reliable internet connectivity are crucial for segment growth.
(Further detailed dominance analysis for each segment needs to be included in the full report based on the specified "Market Segmentation - by Application" data. This section should analyze which application segment is the largest and why using the bullet points and paragraphs as requested)
USA Ecommerce Market Product Developments
Recent product innovations in the USA ecommerce market focus on enhancing customer experience, improving operational efficiency, and expanding product offerings. Technological trends such as AI-powered recommendation engines, personalized marketing campaigns, and advanced logistics solutions are driving product development. The market fit for these innovations is largely positive, as they address growing consumer demand for convenience, personalization, and seamless shopping experiences. Companies are investing in technologies that streamline operations, reduce costs, and provide competitive advantages.
Report Scope & Segmentation Analysis
(This section needs to be populated with the details of the "Market Segmentation - by Application". Each segment needs a paragraph with growth projections, market size, and competitive dynamics according to the instructions). For example:
Segment 1: [Segment Name] - [Growth Projection], [Market Size 2025], [Competitive Dynamics].
Segment 2: [Segment Name] - [Growth Projection], [Market Size 2025], [Competitive Dynamics].
(Repeat for all segments in the Market Segmentation - by Application)
Key Drivers of USA Ecommerce Market Growth
The growth of the USA ecommerce market is fueled by several key factors. Technological advancements, such as the widespread adoption of smartphones and improved internet infrastructure, have significantly expanded market access. Favorable economic conditions, including rising disposable incomes and increased consumer spending, are creating greater demand for online shopping. Furthermore, supportive government policies and regulations that foster e-commerce growth play a vital role. The development of advanced logistics and delivery networks allows for faster and more reliable shipping.
Challenges in the USA Ecommerce Market Sector
The USA ecommerce market faces several challenges. Stricter regulatory hurdles related to data privacy and consumer protection add complexity for businesses. Supply chain disruptions, logistical bottlenecks, and increasing shipping costs impact profitability. Intense competition from both established players and new entrants necessitates continuous innovation and adaptation. Cybersecurity threats and the need for robust data security measures are crucial concerns. These factors can impact the overall growth of the sector.
Emerging Opportunities in USA Ecommerce Market
Several emerging trends present significant opportunities within the USA ecommerce market. The growing adoption of mobile commerce, the expansion of cross-border e-commerce, and the rise of social commerce offer significant potential for growth. The increasing demand for personalized shopping experiences and the integration of augmented reality and virtual reality technologies provide avenues for differentiation. The development of sustainable and ethical e-commerce practices aligns with growing consumer preferences.
Leading Players in the USA Ecommerce Market Market
Key Developments in USA Ecommerce Market Industry
- June 2020: Apple launched macOS Big Sur, watchOS 7, iOS 14, and iPadOS 14, enhancing the user experience and driving sales of Apple devices.
- March 2022: Walmart Inc. announced plans to hire over 5,000 tech associates, signaling investment in technology and e-commerce infrastructure.
- April 2022: Walmart partnered with Igloo to launch a "Made in the USA" cooler series, emphasizing domestic manufacturing and appealing to patriotic consumers.
- April 2022: Amazon announced a new solar park, showcasing its commitment to renewable energy and sustainability, potentially enhancing its brand image and attracting environmentally conscious consumers.
- April 2022: Apple started offering self-service repair parts for iPhones, improving customer satisfaction and potentially reducing repair costs.
- May 2022: Home Depot launched Home Depot Ventures, a $150 Million venture capital fund investing in early-stage startups focusing on home improvement and customer experience, potentially leading to innovation within the home improvement e-commerce sector.
Strategic Outlook for USA Ecommerce Market Market
The USA ecommerce market is poised for continued growth, driven by technological advancements, evolving consumer preferences, and increasing investment in infrastructure. The market presents significant opportunities for businesses to innovate, expand their market reach, and enhance their customer experiences. Further growth will be shaped by the adoption of new technologies, the expansion of omnichannel strategies, and the focus on personalized and sustainable practices. The focus on enhancing logistics and delivery efficiency will remain crucial to meeting consumer expectations.
USA Ecommerce Market Segmentation
-
1. B2C E-commerce
- 1.1. Market size (GMV) for the period of 2022-2029
-
1.2. Market Segmentation - by Application
- 1.2.1. Beauty & Personal Care
- 1.2.2. Consumer Electronics
- 1.2.3. Fashion & Apparel
- 1.2.4. Food & Beverage
- 1.2.5. Furniture & Home
- 1.2.6. Others (Toys, DIY, Media, etc.)
- 2. Market size (GMV) for the period of 2022-2029
-
3. Application
- 3.1. Beauty & Personal Care
- 3.2. Consumer Electronics
- 3.3. Fashion & Apparel
- 3.4. Food & Beverage
- 3.5. Furniture & Home
- 3.6. Others (Toys, DIY, Media, etc.)
- 4. Beauty & Personal Care
- 5. Consumer Electronics
- 6. Fashion & Apparel
- 7. Food & Beverage
- 8. Furniture & Home
- 9. Others (Toys, DIY, Media, etc.)
-
10. B2B E-commerce
- 10.1. Market size for the period of 2022-2029
USA Ecommerce Market Segmentation By Geography
-
1. North America
- 1.1. United States
- 1.2. Canada
- 1.3. Mexico
-
2. South America
- 2.1. Brazil
- 2.2. Argentina
- 2.3. Rest of South America
-
3. Europe
- 3.1. United Kingdom
- 3.2. Germany
- 3.3. France
- 3.4. Italy
- 3.5. Spain
- 3.6. Russia
- 3.7. Benelux
- 3.8. Nordics
- 3.9. Rest of Europe
-
4. Middle East & Africa
- 4.1. Turkey
- 4.2. Israel
- 4.3. GCC
- 4.4. North Africa
- 4.5. South Africa
- 4.6. Rest of Middle East & Africa
-
5. Asia Pacific
- 5.1. China
- 5.2. India
- 5.3. Japan
- 5.4. South Korea
- 5.5. ASEAN
- 5.6. Oceania
- 5.7. Rest of Asia Pacific

USA Ecommerce Market REPORT HIGHLIGHTS
| Aspects | Details |
|---|---|
| Study Period | 2019-2033 |
| Base Year | 2024 |
| Estimated Year | 2025 |
| Forecast Period | 2025-2033 |
| Historical Period | 2019-2024 |
| Growth Rate | CAGR of 14.70% from 2019-2033 |
| Segmentation |
|
Table of Contents
- 1. Introduction
- 1.1. Research Scope
- 1.2. Market Segmentation
- 1.3. Research Methodology
- 1.4. Definitions and Assumptions
- 2. Executive Summary
- 2.1. Introduction
- 3. Market Dynamics
- 3.1. Introduction
- 3.2. Market Drivers
- 3.2.1 Growing Demand from Apparel and Footwear Industry.; Rising Adoption of technologies (IOT
- 3.2.2 ML); Penetration of Internet and Smartphone Usage
- 3.3. Market Restrains
- 3.3.1. Operational Compatibility Due to Growing Brand Value
- 3.4. Market Trends
- 3.4.1. Increasing adoption of technologies
- 4. Market Factor Analysis
- 4.1. Porters Five Forces
- 4.2. Supply/Value Chain
- 4.3. PESTEL analysis
- 4.4. Market Entropy
- 4.5. Patent/Trademark Analysis
- 5. Global USA Ecommerce Market Analysis, Insights and Forecast, 2019-2031
- 5.1. Market Analysis, Insights and Forecast - by B2C E-commerce
- 5.1.1. Market size (GMV) for the period of 2022-2029
- 5.1.2. Market Segmentation - by Application
- 5.1.2.1. Beauty & Personal Care
- 5.1.2.2. Consumer Electronics
- 5.1.2.3. Fashion & Apparel
- 5.1.2.4. Food & Beverage
- 5.1.2.5. Furniture & Home
- 5.1.2.6. Others (Toys, DIY, Media, etc.)
- 5.2. Market Analysis, Insights and Forecast - by Market size (GMV) for the period of 2022-2029
- 5.3. Market Analysis, Insights and Forecast - by Application
- 5.3.1. Beauty & Personal Care
- 5.3.2. Consumer Electronics
- 5.3.3. Fashion & Apparel
- 5.3.4. Food & Beverage
- 5.3.5. Furniture & Home
- 5.3.6. Others (Toys, DIY, Media, etc.)
- 5.4. Market Analysis, Insights and Forecast - by Beauty & Personal Care
- 5.5. Market Analysis, Insights and Forecast - by Consumer Electronics
- 5.6. Market Analysis, Insights and Forecast - by Fashion & Apparel
- 5.7. Market Analysis, Insights and Forecast - by Food & Beverage
- 5.8. Market Analysis, Insights and Forecast - by Furniture & Home
- 5.9. Market Analysis, Insights and Forecast - by Others (Toys, DIY, Media, etc.)
- 5.10. Market Analysis, Insights and Forecast - by B2B E-commerce
- 5.10.1. Market size for the period of 2022-2029
- 5.11. Market Analysis, Insights and Forecast - by Region
- 5.11.1. North America
- 5.11.2. South America
- 5.11.3. Europe
- 5.11.4. Middle East & Africa
- 5.11.5. Asia Pacific
- 5.1. Market Analysis, Insights and Forecast - by B2C E-commerce
- 6. North America USA Ecommerce Market Analysis, Insights and Forecast, 2019-2031
- 6.1. Market Analysis, Insights and Forecast - by B2C E-commerce
- 6.1.1. Market size (GMV) for the period of 2022-2029
- 6.1.2. Market Segmentation - by Application
- 6.1.2.1. Beauty & Personal Care
- 6.1.2.2. Consumer Electronics
- 6.1.2.3. Fashion & Apparel
- 6.1.2.4. Food & Beverage
- 6.1.2.5. Furniture & Home
- 6.1.2.6. Others (Toys, DIY, Media, etc.)
- 6.2. Market Analysis, Insights and Forecast - by Market size (GMV) for the period of 2022-2029
- 6.3. Market Analysis, Insights and Forecast - by Application
- 6.3.1. Beauty & Personal Care
- 6.3.2. Consumer Electronics
- 6.3.3. Fashion & Apparel
- 6.3.4. Food & Beverage
- 6.3.5. Furniture & Home
- 6.3.6. Others (Toys, DIY, Media, etc.)
- 6.4. Market Analysis, Insights and Forecast - by Beauty & Personal Care
- 6.5. Market Analysis, Insights and Forecast - by Consumer Electronics
- 6.6. Market Analysis, Insights and Forecast - by Fashion & Apparel
- 6.7. Market Analysis, Insights and Forecast - by Food & Beverage
- 6.8. Market Analysis, Insights and Forecast - by Furniture & Home
- 6.9. Market Analysis, Insights and Forecast - by Others (Toys, DIY, Media, etc.)
- 6.10. Market Analysis, Insights and Forecast - by B2B E-commerce
- 6.10.1. Market size for the period of 2022-2029
- 6.1. Market Analysis, Insights and Forecast - by B2C E-commerce
- 7. South America USA Ecommerce Market Analysis, Insights and Forecast, 2019-2031
- 7.1. Market Analysis, Insights and Forecast - by B2C E-commerce
- 7.1.1. Market size (GMV) for the period of 2022-2029
- 7.1.2. Market Segmentation - by Application
- 7.1.2.1. Beauty & Personal Care
- 7.1.2.2. Consumer Electronics
- 7.1.2.3. Fashion & Apparel
- 7.1.2.4. Food & Beverage
- 7.1.2.5. Furniture & Home
- 7.1.2.6. Others (Toys, DIY, Media, etc.)
- 7.2. Market Analysis, Insights and Forecast - by Market size (GMV) for the period of 2022-2029
- 7.3. Market Analysis, Insights and Forecast - by Application
- 7.3.1. Beauty & Personal Care
- 7.3.2. Consumer Electronics
- 7.3.3. Fashion & Apparel
- 7.3.4. Food & Beverage
- 7.3.5. Furniture & Home
- 7.3.6. Others (Toys, DIY, Media, etc.)
- 7.4. Market Analysis, Insights and Forecast - by Beauty & Personal Care
- 7.5. Market Analysis, Insights and Forecast - by Consumer Electronics
- 7.6. Market Analysis, Insights and Forecast - by Fashion & Apparel
- 7.7. Market Analysis, Insights and Forecast - by Food & Beverage
- 7.8. Market Analysis, Insights and Forecast - by Furniture & Home
- 7.9. Market Analysis, Insights and Forecast - by Others (Toys, DIY, Media, etc.)
- 7.10. Market Analysis, Insights and Forecast - by B2B E-commerce
- 7.10.1. Market size for the period of 2022-2029
- 7.1. Market Analysis, Insights and Forecast - by B2C E-commerce
- 8. Europe USA Ecommerce Market Analysis, Insights and Forecast, 2019-2031
- 8.1. Market Analysis, Insights and Forecast - by B2C E-commerce
- 8.1.1. Market size (GMV) for the period of 2022-2029
- 8.1.2. Market Segmentation - by Application
- 8.1.2.1. Beauty & Personal Care
- 8.1.2.2. Consumer Electronics
- 8.1.2.3. Fashion & Apparel
- 8.1.2.4. Food & Beverage
- 8.1.2.5. Furniture & Home
- 8.1.2.6. Others (Toys, DIY, Media, etc.)
- 8.2. Market Analysis, Insights and Forecast - by Market size (GMV) for the period of 2022-2029
- 8.3. Market Analysis, Insights and Forecast - by Application
- 8.3.1. Beauty & Personal Care
- 8.3.2. Consumer Electronics
- 8.3.3. Fashion & Apparel
- 8.3.4. Food & Beverage
- 8.3.5. Furniture & Home
- 8.3.6. Others (Toys, DIY, Media, etc.)
- 8.4. Market Analysis, Insights and Forecast - by Beauty & Personal Care
- 8.5. Market Analysis, Insights and Forecast - by Consumer Electronics
- 8.6. Market Analysis, Insights and Forecast - by Fashion & Apparel
- 8.7. Market Analysis, Insights and Forecast - by Food & Beverage
- 8.8. Market Analysis, Insights and Forecast - by Furniture & Home
- 8.9. Market Analysis, Insights and Forecast - by Others (Toys, DIY, Media, etc.)
- 8.10. Market Analysis, Insights and Forecast - by B2B E-commerce
- 8.10.1. Market size for the period of 2022-2029
- 8.1. Market Analysis, Insights and Forecast - by B2C E-commerce
- 9. Middle East & Africa USA Ecommerce Market Analysis, Insights and Forecast, 2019-2031
- 9.1. Market Analysis, Insights and Forecast - by B2C E-commerce
- 9.1.1. Market size (GMV) for the period of 2022-2029
- 9.1.2. Market Segmentation - by Application
- 9.1.2.1. Beauty & Personal Care
- 9.1.2.2. Consumer Electronics
- 9.1.2.3. Fashion & Apparel
- 9.1.2.4. Food & Beverage
- 9.1.2.5. Furniture & Home
- 9.1.2.6. Others (Toys, DIY, Media, etc.)
- 9.2. Market Analysis, Insights and Forecast - by Market size (GMV) for the period of 2022-2029
- 9.3. Market Analysis, Insights and Forecast - by Application
- 9.3.1. Beauty & Personal Care
- 9.3.2. Consumer Electronics
- 9.3.3. Fashion & Apparel
- 9.3.4. Food & Beverage
- 9.3.5. Furniture & Home
- 9.3.6. Others (Toys, DIY, Media, etc.)
- 9.4. Market Analysis, Insights and Forecast - by Beauty & Personal Care
- 9.5. Market Analysis, Insights and Forecast - by Consumer Electronics
- 9.6. Market Analysis, Insights and Forecast - by Fashion & Apparel
- 9.7. Market Analysis, Insights and Forecast - by Food & Beverage
- 9.8. Market Analysis, Insights and Forecast - by Furniture & Home
- 9.9. Market Analysis, Insights and Forecast - by Others (Toys, DIY, Media, etc.)
- 9.10. Market Analysis, Insights and Forecast - by B2B E-commerce
- 9.10.1. Market size for the period of 2022-2029
- 9.1. Market Analysis, Insights and Forecast - by B2C E-commerce
- 10. Asia Pacific USA Ecommerce Market Analysis, Insights and Forecast, 2019-2031
- 10.1. Market Analysis, Insights and Forecast - by B2C E-commerce
- 10.1.1. Market size (GMV) for the period of 2022-2029
- 10.1.2. Market Segmentation - by Application
- 10.1.2.1. Beauty & Personal Care
- 10.1.2.2. Consumer Electronics
- 10.1.2.3. Fashion & Apparel
- 10.1.2.4. Food & Beverage
- 10.1.2.5. Furniture & Home
- 10.1.2.6. Others (Toys, DIY, Media, etc.)
- 10.2. Market Analysis, Insights and Forecast - by Market size (GMV) for the period of 2022-2029
- 10.3. Market Analysis, Insights and Forecast - by Application
- 10.3.1. Beauty & Personal Care
- 10.3.2. Consumer Electronics
- 10.3.3. Fashion & Apparel
- 10.3.4. Food & Beverage
- 10.3.5. Furniture & Home
- 10.3.6. Others (Toys, DIY, Media, etc.)
- 10.4. Market Analysis, Insights and Forecast - by Beauty & Personal Care
- 10.5. Market Analysis, Insights and Forecast - by Consumer Electronics
- 10.6. Market Analysis, Insights and Forecast - by Fashion & Apparel
- 10.7. Market Analysis, Insights and Forecast - by Food & Beverage
- 10.8. Market Analysis, Insights and Forecast - by Furniture & Home
- 10.9. Market Analysis, Insights and Forecast - by Others (Toys, DIY, Media, etc.)
- 10.10. Market Analysis, Insights and Forecast - by B2B E-commerce
- 10.10.1. Market size for the period of 2022-2029
- 10.1. Market Analysis, Insights and Forecast - by B2C E-commerce
- 11. Northeast USA Ecommerce Market Analysis, Insights and Forecast, 2019-2031
- 12. Southeast USA Ecommerce Market Analysis, Insights and Forecast, 2019-2031
- 13. Midwest USA Ecommerce Market Analysis, Insights and Forecast, 2019-2031
- 14. Southwest USA Ecommerce Market Analysis, Insights and Forecast, 2019-2031
- 15. West USA Ecommerce Market Analysis, Insights and Forecast, 2019-2031
- 16. Competitive Analysis
- 16.1. Global Market Share Analysis 2024
- 16.2. Company Profiles
- 16.2.1 Amazon
- 16.2.1.1. Overview
- 16.2.1.2. Products
- 16.2.1.3. SWOT Analysis
- 16.2.1.4. Recent Developments
- 16.2.1.5. Financials (Based on Availability)
- 16.2.2 Wayfair*List Not Exhaustive
- 16.2.2.1. Overview
- 16.2.2.2. Products
- 16.2.2.3. SWOT Analysis
- 16.2.2.4. Recent Developments
- 16.2.2.5. Financials (Based on Availability)
- 16.2.3 Zara
- 16.2.3.1. Overview
- 16.2.3.2. Products
- 16.2.3.3. SWOT Analysis
- 16.2.3.4. Recent Developments
- 16.2.3.5. Financials (Based on Availability)
- 16.2.4 Walmart
- 16.2.4.1. Overview
- 16.2.4.2. Products
- 16.2.4.3. SWOT Analysis
- 16.2.4.4. Recent Developments
- 16.2.4.5. Financials (Based on Availability)
- 16.2.5 Best Buy
- 16.2.5.1. Overview
- 16.2.5.2. Products
- 16.2.5.3. SWOT Analysis
- 16.2.5.4. Recent Developments
- 16.2.5.5. Financials (Based on Availability)
- 16.2.6 Home Depot
- 16.2.6.1. Overview
- 16.2.6.2. Products
- 16.2.6.3. SWOT Analysis
- 16.2.6.4. Recent Developments
- 16.2.6.5. Financials (Based on Availability)
- 16.2.7 Kroger
- 16.2.7.1. Overview
- 16.2.7.2. Products
- 16.2.7.3. SWOT Analysis
- 16.2.7.4. Recent Developments
- 16.2.7.5. Financials (Based on Availability)
- 16.2.8 Costco
- 16.2.8.1. Overview
- 16.2.8.2. Products
- 16.2.8.3. SWOT Analysis
- 16.2.8.4. Recent Developments
- 16.2.8.5. Financials (Based on Availability)
- 16.2.9 Target
- 16.2.9.1. Overview
- 16.2.9.2. Products
- 16.2.9.3. SWOT Analysis
- 16.2.9.4. Recent Developments
- 16.2.9.5. Financials (Based on Availability)
- 16.2.10 Apple
- 16.2.10.1. Overview
- 16.2.10.2. Products
- 16.2.10.3. SWOT Analysis
- 16.2.10.4. Recent Developments
- 16.2.10.5. Financials (Based on Availability)
- 16.2.1 Amazon
List of Figures
- Figure 1: Global USA Ecommerce Market Revenue Breakdown (Million, %) by Region 2024 & 2032
- Figure 2: United states USA Ecommerce Market Revenue (Million), by Country 2024 & 2032
- Figure 3: United states USA Ecommerce Market Revenue Share (%), by Country 2024 & 2032
- Figure 4: North America USA Ecommerce Market Revenue (Million), by B2C E-commerce 2024 & 2032
- Figure 5: North America USA Ecommerce Market Revenue Share (%), by B2C E-commerce 2024 & 2032
- Figure 6: North America USA Ecommerce Market Revenue (Million), by Market size (GMV) for the period of 2022-2029 2024 & 2032
- Figure 7: North America USA Ecommerce Market Revenue Share (%), by Market size (GMV) for the period of 2022-2029 2024 & 2032
- Figure 8: North America USA Ecommerce Market Revenue (Million), by Application 2024 & 2032
- Figure 9: North America USA Ecommerce Market Revenue Share (%), by Application 2024 & 2032
- Figure 10: North America USA Ecommerce Market Revenue (Million), by Beauty & Personal Care 2024 & 2032
- Figure 11: North America USA Ecommerce Market Revenue Share (%), by Beauty & Personal Care 2024 & 2032
- Figure 12: North America USA Ecommerce Market Revenue (Million), by Consumer Electronics 2024 & 2032
- Figure 13: North America USA Ecommerce Market Revenue Share (%), by Consumer Electronics 2024 & 2032
- Figure 14: North America USA Ecommerce Market Revenue (Million), by Fashion & Apparel 2024 & 2032
- Figure 15: North America USA Ecommerce Market Revenue Share (%), by Fashion & Apparel 2024 & 2032
- Figure 16: North America USA Ecommerce Market Revenue (Million), by Food & Beverage 2024 & 2032
- Figure 17: North America USA Ecommerce Market Revenue Share (%), by Food & Beverage 2024 & 2032
- Figure 18: North America USA Ecommerce Market Revenue (Million), by Furniture & Home 2024 & 2032
- Figure 19: North America USA Ecommerce Market Revenue Share (%), by Furniture & Home 2024 & 2032
- Figure 20: North America USA Ecommerce Market Revenue (Million), by Others (Toys, DIY, Media, etc.) 2024 & 2032
- Figure 21: North America USA Ecommerce Market Revenue Share (%), by Others (Toys, DIY, Media, etc.) 2024 & 2032
- Figure 22: North America USA Ecommerce Market Revenue (Million), by B2B E-commerce 2024 & 2032
- Figure 23: North America USA Ecommerce Market Revenue Share (%), by B2B E-commerce 2024 & 2032
- Figure 24: North America USA Ecommerce Market Revenue (Million), by Country 2024 & 2032
- Figure 25: North America USA Ecommerce Market Revenue Share (%), by Country 2024 & 2032
- Figure 26: South America USA Ecommerce Market Revenue (Million), by B2C E-commerce 2024 & 2032
- Figure 27: South America USA Ecommerce Market Revenue Share (%), by B2C E-commerce 2024 & 2032
- Figure 28: South America USA Ecommerce Market Revenue (Million), by Market size (GMV) for the period of 2022-2029 2024 & 2032
- Figure 29: South America USA Ecommerce Market Revenue Share (%), by Market size (GMV) for the period of 2022-2029 2024 & 2032
- Figure 30: South America USA Ecommerce Market Revenue (Million), by Application 2024 & 2032
- Figure 31: South America USA Ecommerce Market Revenue Share (%), by Application 2024 & 2032
- Figure 32: South America USA Ecommerce Market Revenue (Million), by Beauty & Personal Care 2024 & 2032
- Figure 33: South America USA Ecommerce Market Revenue Share (%), by Beauty & Personal Care 2024 & 2032
- Figure 34: South America USA Ecommerce Market Revenue (Million), by Consumer Electronics 2024 & 2032
- Figure 35: South America USA Ecommerce Market Revenue Share (%), by Consumer Electronics 2024 & 2032
- Figure 36: South America USA Ecommerce Market Revenue (Million), by Fashion & Apparel 2024 & 2032
- Figure 37: South America USA Ecommerce Market Revenue Share (%), by Fashion & Apparel 2024 & 2032
- Figure 38: South America USA Ecommerce Market Revenue (Million), by Food & Beverage 2024 & 2032
- Figure 39: South America USA Ecommerce Market Revenue Share (%), by Food & Beverage 2024 & 2032
- Figure 40: South America USA Ecommerce Market Revenue (Million), by Furniture & Home 2024 & 2032
- Figure 41: South America USA Ecommerce Market Revenue Share (%), by Furniture & Home 2024 & 2032
- Figure 42: South America USA Ecommerce Market Revenue (Million), by Others (Toys, DIY, Media, etc.) 2024 & 2032
- Figure 43: South America USA Ecommerce Market Revenue Share (%), by Others (Toys, DIY, Media, etc.) 2024 & 2032
- Figure 44: South America USA Ecommerce Market Revenue (Million), by B2B E-commerce 2024 & 2032
- Figure 45: South America USA Ecommerce Market Revenue Share (%), by B2B E-commerce 2024 & 2032
- Figure 46: South America USA Ecommerce Market Revenue (Million), by Country 2024 & 2032
- Figure 47: South America USA Ecommerce Market Revenue Share (%), by Country 2024 & 2032
- Figure 48: Europe USA Ecommerce Market Revenue (Million), by B2C E-commerce 2024 & 2032
- Figure 49: Europe USA Ecommerce Market Revenue Share (%), by B2C E-commerce 2024 & 2032
- Figure 50: Europe USA Ecommerce Market Revenue (Million), by Market size (GMV) for the period of 2022-2029 2024 & 2032
- Figure 51: Europe USA Ecommerce Market Revenue Share (%), by Market size (GMV) for the period of 2022-2029 2024 & 2032
- Figure 52: Europe USA Ecommerce Market Revenue (Million), by Application 2024 & 2032
- Figure 53: Europe USA Ecommerce Market Revenue Share (%), by Application 2024 & 2032
- Figure 54: Europe USA Ecommerce Market Revenue (Million), by Beauty & Personal Care 2024 & 2032
- Figure 55: Europe USA Ecommerce Market Revenue Share (%), by Beauty & Personal Care 2024 & 2032
- Figure 56: Europe USA Ecommerce Market Revenue (Million), by Consumer Electronics 2024 & 2032
- Figure 57: Europe USA Ecommerce Market Revenue Share (%), by Consumer Electronics 2024 & 2032
- Figure 58: Europe USA Ecommerce Market Revenue (Million), by Fashion & Apparel 2024 & 2032
- Figure 59: Europe USA Ecommerce Market Revenue Share (%), by Fashion & Apparel 2024 & 2032
- Figure 60: Europe USA Ecommerce Market Revenue (Million), by Food & Beverage 2024 & 2032
- Figure 61: Europe USA Ecommerce Market Revenue Share (%), by Food & Beverage 2024 & 2032
- Figure 62: Europe USA Ecommerce Market Revenue (Million), by Furniture & Home 2024 & 2032
- Figure 63: Europe USA Ecommerce Market Revenue Share (%), by Furniture & Home 2024 & 2032
- Figure 64: Europe USA Ecommerce Market Revenue (Million), by Others (Toys, DIY, Media, etc.) 2024 & 2032
- Figure 65: Europe USA Ecommerce Market Revenue Share (%), by Others (Toys, DIY, Media, etc.) 2024 & 2032
- Figure 66: Europe USA Ecommerce Market Revenue (Million), by B2B E-commerce 2024 & 2032
- Figure 67: Europe USA Ecommerce Market Revenue Share (%), by B2B E-commerce 2024 & 2032
- Figure 68: Europe USA Ecommerce Market Revenue (Million), by Country 2024 & 2032
- Figure 69: Europe USA Ecommerce Market Revenue Share (%), by Country 2024 & 2032
- Figure 70: Middle East & Africa USA Ecommerce Market Revenue (Million), by B2C E-commerce 2024 & 2032
- Figure 71: Middle East & Africa USA Ecommerce Market Revenue Share (%), by B2C E-commerce 2024 & 2032
- Figure 72: Middle East & Africa USA Ecommerce Market Revenue (Million), by Market size (GMV) for the period of 2022-2029 2024 & 2032
- Figure 73: Middle East & Africa USA Ecommerce Market Revenue Share (%), by Market size (GMV) for the period of 2022-2029 2024 & 2032
- Figure 74: Middle East & Africa USA Ecommerce Market Revenue (Million), by Application 2024 & 2032
- Figure 75: Middle East & Africa USA Ecommerce Market Revenue Share (%), by Application 2024 & 2032
- Figure 76: Middle East & Africa USA Ecommerce Market Revenue (Million), by Beauty & Personal Care 2024 & 2032
- Figure 77: Middle East & Africa USA Ecommerce Market Revenue Share (%), by Beauty & Personal Care 2024 & 2032
- Figure 78: Middle East & Africa USA Ecommerce Market Revenue (Million), by Consumer Electronics 2024 & 2032
- Figure 79: Middle East & Africa USA Ecommerce Market Revenue Share (%), by Consumer Electronics 2024 & 2032
- Figure 80: Middle East & Africa USA Ecommerce Market Revenue (Million), by Fashion & Apparel 2024 & 2032
- Figure 81: Middle East & Africa USA Ecommerce Market Revenue Share (%), by Fashion & Apparel 2024 & 2032
- Figure 82: Middle East & Africa USA Ecommerce Market Revenue (Million), by Food & Beverage 2024 & 2032
- Figure 83: Middle East & Africa USA Ecommerce Market Revenue Share (%), by Food & Beverage 2024 & 2032
- Figure 84: Middle East & Africa USA Ecommerce Market Revenue (Million), by Furniture & Home 2024 & 2032
- Figure 85: Middle East & Africa USA Ecommerce Market Revenue Share (%), by Furniture & Home 2024 & 2032
- Figure 86: Middle East & Africa USA Ecommerce Market Revenue (Million), by Others (Toys, DIY, Media, etc.) 2024 & 2032
- Figure 87: Middle East & Africa USA Ecommerce Market Revenue Share (%), by Others (Toys, DIY, Media, etc.) 2024 & 2032
- Figure 88: Middle East & Africa USA Ecommerce Market Revenue (Million), by B2B E-commerce 2024 & 2032
- Figure 89: Middle East & Africa USA Ecommerce Market Revenue Share (%), by B2B E-commerce 2024 & 2032
- Figure 90: Middle East & Africa USA Ecommerce Market Revenue (Million), by Country 2024 & 2032
- Figure 91: Middle East & Africa USA Ecommerce Market Revenue Share (%), by Country 2024 & 2032
- Figure 92: Asia Pacific USA Ecommerce Market Revenue (Million), by B2C E-commerce 2024 & 2032
- Figure 93: Asia Pacific USA Ecommerce Market Revenue Share (%), by B2C E-commerce 2024 & 2032
- Figure 94: Asia Pacific USA Ecommerce Market Revenue (Million), by Market size (GMV) for the period of 2022-2029 2024 & 2032
- Figure 95: Asia Pacific USA Ecommerce Market Revenue Share (%), by Market size (GMV) for the period of 2022-2029 2024 & 2032
- Figure 96: Asia Pacific USA Ecommerce Market Revenue (Million), by Application 2024 & 2032
- Figure 97: Asia Pacific USA Ecommerce Market Revenue Share (%), by Application 2024 & 2032
- Figure 98: Asia Pacific USA Ecommerce Market Revenue (Million), by Beauty & Personal Care 2024 & 2032
- Figure 99: Asia Pacific USA Ecommerce Market Revenue Share (%), by Beauty & Personal Care 2024 & 2032
- Figure 100: Asia Pacific USA Ecommerce Market Revenue (Million), by Consumer Electronics 2024 & 2032
- Figure 101: Asia Pacific USA Ecommerce Market Revenue Share (%), by Consumer Electronics 2024 & 2032
- Figure 102: Asia Pacific USA Ecommerce Market Revenue (Million), by Fashion & Apparel 2024 & 2032
- Figure 103: Asia Pacific USA Ecommerce Market Revenue Share (%), by Fashion & Apparel 2024 & 2032
- Figure 104: Asia Pacific USA Ecommerce Market Revenue (Million), by Food & Beverage 2024 & 2032
- Figure 105: Asia Pacific USA Ecommerce Market Revenue Share (%), by Food & Beverage 2024 & 2032
- Figure 106: Asia Pacific USA Ecommerce Market Revenue (Million), by Furniture & Home 2024 & 2032
- Figure 107: Asia Pacific USA Ecommerce Market Revenue Share (%), by Furniture & Home 2024 & 2032
- Figure 108: Asia Pacific USA Ecommerce Market Revenue (Million), by Others (Toys, DIY, Media, etc.) 2024 & 2032
- Figure 109: Asia Pacific USA Ecommerce Market Revenue Share (%), by Others (Toys, DIY, Media, etc.) 2024 & 2032
- Figure 110: Asia Pacific USA Ecommerce Market Revenue (Million), by B2B E-commerce 2024 & 2032
- Figure 111: Asia Pacific USA Ecommerce Market Revenue Share (%), by B2B E-commerce 2024 & 2032
- Figure 112: Asia Pacific USA Ecommerce Market Revenue (Million), by Country 2024 & 2032
- Figure 113: Asia Pacific USA Ecommerce Market Revenue Share (%), by Country 2024 & 2032
List of Tables
- Table 1: Global USA Ecommerce Market Revenue Million Forecast, by Region 2019 & 2032
- Table 2: Global USA Ecommerce Market Revenue Million Forecast, by B2C E-commerce 2019 & 2032
- Table 3: Global USA Ecommerce Market Revenue Million Forecast, by Market size (GMV) for the period of 2022-2029 2019 & 2032
- Table 4: Global USA Ecommerce Market Revenue Million Forecast, by Application 2019 & 2032
- Table 5: Global USA Ecommerce Market Revenue Million Forecast, by Beauty & Personal Care 2019 & 2032
- Table 6: Global USA Ecommerce Market Revenue Million Forecast, by Consumer Electronics 2019 & 2032
- Table 7: Global USA Ecommerce Market Revenue Million Forecast, by Fashion & Apparel 2019 & 2032
- Table 8: Global USA Ecommerce Market Revenue Million Forecast, by Food & Beverage 2019 & 2032
- Table 9: Global USA Ecommerce Market Revenue Million Forecast, by Furniture & Home 2019 & 2032
- Table 10: Global USA Ecommerce Market Revenue Million Forecast, by Others (Toys, DIY, Media, etc.) 2019 & 2032
- Table 11: Global USA Ecommerce Market Revenue Million Forecast, by B2B E-commerce 2019 & 2032
- Table 12: Global USA Ecommerce Market Revenue Million Forecast, by Region 2019 & 2032
- Table 13: Global USA Ecommerce Market Revenue Million Forecast, by Country 2019 & 2032
- Table 14: Northeast USA Ecommerce Market Revenue (Million) Forecast, by Application 2019 & 2032
- Table 15: Southeast USA Ecommerce Market Revenue (Million) Forecast, by Application 2019 & 2032
- Table 16: Midwest USA Ecommerce Market Revenue (Million) Forecast, by Application 2019 & 2032
- Table 17: Southwest USA Ecommerce Market Revenue (Million) Forecast, by Application 2019 & 2032
- Table 18: West USA Ecommerce Market Revenue (Million) Forecast, by Application 2019 & 2032
- Table 19: Global USA Ecommerce Market Revenue Million Forecast, by B2C E-commerce 2019 & 2032
- Table 20: Global USA Ecommerce Market Revenue Million Forecast, by Market size (GMV) for the period of 2022-2029 2019 & 2032
- Table 21: Global USA Ecommerce Market Revenue Million Forecast, by Application 2019 & 2032
- Table 22: Global USA Ecommerce Market Revenue Million Forecast, by Beauty & Personal Care 2019 & 2032
- Table 23: Global USA Ecommerce Market Revenue Million Forecast, by Consumer Electronics 2019 & 2032
- Table 24: Global USA Ecommerce Market Revenue Million Forecast, by Fashion & Apparel 2019 & 2032
- Table 25: Global USA Ecommerce Market Revenue Million Forecast, by Food & Beverage 2019 & 2032
- Table 26: Global USA Ecommerce Market Revenue Million Forecast, by Furniture & Home 2019 & 2032
- Table 27: Global USA Ecommerce Market Revenue Million Forecast, by Others (Toys, DIY, Media, etc.) 2019 & 2032
- Table 28: Global USA Ecommerce Market Revenue Million Forecast, by B2B E-commerce 2019 & 2032
- Table 29: Global USA Ecommerce Market Revenue Million Forecast, by Country 2019 & 2032
- Table 30: United States USA Ecommerce Market Revenue (Million) Forecast, by Application 2019 & 2032
- Table 31: Canada USA Ecommerce Market Revenue (Million) Forecast, by Application 2019 & 2032
- Table 32: Mexico USA Ecommerce Market Revenue (Million) Forecast, by Application 2019 & 2032
- Table 33: Global USA Ecommerce Market Revenue Million Forecast, by B2C E-commerce 2019 & 2032
- Table 34: Global USA Ecommerce Market Revenue Million Forecast, by Market size (GMV) for the period of 2022-2029 2019 & 2032
- Table 35: Global USA Ecommerce Market Revenue Million Forecast, by Application 2019 & 2032
- Table 36: Global USA Ecommerce Market Revenue Million Forecast, by Beauty & Personal Care 2019 & 2032
- Table 37: Global USA Ecommerce Market Revenue Million Forecast, by Consumer Electronics 2019 & 2032
- Table 38: Global USA Ecommerce Market Revenue Million Forecast, by Fashion & Apparel 2019 & 2032
- Table 39: Global USA Ecommerce Market Revenue Million Forecast, by Food & Beverage 2019 & 2032
- Table 40: Global USA Ecommerce Market Revenue Million Forecast, by Furniture & Home 2019 & 2032
- Table 41: Global USA Ecommerce Market Revenue Million Forecast, by Others (Toys, DIY, Media, etc.) 2019 & 2032
- Table 42: Global USA Ecommerce Market Revenue Million Forecast, by B2B E-commerce 2019 & 2032
- Table 43: Global USA Ecommerce Market Revenue Million Forecast, by Country 2019 & 2032
- Table 44: Brazil USA Ecommerce Market Revenue (Million) Forecast, by Application 2019 & 2032
- Table 45: Argentina USA Ecommerce Market Revenue (Million) Forecast, by Application 2019 & 2032
- Table 46: Rest of South America USA Ecommerce Market Revenue (Million) Forecast, by Application 2019 & 2032
- Table 47: Global USA Ecommerce Market Revenue Million Forecast, by B2C E-commerce 2019 & 2032
- Table 48: Global USA Ecommerce Market Revenue Million Forecast, by Market size (GMV) for the period of 2022-2029 2019 & 2032
- Table 49: Global USA Ecommerce Market Revenue Million Forecast, by Application 2019 & 2032
- Table 50: Global USA Ecommerce Market Revenue Million Forecast, by Beauty & Personal Care 2019 & 2032
- Table 51: Global USA Ecommerce Market Revenue Million Forecast, by Consumer Electronics 2019 & 2032
- Table 52: Global USA Ecommerce Market Revenue Million Forecast, by Fashion & Apparel 2019 & 2032
- Table 53: Global USA Ecommerce Market Revenue Million Forecast, by Food & Beverage 2019 & 2032
- Table 54: Global USA Ecommerce Market Revenue Million Forecast, by Furniture & Home 2019 & 2032
- Table 55: Global USA Ecommerce Market Revenue Million Forecast, by Others (Toys, DIY, Media, etc.) 2019 & 2032
- Table 56: Global USA Ecommerce Market Revenue Million Forecast, by B2B E-commerce 2019 & 2032
- Table 57: Global USA Ecommerce Market Revenue Million Forecast, by Country 2019 & 2032
- Table 58: United Kingdom USA Ecommerce Market Revenue (Million) Forecast, by Application 2019 & 2032
- Table 59: Germany USA Ecommerce Market Revenue (Million) Forecast, by Application 2019 & 2032
- Table 60: France USA Ecommerce Market Revenue (Million) Forecast, by Application 2019 & 2032
- Table 61: Italy USA Ecommerce Market Revenue (Million) Forecast, by Application 2019 & 2032
- Table 62: Spain USA Ecommerce Market Revenue (Million) Forecast, by Application 2019 & 2032
- Table 63: Russia USA Ecommerce Market Revenue (Million) Forecast, by Application 2019 & 2032
- Table 64: Benelux USA Ecommerce Market Revenue (Million) Forecast, by Application 2019 & 2032
- Table 65: Nordics USA Ecommerce Market Revenue (Million) Forecast, by Application 2019 & 2032
- Table 66: Rest of Europe USA Ecommerce Market Revenue (Million) Forecast, by Application 2019 & 2032
- Table 67: Global USA Ecommerce Market Revenue Million Forecast, by B2C E-commerce 2019 & 2032
- Table 68: Global USA Ecommerce Market Revenue Million Forecast, by Market size (GMV) for the period of 2022-2029 2019 & 2032
- Table 69: Global USA Ecommerce Market Revenue Million Forecast, by Application 2019 & 2032
- Table 70: Global USA Ecommerce Market Revenue Million Forecast, by Beauty & Personal Care 2019 & 2032
- Table 71: Global USA Ecommerce Market Revenue Million Forecast, by Consumer Electronics 2019 & 2032
- Table 72: Global USA Ecommerce Market Revenue Million Forecast, by Fashion & Apparel 2019 & 2032
- Table 73: Global USA Ecommerce Market Revenue Million Forecast, by Food & Beverage 2019 & 2032
- Table 74: Global USA Ecommerce Market Revenue Million Forecast, by Furniture & Home 2019 & 2032
- Table 75: Global USA Ecommerce Market Revenue Million Forecast, by Others (Toys, DIY, Media, etc.) 2019 & 2032
- Table 76: Global USA Ecommerce Market Revenue Million Forecast, by B2B E-commerce 2019 & 2032
- Table 77: Global USA Ecommerce Market Revenue Million Forecast, by Country 2019 & 2032
- Table 78: Turkey USA Ecommerce Market Revenue (Million) Forecast, by Application 2019 & 2032
- Table 79: Israel USA Ecommerce Market Revenue (Million) Forecast, by Application 2019 & 2032
- Table 80: GCC USA Ecommerce Market Revenue (Million) Forecast, by Application 2019 & 2032
- Table 81: North Africa USA Ecommerce Market Revenue (Million) Forecast, by Application 2019 & 2032
- Table 82: South Africa USA Ecommerce Market Revenue (Million) Forecast, by Application 2019 & 2032
- Table 83: Rest of Middle East & Africa USA Ecommerce Market Revenue (Million) Forecast, by Application 2019 & 2032
- Table 84: Global USA Ecommerce Market Revenue Million Forecast, by B2C E-commerce 2019 & 2032
- Table 85: Global USA Ecommerce Market Revenue Million Forecast, by Market size (GMV) for the period of 2022-2029 2019 & 2032
- Table 86: Global USA Ecommerce Market Revenue Million Forecast, by Application 2019 & 2032
- Table 87: Global USA Ecommerce Market Revenue Million Forecast, by Beauty & Personal Care 2019 & 2032
- Table 88: Global USA Ecommerce Market Revenue Million Forecast, by Consumer Electronics 2019 & 2032
- Table 89: Global USA Ecommerce Market Revenue Million Forecast, by Fashion & Apparel 2019 & 2032
- Table 90: Global USA Ecommerce Market Revenue Million Forecast, by Food & Beverage 2019 & 2032
- Table 91: Global USA Ecommerce Market Revenue Million Forecast, by Furniture & Home 2019 & 2032
- Table 92: Global USA Ecommerce Market Revenue Million Forecast, by Others (Toys, DIY, Media, etc.) 2019 & 2032
- Table 93: Global USA Ecommerce Market Revenue Million Forecast, by B2B E-commerce 2019 & 2032
- Table 94: Global USA Ecommerce Market Revenue Million Forecast, by Country 2019 & 2032
- Table 95: China USA Ecommerce Market Revenue (Million) Forecast, by Application 2019 & 2032
- Table 96: India USA Ecommerce Market Revenue (Million) Forecast, by Application 2019 & 2032
- Table 97: Japan USA Ecommerce Market Revenue (Million) Forecast, by Application 2019 & 2032
- Table 98: South Korea USA Ecommerce Market Revenue (Million) Forecast, by Application 2019 & 2032
- Table 99: ASEAN USA Ecommerce Market Revenue (Million) Forecast, by Application 2019 & 2032
- Table 100: Oceania USA Ecommerce Market Revenue (Million) Forecast, by Application 2019 & 2032
- Table 101: Rest of Asia Pacific USA Ecommerce Market Revenue (Million) Forecast, by Application 2019 & 2032
Frequently Asked Questions
1. What is the projected Compound Annual Growth Rate (CAGR) of the USA Ecommerce Market?
The projected CAGR is approximately 14.70%.
2. Which companies are prominent players in the USA Ecommerce Market?
Key companies in the market include Amazon, Wayfair*List Not Exhaustive, Zara, Walmart, Best Buy, Home Depot, Kroger, Costco, Target, Apple.
3. What are the main segments of the USA Ecommerce Market?
The market segments include B2C E-commerce, Market size (GMV) for the period of 2022-2029, Application, Beauty & Personal Care, Consumer Electronics, Fashion & Apparel, Food & Beverage, Furniture & Home, Others (Toys, DIY, Media, etc.), B2B E-commerce.
4. Can you provide details about the market size?
The market size is estimated to be USD XX Million as of 2022.
5. What are some drivers contributing to market growth?
Growing Demand from Apparel and Footwear Industry.; Rising Adoption of technologies (IOT. ML); Penetration of Internet and Smartphone Usage.
6. What are the notable trends driving market growth?
Increasing adoption of technologies.
7. Are there any restraints impacting market growth?
Operational Compatibility Due to Growing Brand Value.
8. Can you provide examples of recent developments in the market?
May 2022- Home Depot announced the formation of Home Depot Ventures, a venture capital fund to promote early-stage startups that improve customer experience and home renovation. Furthermore, the $150 million funds will evaluate investments in businesses at various stages of development, emphasizing early and growth-stage startups that assist Home Depot customers and can scale.
9. What pricing options are available for accessing the report?
Pricing options include single-user, multi-user, and enterprise licenses priced at USD 3800, USD 4500, and USD 5800 respectively.
10. Is the market size provided in terms of value or volume?
The market size is provided in terms of value, measured in Million.
11. Are there any specific market keywords associated with the report?
Yes, the market keyword associated with the report is "USA Ecommerce Market," which aids in identifying and referencing the specific market segment covered.
12. How do I determine which pricing option suits my needs best?
The pricing options vary based on user requirements and access needs. Individual users may opt for single-user licenses, while businesses requiring broader access may choose multi-user or enterprise licenses for cost-effective access to the report.
13. Are there any additional resources or data provided in the USA Ecommerce Market report?
While the report offers comprehensive insights, it's advisable to review the specific contents or supplementary materials provided to ascertain if additional resources or data are available.
14. How can I stay updated on further developments or reports in the USA Ecommerce Market?
To stay informed about further developments, trends, and reports in the USA Ecommerce Market, consider subscribing to industry newsletters, following relevant companies and organizations, or regularly checking reputable industry news sources and publications.
Methodology
Step 1 - Identification of Relevant Samples Size from Population Database


Step 2 - Approaches for Defining Global Market Size (Value, Volume* & Price*)

Note*: In applicable scenarios
Step 3 - Data Sources
Primary Research
- Web Analytics
- Survey Reports
- Research Institute
- Latest Research Reports
- Opinion Leaders
Secondary Research
- Annual Reports
- White Paper
- Latest Press Release
- Industry Association
- Paid Database
- Investor Presentations

Step 4 - Data Triangulation
Involves using different sources of information in order to increase the validity of a study
These sources are likely to be stakeholders in a program - participants, other researchers, program staff, other community members, and so on.
Then we put all data in single framework & apply various statistical tools to find out the dynamic on the market.
During the analysis stage, feedback from the stakeholder groups would be compared to determine areas of agreement as well as areas of divergence


