
Key Insights
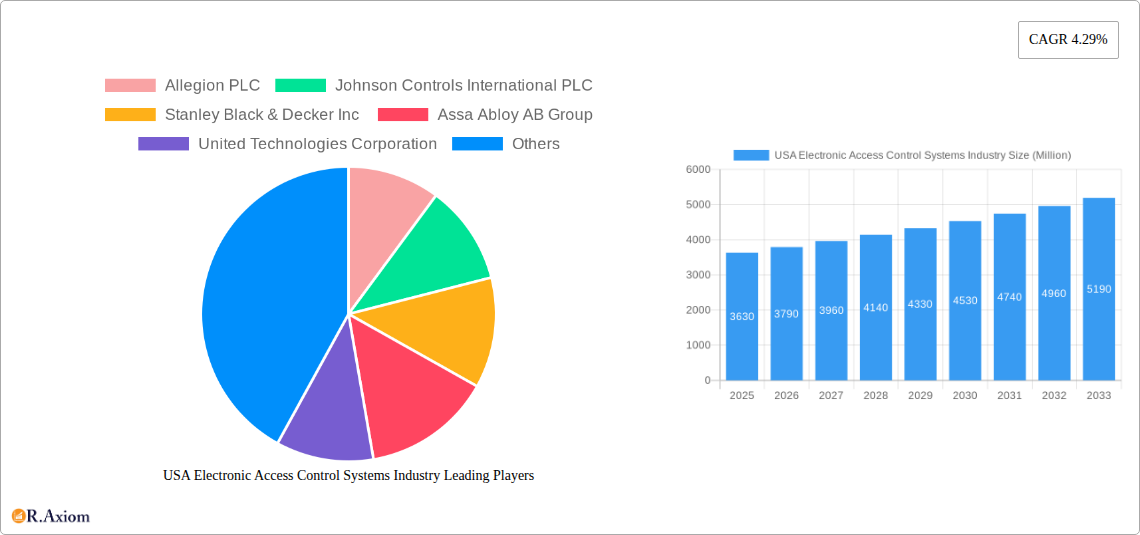
The U.S. electronic access control systems market, valued at approximately $3.63 billion in 2025, is projected to experience robust growth, driven by increasing security concerns across commercial, residential, and government sectors. The market's Compound Annual Growth Rate (CAGR) of 4.29% from 2019 to 2024 suggests a continued upward trajectory through 2033. Key drivers include the rising adoption of smart building technologies, the increasing demand for advanced security features like biometric authentication and cloud-based access management, and the growing need for efficient and streamlined access control in various industries. Trends such as the integration of IoT devices, the rise of mobile access credentials, and the increasing sophistication of cybersecurity measures are shaping the market's evolution. While potential restraints such as high initial investment costs and the complexity of integrating systems across diverse environments exist, the overall market outlook remains positive, fueled by technological advancements and a growing awareness of security vulnerabilities. The market segmentation, encompassing hardware, software, and services across various end-user sectors like commercial, residential, government, healthcare, and transportation, reflects the diverse applications and opportunities within this expanding industry. The competitive landscape is characterized by established players like Allegion PLC, Johnson Controls, and Assa Abloy, constantly innovating to maintain their market share.
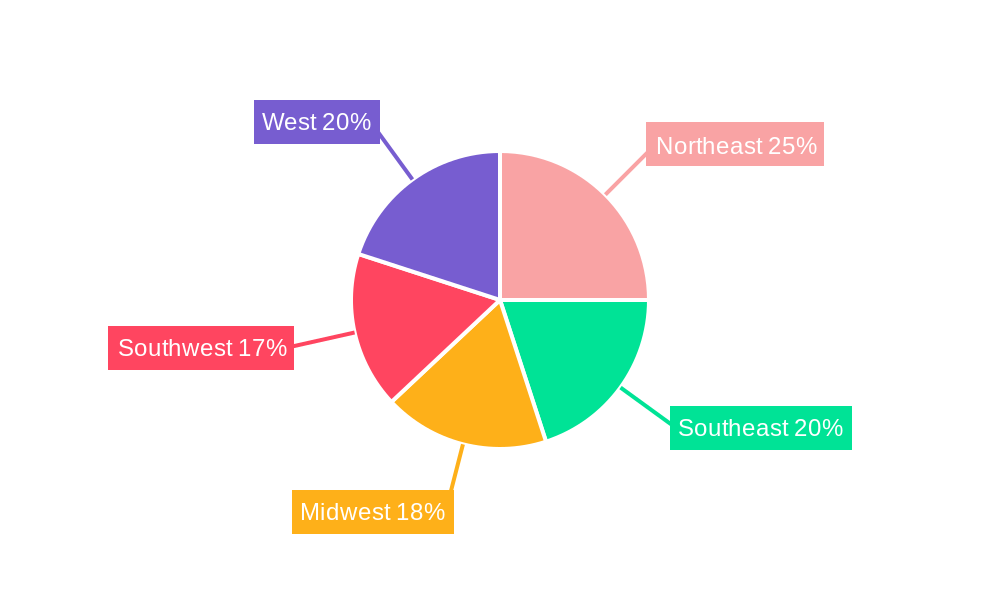
The regional breakdown within the U.S. market, including Northeast, Southeast, Midwest, Southwest, and West regions, shows variations in growth rates based on factors like population density, economic activity, and industry concentration. The Northeast and West Coast regions, with their high concentration of commercial and technological hubs, are likely to exhibit faster growth compared to other regions. The ongoing technological advancements in areas like artificial intelligence (AI) and machine learning (ML) integrated within access control systems will further accelerate market expansion, creating opportunities for both established players and new entrants in the coming years. The increasing focus on cybersecurity and data privacy regulations will also play a significant role in shaping the market's future trajectory, driving demand for robust and secure access control solutions.
This comprehensive report provides an in-depth analysis of the USA Electronic Access Control Systems industry, covering market size, growth drivers, competitive landscape, and future trends from 2019 to 2033. The study period is 2019-2033, with 2025 as the base and estimated year. The forecast period is 2025-2033, and the historical period is 2019-2024. This report is crucial for industry stakeholders, investors, and businesses seeking to understand and capitalize on the opportunities within this dynamic market.
USA Electronic Access Control Systems Industry Market Concentration & Innovation
The USA electronic access control systems market exhibits moderate concentration, with key players like Allegion PLC, Johnson Controls International PLC, and Assa Abloy AB Group holding significant market share. The combined market share of the top five players is estimated at xx%. Innovation is driven by advancements in biometric technologies, cloud-based access management, and integration with IoT platforms. Stringent regulatory frameworks concerning data security and privacy influence market dynamics, pushing adoption of compliant solutions. Product substitutes, such as traditional key-based systems, are gradually being replaced due to enhanced security and efficiency offered by electronic systems. End-user trends show increasing demand for integrated security solutions encompassing access control, video surveillance, and intrusion detection. Mergers and acquisitions (M&A) activity is moderate, with deal values averaging xx Million in recent years, driven by strategic expansion and technological integration.
- Market Share: Top 5 players hold approximately xx% market share.
- M&A Activity: Average deal value: xx Million.
- Innovation Drivers: Biometrics, cloud-based systems, IoT integration.
- Regulatory Impact: Focus on data security and privacy.
USA Electronic Access Control Systems Industry Industry Trends & Insights
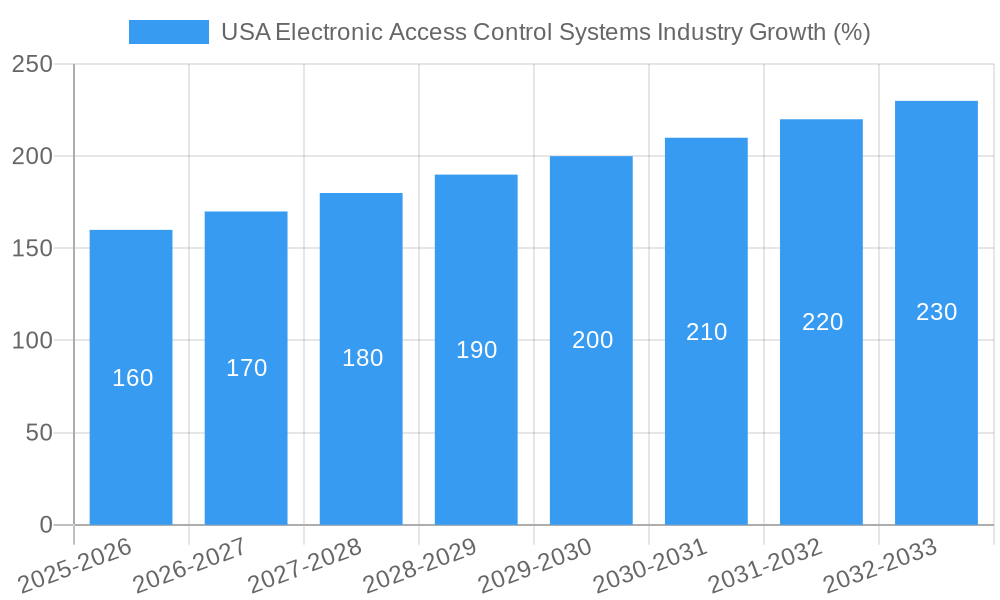
The USA electronic access control systems market is experiencing robust growth, with a projected CAGR of xx% during the forecast period (2025-2033). Key growth drivers include rising security concerns across various sectors, increasing adoption of smart building technologies, and government initiatives promoting security upgrades. Technological disruptions, such as the emergence of advanced biometrics and AI-powered security solutions, are reshaping the competitive landscape. Consumer preferences are shifting towards user-friendly, integrated systems that offer enhanced convenience and security. The market is characterized by intense competition, with established players and emerging companies vying for market share through product innovation and strategic partnerships. Market penetration of electronic access control systems is steadily rising, particularly in the commercial and government sectors. The increasing adoption of cloud-based solutions and managed services contributes to this growth.
Dominant Markets & Segments in USA Electronic Access Control Systems Industry
The commercial sector dominates the USA electronic access control systems market, driven by the large number of office buildings, retail spaces, and other commercial establishments. Government and industrial segments also represent significant market opportunities due to the need for robust security solutions.
By Type: The hardware segment holds the largest market share, driven by increasing demand for access control devices. Software and services segments are experiencing substantial growth due to the rising adoption of cloud-based solutions and managed services. Multi-technology readers are gaining popularity due to their flexibility and enhanced security features.
By End-User:
- Commercial: High market share due to the large number of commercial buildings requiring security systems. Key drivers include increased security concerns and the adoption of smart building technologies.
- Government: Significant growth potential due to government initiatives and the need for robust security in public spaces.
- Industrial: Growing demand driven by the need to secure critical infrastructure and sensitive data.
- Residential: Steady growth driven by increasing awareness of home security and rising disposable incomes.
- Transport and Logistics: Strong growth driven by the need to secure transportation networks and logistics facilities.
- Healthcare: Growing adoption of electronic access control to improve patient safety and data security.
- Military and Defense: Significant growth potential due to the need for advanced security solutions in military and defense establishments.
USA Electronic Access Control Systems Industry Product Developments
Recent product innovations include the integration of advanced biometrics, such as facial recognition and fingerprint scanning, into access control systems. Cloud-based solutions provide remote management and monitoring capabilities, enhancing efficiency and security. The integration of access control systems with other security technologies, such as video surveillance and intrusion detection, offers comprehensive security solutions. These developments improve security, streamline operations, and enhance user experience, leading to increased market acceptance.
Report Scope & Segmentation Analysis
This report segments the USA electronic access control systems market by type (hardware, software, services, multi-technology readers) and end-user (commercial, residential, government, industrial, transport and logistics, healthcare, military and defense). Growth projections vary across segments, with software and services experiencing faster growth than hardware due to the increasing adoption of cloud-based solutions. The commercial sector dominates in terms of market size, followed by government and industrial segments. Competitive dynamics are influenced by factors such as product innovation, pricing strategies, and brand reputation.
Key Drivers of USA Electronic Access Control Systems Industry Growth
Several factors drive market growth: increasing security concerns across various sectors, growing adoption of smart building technologies, government regulations promoting enhanced security measures, technological advancements such as biometric authentication and cloud-based systems, and the rising demand for integrated security solutions.
Challenges in the USA Electronic Access Control Systems Industry Sector
Challenges include high initial investment costs, concerns about data security and privacy, the complexity of integrating different systems, the need for skilled personnel for installation and maintenance, and competition from traditional key systems and other security solutions. Supply chain disruptions can also impact market growth. The overall impact of these challenges is estimated to reduce market growth by approximately xx% during the forecast period.
Emerging Opportunities in USA Electronic Access Control Systems Industry
Emerging opportunities include the growing adoption of mobile access solutions, the integration of AI-powered security features, the expansion into new markets such as smart homes and cities, and the rising demand for cybersecurity solutions to protect access control systems from cyber threats.
Leading Players in the USA Electronic Access Control Systems Industry Market
- Allegion PLC
- Johnson Controls International PLC
- Stanley Black & Decker Inc
- Assa Abloy AB Group
- United Technologies Corporation
- Honeywell Security Group
- Schneider Electric SE
- Bosch Security System Inc
- dormakaba Holding AG
- IDEMIA Identity & Security SAS
Key Developments in USA Electronic Access Control Systems Industry Industry
- Jan 2023: Allegion PLC launches a new cloud-based access control platform.
- May 2022: Johnson Controls International PLC acquires a smaller access control company, expanding its product portfolio.
- Oct 2021: Assa Abloy AB Group introduces a new biometric access control system. (Add more specific examples with dates as they become available)
Strategic Outlook for USA Electronic Access Control Systems Industry Market
The USA electronic access control systems market is poised for continued growth, driven by technological advancements, increasing security concerns, and rising demand from various sectors. Opportunities exist in expanding into new markets, developing innovative products, and strengthening partnerships to offer integrated security solutions. The market's future is bright, with potential for substantial growth over the next decade.
USA Electronic Access Control Systems Industry Segmentation
-
1. Type
- 1.1. Hardware
- 1.2. Software
- 1.3. Services
-
2. End User
- 2.1. Commercial
- 2.2. Residential
- 2.3. Government
- 2.4. Industrial
- 2.5. Transport and Logistics
- 2.6. Healthcare
- 2.7. Military and Defense
USA Electronic Access Control Systems Industry Segmentation By Geography
-
1. North America
- 1.1. United States
- 1.2. Canada
- 1.3. Mexico
-
2. South America
- 2.1. Brazil
- 2.2. Argentina
- 2.3. Rest of South America
-
3. Europe
- 3.1. United Kingdom
- 3.2. Germany
- 3.3. France
- 3.4. Italy
- 3.5. Spain
- 3.6. Russia
- 3.7. Benelux
- 3.8. Nordics
- 3.9. Rest of Europe
-
4. Middle East & Africa
- 4.1. Turkey
- 4.2. Israel
- 4.3. GCC
- 4.4. North Africa
- 4.5. South Africa
- 4.6. Rest of Middle East & Africa
-
5. Asia Pacific
- 5.1. China
- 5.2. India
- 5.3. Japan
- 5.4. South Korea
- 5.5. ASEAN
- 5.6. Oceania
- 5.7. Rest of Asia Pacific
USA Electronic Access Control Systems Industry REPORT HIGHLIGHTS
| Aspects | Details |
|---|---|
| Study Period | 2019-2033 |
| Base Year | 2024 |
| Estimated Year | 2025 |
| Forecast Period | 2025-2033 |
| Historical Period | 2019-2024 |
| Growth Rate | CAGR of 4.29% from 2019-2033 |
| Segmentation |
|
Table of Contents
- 1. Introduction
- 1.1. Research Scope
- 1.2. Market Segmentation
- 1.3. Research Methodology
- 1.4. Definitions and Assumptions
- 2. Executive Summary
- 2.1. Introduction
- 3. Market Dynamics
- 3.1. Introduction
- 3.2. Market Drivers
- 3.2.1. Increasing Safety and Security Concerns; Increasing Adoption of Smart Home Architecture
- 3.3. Market Restrains
- 3.3.1. High cost involved in replacing the existing Deep UV with EUV lasers; Monopoly existing within the market
- 3.4. Market Trends
- 3.4.1. The Healthcare Sector to Hold the Major Market Share
- 4. Market Factor Analysis
- 4.1. Porters Five Forces
- 4.2. Supply/Value Chain
- 4.3. PESTEL analysis
- 4.4. Market Entropy
- 4.5. Patent/Trademark Analysis
- 5. Global USA Electronic Access Control Systems Industry Analysis, Insights and Forecast, 2019-2031
- 5.1. Market Analysis, Insights and Forecast - by Type
- 5.1.1. Hardware
- 5.1.2. Software
- 5.1.3. Services
- 5.2. Market Analysis, Insights and Forecast - by End User
- 5.2.1. Commercial
- 5.2.2. Residential
- 5.2.3. Government
- 5.2.4. Industrial
- 5.2.5. Transport and Logistics
- 5.2.6. Healthcare
- 5.2.7. Military and Defense
- 5.3. Market Analysis, Insights and Forecast - by Region
- 5.3.1. North America
- 5.3.2. South America
- 5.3.3. Europe
- 5.3.4. Middle East & Africa
- 5.3.5. Asia Pacific
- 5.1. Market Analysis, Insights and Forecast - by Type
- 6. North America USA Electronic Access Control Systems Industry Analysis, Insights and Forecast, 2019-2031
- 6.1. Market Analysis, Insights and Forecast - by Type
- 6.1.1. Hardware
- 6.1.2. Software
- 6.1.3. Services
- 6.2. Market Analysis, Insights and Forecast - by End User
- 6.2.1. Commercial
- 6.2.2. Residential
- 6.2.3. Government
- 6.2.4. Industrial
- 6.2.5. Transport and Logistics
- 6.2.6. Healthcare
- 6.2.7. Military and Defense
- 6.1. Market Analysis, Insights and Forecast - by Type
- 7. South America USA Electronic Access Control Systems Industry Analysis, Insights and Forecast, 2019-2031
- 7.1. Market Analysis, Insights and Forecast - by Type
- 7.1.1. Hardware
- 7.1.2. Software
- 7.1.3. Services
- 7.2. Market Analysis, Insights and Forecast - by End User
- 7.2.1. Commercial
- 7.2.2. Residential
- 7.2.3. Government
- 7.2.4. Industrial
- 7.2.5. Transport and Logistics
- 7.2.6. Healthcare
- 7.2.7. Military and Defense
- 7.1. Market Analysis, Insights and Forecast - by Type
- 8. Europe USA Electronic Access Control Systems Industry Analysis, Insights and Forecast, 2019-2031
- 8.1. Market Analysis, Insights and Forecast - by Type
- 8.1.1. Hardware
- 8.1.2. Software
- 8.1.3. Services
- 8.2. Market Analysis, Insights and Forecast - by End User
- 8.2.1. Commercial
- 8.2.2. Residential
- 8.2.3. Government
- 8.2.4. Industrial
- 8.2.5. Transport and Logistics
- 8.2.6. Healthcare
- 8.2.7. Military and Defense
- 8.1. Market Analysis, Insights and Forecast - by Type
- 9. Middle East & Africa USA Electronic Access Control Systems Industry Analysis, Insights and Forecast, 2019-2031
- 9.1. Market Analysis, Insights and Forecast - by Type
- 9.1.1. Hardware
- 9.1.2. Software
- 9.1.3. Services
- 9.2. Market Analysis, Insights and Forecast - by End User
- 9.2.1. Commercial
- 9.2.2. Residential
- 9.2.3. Government
- 9.2.4. Industrial
- 9.2.5. Transport and Logistics
- 9.2.6. Healthcare
- 9.2.7. Military and Defense
- 9.1. Market Analysis, Insights and Forecast - by Type
- 10. Asia Pacific USA Electronic Access Control Systems Industry Analysis, Insights and Forecast, 2019-2031
- 10.1. Market Analysis, Insights and Forecast - by Type
- 10.1.1. Hardware
- 10.1.2. Software
- 10.1.3. Services
- 10.2. Market Analysis, Insights and Forecast - by End User
- 10.2.1. Commercial
- 10.2.2. Residential
- 10.2.3. Government
- 10.2.4. Industrial
- 10.2.5. Transport and Logistics
- 10.2.6. Healthcare
- 10.2.7. Military and Defense
- 10.1. Market Analysis, Insights and Forecast - by Type
- 11. Northeast USA Electronic Access Control Systems Industry Analysis, Insights and Forecast, 2019-2031
- 12. Southeast USA Electronic Access Control Systems Industry Analysis, Insights and Forecast, 2019-2031
- 13. Midwest USA Electronic Access Control Systems Industry Analysis, Insights and Forecast, 2019-2031
- 14. Southwest USA Electronic Access Control Systems Industry Analysis, Insights and Forecast, 2019-2031
- 15. West USA Electronic Access Control Systems Industry Analysis, Insights and Forecast, 2019-2031
- 16. Competitive Analysis
- 16.1. Global Market Share Analysis 2024
- 16.2. Company Profiles
- 16.2.1 Allegion PLC
- 16.2.1.1. Overview
- 16.2.1.2. Products
- 16.2.1.3. SWOT Analysis
- 16.2.1.4. Recent Developments
- 16.2.1.5. Financials (Based on Availability)
- 16.2.2 Johnson Controls International PLC
- 16.2.2.1. Overview
- 16.2.2.2. Products
- 16.2.2.3. SWOT Analysis
- 16.2.2.4. Recent Developments
- 16.2.2.5. Financials (Based on Availability)
- 16.2.3 Stanley Black & Decker Inc
- 16.2.3.1. Overview
- 16.2.3.2. Products
- 16.2.3.3. SWOT Analysis
- 16.2.3.4. Recent Developments
- 16.2.3.5. Financials (Based on Availability)
- 16.2.4 Assa Abloy AB Group
- 16.2.4.1. Overview
- 16.2.4.2. Products
- 16.2.4.3. SWOT Analysis
- 16.2.4.4. Recent Developments
- 16.2.4.5. Financials (Based on Availability)
- 16.2.5 United Technologies Corporation
- 16.2.5.1. Overview
- 16.2.5.2. Products
- 16.2.5.3. SWOT Analysis
- 16.2.5.4. Recent Developments
- 16.2.5.5. Financials (Based on Availability)
- 16.2.6 Honeywell Security Group
- 16.2.6.1. Overview
- 16.2.6.2. Products
- 16.2.6.3. SWOT Analysis
- 16.2.6.4. Recent Developments
- 16.2.6.5. Financials (Based on Availability)
- 16.2.7 Schneider Electric SE
- 16.2.7.1. Overview
- 16.2.7.2. Products
- 16.2.7.3. SWOT Analysis
- 16.2.7.4. Recent Developments
- 16.2.7.5. Financials (Based on Availability)
- 16.2.8 Bosch Security System Inc
- 16.2.8.1. Overview
- 16.2.8.2. Products
- 16.2.8.3. SWOT Analysis
- 16.2.8.4. Recent Developments
- 16.2.8.5. Financials (Based on Availability)
- 16.2.9 dormakaba Holding AG
- 16.2.9.1. Overview
- 16.2.9.2. Products
- 16.2.9.3. SWOT Analysis
- 16.2.9.4. Recent Developments
- 16.2.9.5. Financials (Based on Availability)
- 16.2.10 IDEMIA Identity & Security SAS
- 16.2.10.1. Overview
- 16.2.10.2. Products
- 16.2.10.3. SWOT Analysis
- 16.2.10.4. Recent Developments
- 16.2.10.5. Financials (Based on Availability)
- 16.2.1 Allegion PLC
List of Figures
- Figure 1: Global USA Electronic Access Control Systems Industry Revenue Breakdown (Million, %) by Region 2024 & 2032
- Figure 2: Global USA Electronic Access Control Systems Industry Volume Breakdown (K Unit, %) by Region 2024 & 2032
- Figure 3: United states USA Electronic Access Control Systems Industry Revenue (Million), by Country 2024 & 2032
- Figure 4: United states USA Electronic Access Control Systems Industry Volume (K Unit), by Country 2024 & 2032
- Figure 5: United states USA Electronic Access Control Systems Industry Revenue Share (%), by Country 2024 & 2032
- Figure 6: United states USA Electronic Access Control Systems Industry Volume Share (%), by Country 2024 & 2032
- Figure 7: North America USA Electronic Access Control Systems Industry Revenue (Million), by Type 2024 & 2032
- Figure 8: North America USA Electronic Access Control Systems Industry Volume (K Unit), by Type 2024 & 2032
- Figure 9: North America USA Electronic Access Control Systems Industry Revenue Share (%), by Type 2024 & 2032
- Figure 10: North America USA Electronic Access Control Systems Industry Volume Share (%), by Type 2024 & 2032
- Figure 11: North America USA Electronic Access Control Systems Industry Revenue (Million), by End User 2024 & 2032
- Figure 12: North America USA Electronic Access Control Systems Industry Volume (K Unit), by End User 2024 & 2032
- Figure 13: North America USA Electronic Access Control Systems Industry Revenue Share (%), by End User 2024 & 2032
- Figure 14: North America USA Electronic Access Control Systems Industry Volume Share (%), by End User 2024 & 2032
- Figure 15: North America USA Electronic Access Control Systems Industry Revenue (Million), by Country 2024 & 2032
- Figure 16: North America USA Electronic Access Control Systems Industry Volume (K Unit), by Country 2024 & 2032
- Figure 17: North America USA Electronic Access Control Systems Industry Revenue Share (%), by Country 2024 & 2032
- Figure 18: North America USA Electronic Access Control Systems Industry Volume Share (%), by Country 2024 & 2032
- Figure 19: South America USA Electronic Access Control Systems Industry Revenue (Million), by Type 2024 & 2032
- Figure 20: South America USA Electronic Access Control Systems Industry Volume (K Unit), by Type 2024 & 2032
- Figure 21: South America USA Electronic Access Control Systems Industry Revenue Share (%), by Type 2024 & 2032
- Figure 22: South America USA Electronic Access Control Systems Industry Volume Share (%), by Type 2024 & 2032
- Figure 23: South America USA Electronic Access Control Systems Industry Revenue (Million), by End User 2024 & 2032
- Figure 24: South America USA Electronic Access Control Systems Industry Volume (K Unit), by End User 2024 & 2032
- Figure 25: South America USA Electronic Access Control Systems Industry Revenue Share (%), by End User 2024 & 2032
- Figure 26: South America USA Electronic Access Control Systems Industry Volume Share (%), by End User 2024 & 2032
- Figure 27: South America USA Electronic Access Control Systems Industry Revenue (Million), by Country 2024 & 2032
- Figure 28: South America USA Electronic Access Control Systems Industry Volume (K Unit), by Country 2024 & 2032
- Figure 29: South America USA Electronic Access Control Systems Industry Revenue Share (%), by Country 2024 & 2032
- Figure 30: South America USA Electronic Access Control Systems Industry Volume Share (%), by Country 2024 & 2032
- Figure 31: Europe USA Electronic Access Control Systems Industry Revenue (Million), by Type 2024 & 2032
- Figure 32: Europe USA Electronic Access Control Systems Industry Volume (K Unit), by Type 2024 & 2032
- Figure 33: Europe USA Electronic Access Control Systems Industry Revenue Share (%), by Type 2024 & 2032
- Figure 34: Europe USA Electronic Access Control Systems Industry Volume Share (%), by Type 2024 & 2032
- Figure 35: Europe USA Electronic Access Control Systems Industry Revenue (Million), by End User 2024 & 2032
- Figure 36: Europe USA Electronic Access Control Systems Industry Volume (K Unit), by End User 2024 & 2032
- Figure 37: Europe USA Electronic Access Control Systems Industry Revenue Share (%), by End User 2024 & 2032
- Figure 38: Europe USA Electronic Access Control Systems Industry Volume Share (%), by End User 2024 & 2032
- Figure 39: Europe USA Electronic Access Control Systems Industry Revenue (Million), by Country 2024 & 2032
- Figure 40: Europe USA Electronic Access Control Systems Industry Volume (K Unit), by Country 2024 & 2032
- Figure 41: Europe USA Electronic Access Control Systems Industry Revenue Share (%), by Country 2024 & 2032
- Figure 42: Europe USA Electronic Access Control Systems Industry Volume Share (%), by Country 2024 & 2032
- Figure 43: Middle East & Africa USA Electronic Access Control Systems Industry Revenue (Million), by Type 2024 & 2032
- Figure 44: Middle East & Africa USA Electronic Access Control Systems Industry Volume (K Unit), by Type 2024 & 2032
- Figure 45: Middle East & Africa USA Electronic Access Control Systems Industry Revenue Share (%), by Type 2024 & 2032
- Figure 46: Middle East & Africa USA Electronic Access Control Systems Industry Volume Share (%), by Type 2024 & 2032
- Figure 47: Middle East & Africa USA Electronic Access Control Systems Industry Revenue (Million), by End User 2024 & 2032
- Figure 48: Middle East & Africa USA Electronic Access Control Systems Industry Volume (K Unit), by End User 2024 & 2032
- Figure 49: Middle East & Africa USA Electronic Access Control Systems Industry Revenue Share (%), by End User 2024 & 2032
- Figure 50: Middle East & Africa USA Electronic Access Control Systems Industry Volume Share (%), by End User 2024 & 2032
- Figure 51: Middle East & Africa USA Electronic Access Control Systems Industry Revenue (Million), by Country 2024 & 2032
- Figure 52: Middle East & Africa USA Electronic Access Control Systems Industry Volume (K Unit), by Country 2024 & 2032
- Figure 53: Middle East & Africa USA Electronic Access Control Systems Industry Revenue Share (%), by Country 2024 & 2032
- Figure 54: Middle East & Africa USA Electronic Access Control Systems Industry Volume Share (%), by Country 2024 & 2032
- Figure 55: Asia Pacific USA Electronic Access Control Systems Industry Revenue (Million), by Type 2024 & 2032
- Figure 56: Asia Pacific USA Electronic Access Control Systems Industry Volume (K Unit), by Type 2024 & 2032
- Figure 57: Asia Pacific USA Electronic Access Control Systems Industry Revenue Share (%), by Type 2024 & 2032
- Figure 58: Asia Pacific USA Electronic Access Control Systems Industry Volume Share (%), by Type 2024 & 2032
- Figure 59: Asia Pacific USA Electronic Access Control Systems Industry Revenue (Million), by End User 2024 & 2032
- Figure 60: Asia Pacific USA Electronic Access Control Systems Industry Volume (K Unit), by End User 2024 & 2032
- Figure 61: Asia Pacific USA Electronic Access Control Systems Industry Revenue Share (%), by End User 2024 & 2032
- Figure 62: Asia Pacific USA Electronic Access Control Systems Industry Volume Share (%), by End User 2024 & 2032
- Figure 63: Asia Pacific USA Electronic Access Control Systems Industry Revenue (Million), by Country 2024 & 2032
- Figure 64: Asia Pacific USA Electronic Access Control Systems Industry Volume (K Unit), by Country 2024 & 2032
- Figure 65: Asia Pacific USA Electronic Access Control Systems Industry Revenue Share (%), by Country 2024 & 2032
- Figure 66: Asia Pacific USA Electronic Access Control Systems Industry Volume Share (%), by Country 2024 & 2032
List of Tables
- Table 1: Global USA Electronic Access Control Systems Industry Revenue Million Forecast, by Region 2019 & 2032
- Table 2: Global USA Electronic Access Control Systems Industry Volume K Unit Forecast, by Region 2019 & 2032
- Table 3: Global USA Electronic Access Control Systems Industry Revenue Million Forecast, by Type 2019 & 2032
- Table 4: Global USA Electronic Access Control Systems Industry Volume K Unit Forecast, by Type 2019 & 2032
- Table 5: Global USA Electronic Access Control Systems Industry Revenue Million Forecast, by End User 2019 & 2032
- Table 6: Global USA Electronic Access Control Systems Industry Volume K Unit Forecast, by End User 2019 & 2032
- Table 7: Global USA Electronic Access Control Systems Industry Revenue Million Forecast, by Region 2019 & 2032
- Table 8: Global USA Electronic Access Control Systems Industry Volume K Unit Forecast, by Region 2019 & 2032
- Table 9: Global USA Electronic Access Control Systems Industry Revenue Million Forecast, by Country 2019 & 2032
- Table 10: Global USA Electronic Access Control Systems Industry Volume K Unit Forecast, by Country 2019 & 2032
- Table 11: Northeast USA Electronic Access Control Systems Industry Revenue (Million) Forecast, by Application 2019 & 2032
- Table 12: Northeast USA Electronic Access Control Systems Industry Volume (K Unit) Forecast, by Application 2019 & 2032
- Table 13: Southeast USA Electronic Access Control Systems Industry Revenue (Million) Forecast, by Application 2019 & 2032
- Table 14: Southeast USA Electronic Access Control Systems Industry Volume (K Unit) Forecast, by Application 2019 & 2032
- Table 15: Midwest USA Electronic Access Control Systems Industry Revenue (Million) Forecast, by Application 2019 & 2032
- Table 16: Midwest USA Electronic Access Control Systems Industry Volume (K Unit) Forecast, by Application 2019 & 2032
- Table 17: Southwest USA Electronic Access Control Systems Industry Revenue (Million) Forecast, by Application 2019 & 2032
- Table 18: Southwest USA Electronic Access Control Systems Industry Volume (K Unit) Forecast, by Application 2019 & 2032
- Table 19: West USA Electronic Access Control Systems Industry Revenue (Million) Forecast, by Application 2019 & 2032
- Table 20: West USA Electronic Access Control Systems Industry Volume (K Unit) Forecast, by Application 2019 & 2032
- Table 21: Global USA Electronic Access Control Systems Industry Revenue Million Forecast, by Type 2019 & 2032
- Table 22: Global USA Electronic Access Control Systems Industry Volume K Unit Forecast, by Type 2019 & 2032
- Table 23: Global USA Electronic Access Control Systems Industry Revenue Million Forecast, by End User 2019 & 2032
- Table 24: Global USA Electronic Access Control Systems Industry Volume K Unit Forecast, by End User 2019 & 2032
- Table 25: Global USA Electronic Access Control Systems Industry Revenue Million Forecast, by Country 2019 & 2032
- Table 26: Global USA Electronic Access Control Systems Industry Volume K Unit Forecast, by Country 2019 & 2032
- Table 27: United States USA Electronic Access Control Systems Industry Revenue (Million) Forecast, by Application 2019 & 2032
- Table 28: United States USA Electronic Access Control Systems Industry Volume (K Unit) Forecast, by Application 2019 & 2032
- Table 29: Canada USA Electronic Access Control Systems Industry Revenue (Million) Forecast, by Application 2019 & 2032
- Table 30: Canada USA Electronic Access Control Systems Industry Volume (K Unit) Forecast, by Application 2019 & 2032
- Table 31: Mexico USA Electronic Access Control Systems Industry Revenue (Million) Forecast, by Application 2019 & 2032
- Table 32: Mexico USA Electronic Access Control Systems Industry Volume (K Unit) Forecast, by Application 2019 & 2032
- Table 33: Global USA Electronic Access Control Systems Industry Revenue Million Forecast, by Type 2019 & 2032
- Table 34: Global USA Electronic Access Control Systems Industry Volume K Unit Forecast, by Type 2019 & 2032
- Table 35: Global USA Electronic Access Control Systems Industry Revenue Million Forecast, by End User 2019 & 2032
- Table 36: Global USA Electronic Access Control Systems Industry Volume K Unit Forecast, by End User 2019 & 2032
- Table 37: Global USA Electronic Access Control Systems Industry Revenue Million Forecast, by Country 2019 & 2032
- Table 38: Global USA Electronic Access Control Systems Industry Volume K Unit Forecast, by Country 2019 & 2032
- Table 39: Brazil USA Electronic Access Control Systems Industry Revenue (Million) Forecast, by Application 2019 & 2032
- Table 40: Brazil USA Electronic Access Control Systems Industry Volume (K Unit) Forecast, by Application 2019 & 2032
- Table 41: Argentina USA Electronic Access Control Systems Industry Revenue (Million) Forecast, by Application 2019 & 2032
- Table 42: Argentina USA Electronic Access Control Systems Industry Volume (K Unit) Forecast, by Application 2019 & 2032
- Table 43: Rest of South America USA Electronic Access Control Systems Industry Revenue (Million) Forecast, by Application 2019 & 2032
- Table 44: Rest of South America USA Electronic Access Control Systems Industry Volume (K Unit) Forecast, by Application 2019 & 2032
- Table 45: Global USA Electronic Access Control Systems Industry Revenue Million Forecast, by Type 2019 & 2032
- Table 46: Global USA Electronic Access Control Systems Industry Volume K Unit Forecast, by Type 2019 & 2032
- Table 47: Global USA Electronic Access Control Systems Industry Revenue Million Forecast, by End User 2019 & 2032
- Table 48: Global USA Electronic Access Control Systems Industry Volume K Unit Forecast, by End User 2019 & 2032
- Table 49: Global USA Electronic Access Control Systems Industry Revenue Million Forecast, by Country 2019 & 2032
- Table 50: Global USA Electronic Access Control Systems Industry Volume K Unit Forecast, by Country 2019 & 2032
- Table 51: United Kingdom USA Electronic Access Control Systems Industry Revenue (Million) Forecast, by Application 2019 & 2032
- Table 52: United Kingdom USA Electronic Access Control Systems Industry Volume (K Unit) Forecast, by Application 2019 & 2032
- Table 53: Germany USA Electronic Access Control Systems Industry Revenue (Million) Forecast, by Application 2019 & 2032
- Table 54: Germany USA Electronic Access Control Systems Industry Volume (K Unit) Forecast, by Application 2019 & 2032
- Table 55: France USA Electronic Access Control Systems Industry Revenue (Million) Forecast, by Application 2019 & 2032
- Table 56: France USA Electronic Access Control Systems Industry Volume (K Unit) Forecast, by Application 2019 & 2032
- Table 57: Italy USA Electronic Access Control Systems Industry Revenue (Million) Forecast, by Application 2019 & 2032
- Table 58: Italy USA Electronic Access Control Systems Industry Volume (K Unit) Forecast, by Application 2019 & 2032
- Table 59: Spain USA Electronic Access Control Systems Industry Revenue (Million) Forecast, by Application 2019 & 2032
- Table 60: Spain USA Electronic Access Control Systems Industry Volume (K Unit) Forecast, by Application 2019 & 2032
- Table 61: Russia USA Electronic Access Control Systems Industry Revenue (Million) Forecast, by Application 2019 & 2032
- Table 62: Russia USA Electronic Access Control Systems Industry Volume (K Unit) Forecast, by Application 2019 & 2032
- Table 63: Benelux USA Electronic Access Control Systems Industry Revenue (Million) Forecast, by Application 2019 & 2032
- Table 64: Benelux USA Electronic Access Control Systems Industry Volume (K Unit) Forecast, by Application 2019 & 2032
- Table 65: Nordics USA Electronic Access Control Systems Industry Revenue (Million) Forecast, by Application 2019 & 2032
- Table 66: Nordics USA Electronic Access Control Systems Industry Volume (K Unit) Forecast, by Application 2019 & 2032
- Table 67: Rest of Europe USA Electronic Access Control Systems Industry Revenue (Million) Forecast, by Application 2019 & 2032
- Table 68: Rest of Europe USA Electronic Access Control Systems Industry Volume (K Unit) Forecast, by Application 2019 & 2032
- Table 69: Global USA Electronic Access Control Systems Industry Revenue Million Forecast, by Type 2019 & 2032
- Table 70: Global USA Electronic Access Control Systems Industry Volume K Unit Forecast, by Type 2019 & 2032
- Table 71: Global USA Electronic Access Control Systems Industry Revenue Million Forecast, by End User 2019 & 2032
- Table 72: Global USA Electronic Access Control Systems Industry Volume K Unit Forecast, by End User 2019 & 2032
- Table 73: Global USA Electronic Access Control Systems Industry Revenue Million Forecast, by Country 2019 & 2032
- Table 74: Global USA Electronic Access Control Systems Industry Volume K Unit Forecast, by Country 2019 & 2032
- Table 75: Turkey USA Electronic Access Control Systems Industry Revenue (Million) Forecast, by Application 2019 & 2032
- Table 76: Turkey USA Electronic Access Control Systems Industry Volume (K Unit) Forecast, by Application 2019 & 2032
- Table 77: Israel USA Electronic Access Control Systems Industry Revenue (Million) Forecast, by Application 2019 & 2032
- Table 78: Israel USA Electronic Access Control Systems Industry Volume (K Unit) Forecast, by Application 2019 & 2032
- Table 79: GCC USA Electronic Access Control Systems Industry Revenue (Million) Forecast, by Application 2019 & 2032
- Table 80: GCC USA Electronic Access Control Systems Industry Volume (K Unit) Forecast, by Application 2019 & 2032
- Table 81: North Africa USA Electronic Access Control Systems Industry Revenue (Million) Forecast, by Application 2019 & 2032
- Table 82: North Africa USA Electronic Access Control Systems Industry Volume (K Unit) Forecast, by Application 2019 & 2032
- Table 83: South Africa USA Electronic Access Control Systems Industry Revenue (Million) Forecast, by Application 2019 & 2032
- Table 84: South Africa USA Electronic Access Control Systems Industry Volume (K Unit) Forecast, by Application 2019 & 2032
- Table 85: Rest of Middle East & Africa USA Electronic Access Control Systems Industry Revenue (Million) Forecast, by Application 2019 & 2032
- Table 86: Rest of Middle East & Africa USA Electronic Access Control Systems Industry Volume (K Unit) Forecast, by Application 2019 & 2032
- Table 87: Global USA Electronic Access Control Systems Industry Revenue Million Forecast, by Type 2019 & 2032
- Table 88: Global USA Electronic Access Control Systems Industry Volume K Unit Forecast, by Type 2019 & 2032
- Table 89: Global USA Electronic Access Control Systems Industry Revenue Million Forecast, by End User 2019 & 2032
- Table 90: Global USA Electronic Access Control Systems Industry Volume K Unit Forecast, by End User 2019 & 2032
- Table 91: Global USA Electronic Access Control Systems Industry Revenue Million Forecast, by Country 2019 & 2032
- Table 92: Global USA Electronic Access Control Systems Industry Volume K Unit Forecast, by Country 2019 & 2032
- Table 93: China USA Electronic Access Control Systems Industry Revenue (Million) Forecast, by Application 2019 & 2032
- Table 94: China USA Electronic Access Control Systems Industry Volume (K Unit) Forecast, by Application 2019 & 2032
- Table 95: India USA Electronic Access Control Systems Industry Revenue (Million) Forecast, by Application 2019 & 2032
- Table 96: India USA Electronic Access Control Systems Industry Volume (K Unit) Forecast, by Application 2019 & 2032
- Table 97: Japan USA Electronic Access Control Systems Industry Revenue (Million) Forecast, by Application 2019 & 2032
- Table 98: Japan USA Electronic Access Control Systems Industry Volume (K Unit) Forecast, by Application 2019 & 2032
- Table 99: South Korea USA Electronic Access Control Systems Industry Revenue (Million) Forecast, by Application 2019 & 2032
- Table 100: South Korea USA Electronic Access Control Systems Industry Volume (K Unit) Forecast, by Application 2019 & 2032
- Table 101: ASEAN USA Electronic Access Control Systems Industry Revenue (Million) Forecast, by Application 2019 & 2032
- Table 102: ASEAN USA Electronic Access Control Systems Industry Volume (K Unit) Forecast, by Application 2019 & 2032
- Table 103: Oceania USA Electronic Access Control Systems Industry Revenue (Million) Forecast, by Application 2019 & 2032
- Table 104: Oceania USA Electronic Access Control Systems Industry Volume (K Unit) Forecast, by Application 2019 & 2032
- Table 105: Rest of Asia Pacific USA Electronic Access Control Systems Industry Revenue (Million) Forecast, by Application 2019 & 2032
- Table 106: Rest of Asia Pacific USA Electronic Access Control Systems Industry Volume (K Unit) Forecast, by Application 2019 & 2032
Frequently Asked Questions
1. What is the projected Compound Annual Growth Rate (CAGR) of the USA Electronic Access Control Systems Industry?
The projected CAGR is approximately 4.29%.
2. Which companies are prominent players in the USA Electronic Access Control Systems Industry?
Key companies in the market include Allegion PLC, Johnson Controls International PLC, Stanley Black & Decker Inc , Assa Abloy AB Group, United Technologies Corporation, Honeywell Security Group, Schneider Electric SE, Bosch Security System Inc, dormakaba Holding AG, IDEMIA Identity & Security SAS.
3. What are the main segments of the USA Electronic Access Control Systems Industry?
The market segments include Type, End User.
4. Can you provide details about the market size?
The market size is estimated to be USD 3.63 Million as of 2022.
5. What are some drivers contributing to market growth?
Increasing Safety and Security Concerns; Increasing Adoption of Smart Home Architecture.
6. What are the notable trends driving market growth?
The Healthcare Sector to Hold the Major Market Share.
7. Are there any restraints impacting market growth?
High cost involved in replacing the existing Deep UV with EUV lasers; Monopoly existing within the market.
8. Can you provide examples of recent developments in the market?
N/A
9. What pricing options are available for accessing the report?
Pricing options include single-user, multi-user, and enterprise licenses priced at USD 3800, USD 4500, and USD 5800 respectively.
10. Is the market size provided in terms of value or volume?
The market size is provided in terms of value, measured in Million and volume, measured in K Unit.
11. Are there any specific market keywords associated with the report?
Yes, the market keyword associated with the report is "USA Electronic Access Control Systems Industry," which aids in identifying and referencing the specific market segment covered.
12. How do I determine which pricing option suits my needs best?
The pricing options vary based on user requirements and access needs. Individual users may opt for single-user licenses, while businesses requiring broader access may choose multi-user or enterprise licenses for cost-effective access to the report.
13. Are there any additional resources or data provided in the USA Electronic Access Control Systems Industry report?
While the report offers comprehensive insights, it's advisable to review the specific contents or supplementary materials provided to ascertain if additional resources or data are available.
14. How can I stay updated on further developments or reports in the USA Electronic Access Control Systems Industry?
To stay informed about further developments, trends, and reports in the USA Electronic Access Control Systems Industry, consider subscribing to industry newsletters, following relevant companies and organizations, or regularly checking reputable industry news sources and publications.
Methodology
Step 1 - Identification of Relevant Samples Size from Population Database


Step 2 - Approaches for Defining Global Market Size (Value, Volume* & Price*)

Note*: In applicable scenarios
Step 3 - Data Sources
Primary Research
- Web Analytics
- Survey Reports
- Research Institute
- Latest Research Reports
- Opinion Leaders
Secondary Research
- Annual Reports
- White Paper
- Latest Press Release
- Industry Association
- Paid Database
- Investor Presentations

Step 4 - Data Triangulation
Involves using different sources of information in order to increase the validity of a study
These sources are likely to be stakeholders in a program - participants, other researchers, program staff, other community members, and so on.
Then we put all data in single framework & apply various statistical tools to find out the dynamic on the market.
During the analysis stage, feedback from the stakeholder groups would be compared to determine areas of agreement as well as areas of divergence


