
Key Insights
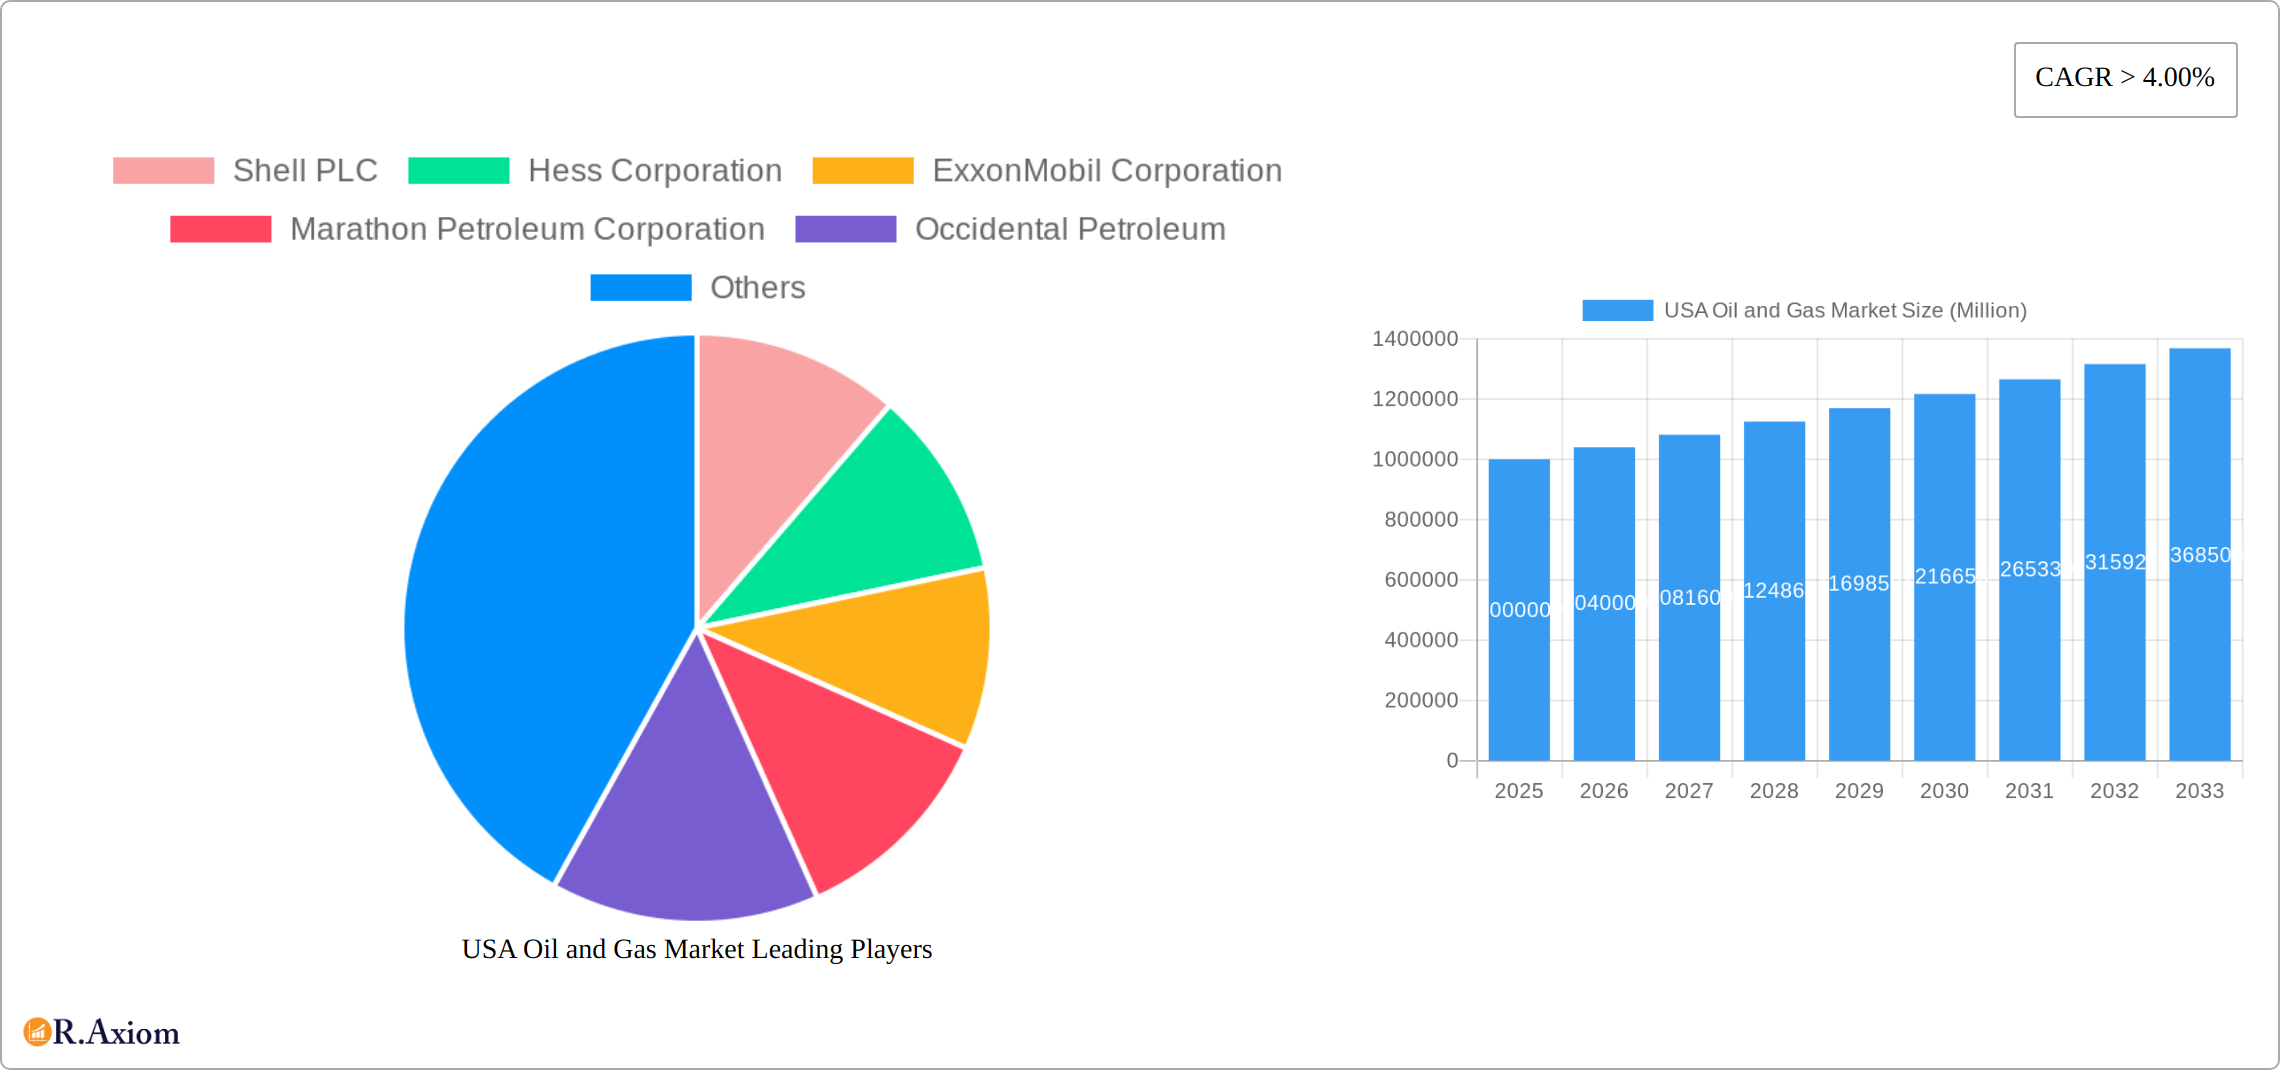
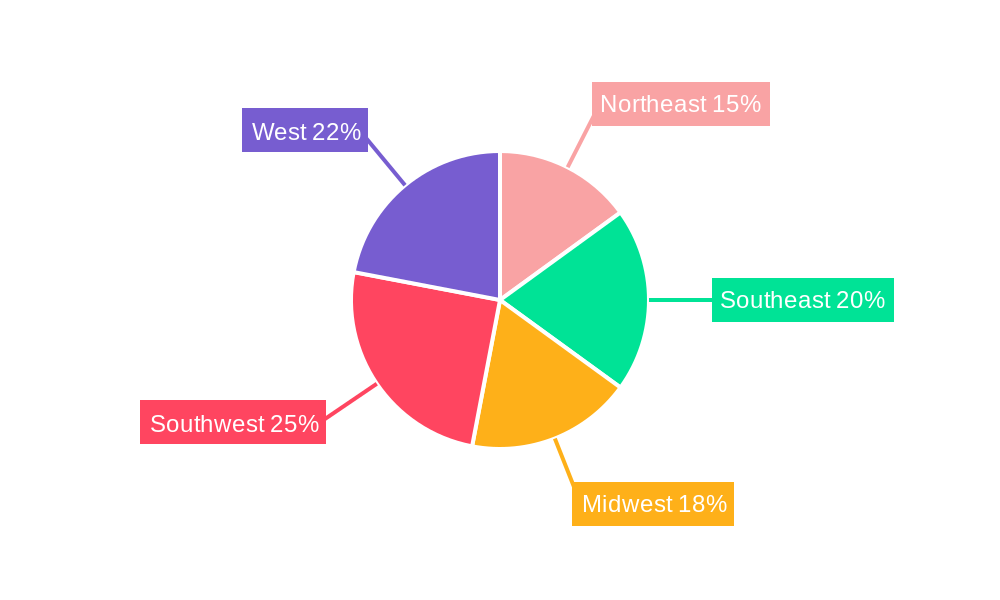
The US oil and gas market, a cornerstone of the nation's energy infrastructure, is projected to experience robust growth throughout the forecast period (2025-2033). Driven by increasing energy demand from a growing population and expanding industrial activities, particularly in the transportation and industrial sectors, the market is anticipated to maintain a Compound Annual Growth Rate (CAGR) exceeding 4%. While the residential and commercial sectors contribute significantly, the industrial sector's reliance on oil and gas for production processes fuels considerable market demand. Key trends shaping the market include the ongoing transition towards cleaner energy sources, prompting investment in technologies like carbon capture and storage, and the exploration of unconventional resources such as shale gas and tight oil. Furthermore, government regulations regarding emissions and environmental protection influence operational practices and investment strategies within the industry. Major players like ExxonMobil, Chevron, and Shell continue to dominate the market, leveraging their established infrastructure and technological expertise. Regional variations exist, with the Southwest and West potentially exhibiting faster growth due to ongoing exploration and production activities in those regions. However, supply chain resilience and geopolitical factors remain potential restraints, influencing price volatility and overall market stability.
The market segmentation reveals significant opportunities across product types (crude oil, natural gas, refined products) and end-use sectors. The dominance of crude oil and natural gas is expected to continue, although refined products, particularly those catering to transportation, will also experience notable growth. Regional analysis highlights the importance of the Southwest and West, driven by robust exploration and production activities in shale formations. The Northeast and Southeast, while having established infrastructure, might experience comparatively slower growth due to varying levels of industrial activity and existing regulatory frameworks. The ongoing interplay between supply, demand, governmental policies, and technological advancements will be crucial in shaping the market's trajectory during the forecast period. Competition among established players and the emergence of smaller, more agile companies focused on niche markets will further define the market dynamics.
USA Oil and Gas Market: Comprehensive Report (2019-2033)
This in-depth report provides a comprehensive analysis of the USA Oil and Gas market, covering the period from 2019 to 2033. It offers invaluable insights into market dynamics, key players, growth drivers, and future trends, equipping stakeholders with actionable intelligence for strategic decision-making. The report leverages extensive data analysis to present a clear picture of the current market landscape and its future trajectory, incorporating crucial developments and forecasts.
USA Oil and Gas Market Market Concentration & Innovation
The US oil and gas market presents a dynamic competitive landscape shaped by market concentration, innovation, regulatory pressures, substitute products, evolving end-user demands, and a robust mergers and acquisitions (M&A) environment. The market is dominated by several major integrated oil and gas companies, including ExxonMobil, Chevron, ConocoPhillips, and Shell, alongside a multitude of independent producers. While precise market share data fluctuates, the top five players consistently hold a significant portion, indicating a moderately concentrated market. For example, in 2024, their combined market share was estimated at [Insert Updated Percentage]%, highlighting the influence of these major players.
- Market Share Dynamics: ExxonMobil and Chevron maintain substantial market share, followed closely by ConocoPhillips and Shell. Independent producers, however, play a crucial role, especially within specific shale plays, contributing significantly to overall production.
- Innovation as a Key Driver: Technological breakthroughs in exploration and production (E&P), such as horizontal drilling and hydraulic fracturing, have been instrumental in driving market growth. The industry's future trajectory is being redefined by substantial investments in renewable energy and carbon capture, utilization, and storage (CCUS) technologies, signifying a shift towards a lower-carbon footprint.
- Regulatory Landscape and its Impact: Stringent environmental regulations and evolving safety standards exert considerable influence on industry operations and investment strategies. The impact of fluctuating government policies and the ongoing debate around energy regulations needs careful consideration when assessing future market trends.
- The Rise of Product Substitutes: The emergence of renewable energy sources, including solar and wind power, poses a significant challenge to the dominance of oil and gas. The rate of adoption of these alternatives is a pivotal factor determining future fossil fuel demand and the long-term viability of traditional energy companies.
- M&A Activity: A Catalyst for Change: The oil and gas industry has witnessed significant M&A activity in recent years, driven by the pursuit of consolidation, diversification, and access to new resources and technologies. The total value of M&A deals between 2019 and 2024 reached approximately [Insert Updated Dollar Amount] million, demonstrating a strategic focus on reshaping the competitive landscape.
USA Oil and Gas Market Industry Trends & Insights
The US oil and gas market is undergoing a period of significant transformation. Several factors are driving this change, including fluctuating global energy demand, evolving environmental regulations, rapid technological advancements, and a notable shift in consumer preferences towards cleaner energy sources. The Compound Annual Growth Rate (CAGR) for the market during the forecast period (2025-2033) is projected to be [Insert Updated CAGR Percentage]%. This projection reflects the complex interplay of various forces at play. The increasing penetration of renewable energy sources presents both opportunities and challenges for established oil and gas companies, necessitating adaptation and innovation.
The accelerating adoption of electric vehicles and the broader transition to a low-carbon economy exert significant downward pressure on long-term oil demand, particularly in the transportation sector. This trend will profoundly impact the refining sector, potentially leading to adjustments in capacity utilization and investment decisions. Conversely, natural gas continues to enjoy robust demand, largely driven by its role in electricity generation and industrial processes. The overall outlook for the US oil and gas market is complex and highly dynamic, influenced by the interplay of global geopolitical events, technological breakthroughs, economic conditions, and evolving environmental policies. A detailed analysis of these factors is crucial for accurately forecasting future market performance.
Dominant Markets & Segments in USA Oil and Gas Market
The US oil and gas market exhibits regional variations in production and consumption patterns. The Permian Basin remains a dominant producing region for crude oil and natural gas, driven by technological advancements and extensive reserves. The Gulf Coast region plays a crucial role in refining and petrochemical production.
- Product Type:
- Crude Oil: Dominated by Texas and the Permian Basin, with strong infrastructure and favorable geological conditions.
- Natural Gas: Significant production from shale plays like the Marcellus and Haynesville, supplying both domestic and export markets.
- Refined Products: Gulf Coast refining hubs, benefitting from proximity to crude oil sources and established distribution networks.
- End-Use Sector:
- Transportation: Remains the largest consumer of refined petroleum products, although facing increasing competition from electric vehicles.
- Industrial: A significant consumer of natural gas for power generation and industrial processes.
- Residential: Natural gas is the primary energy source for heating and cooking in many homes.
- Commercial: Mixed energy consumption with increasing adoption of renewable energy sources for buildings.
Key drivers influencing market dominance include economic policies that encourage energy production, availability of skilled labor, existing infrastructure, access to transportation networks, and proximity to key markets.
USA Oil and Gas Market Product Developments
Recent years have seen considerable progress in oil and gas production technologies, including advancements in drilling techniques, enhanced oil recovery (EOR) methods, and the development of more efficient refining processes. These innovations aim to increase extraction efficiency, minimize environmental impact, and boost the competitiveness of US oil and gas producers in the global market. Beyond traditional applications, the industry is actively exploring new uses for natural gas, such as its utilization as a feedstock for the production of chemicals and other value-added products. This diversification strategy seeks to mitigate reliance on traditional energy markets and expand revenue streams.
Furthermore, significant research and development efforts are focused on developing cleaner energy solutions within the oil and gas sector. This includes substantial investments in carbon capture, utilization, and storage (CCUS) technologies, aiming to reduce greenhouse gas emissions and contribute to a more sustainable energy future. These technological advancements are not only improving operational efficiency but also driving a crucial shift towards environmental responsibility within the industry.
Report Scope & Segmentation Analysis
This report segments the USA oil and gas market based on product type (crude oil, natural gas, refined products) and end-use sector (industrial, commercial, residential, transportation). Each segment's growth trajectory, market size, and competitive dynamics are analyzed in detail. For example, the transportation sector, while currently the largest consumer of refined products, is anticipated to experience slower growth due to increased adoption of electric vehicles. However, industrial demand for natural gas is projected to remain strong, supported by ongoing industrial growth and limited viable substitutes. The residential segment’s demand remains stable, primarily driven by heating requirements, while the commercial sector’s demand for energy is expected to show moderate growth.
Key Drivers of USA Oil and Gas Market Growth
Several factors fuel the growth of the USA oil and gas market. Technological advancements in exploration and extraction, particularly horizontal drilling and hydraulic fracturing, have unlocked significant reserves and boosted production. Furthermore, supportive government policies and access to abundant domestic resources continue to play a role. The increasing demand for energy from developing economies also provides opportunities for US producers to export their products. Continued investment in pipeline infrastructure further supports market expansion.
Challenges in the USA Oil and Gas Market Sector
The USA oil and gas sector faces several challenges. Fluctuating global energy prices and regulatory pressures related to environmental concerns significantly impact profitability and investment decisions. Supply chain disruptions and potential geopolitical instability also pose significant risks. The industry must adapt to rising public scrutiny related to environmental, social, and governance (ESG) factors to maintain its social license to operate. Increased competition from renewable energy sources adds another layer of complexity.
Emerging Opportunities in USA Oil and Gas Market
Despite challenges, significant opportunities exist within the USA oil and gas market. The growing demand for liquefied natural gas (LNG) exports creates potential for revenue diversification. Investments in carbon capture, utilization, and storage (CCUS) technologies offer avenues for mitigating environmental impacts and enhancing sustainability. Advancements in data analytics and artificial intelligence are enhancing efficiency and optimizing production processes across the value chain.
Leading Players in the USA Oil and Gas Market Market
- Shell PLC
- Hess Corporation
- ExxonMobil Corporation
- Marathon Petroleum Corporation
- Occidental Petroleum
- Chevron Corporation
- ConocoPhillips Company
- Valero Energy
- EOG Resources
- Total Energies SE
- Phillips 66
- BP PLC
Key Developments in USA Oil and Gas Market Industry
- January 2022: The Department of Energy announced the release of 13.4 Million barrels of oil from the Strategic Petroleum Reserve to combat rising gasoline prices and global supply shortages. This had a short-term impact on prices but did not address underlying supply-demand imbalances.
- March 2022: The landmark energy supply deal between the US and the European Union aimed to increase transatlantic gas deliveries, reducing Europe's reliance on Russian gas. This significantly boosted US LNG exports and strengthened the US's position as a global energy supplier.
Strategic Outlook for USA Oil and Gas Market Market
The future of the USA oil and gas market is intertwined with global energy transitions and technological advancements. While the long-term demand for oil is expected to decline, natural gas is likely to remain a significant energy source for the foreseeable future. Companies that successfully adapt to evolving regulations, invest in innovative technologies, and prioritize sustainability will be best positioned for long-term success. The market will likely see continued consolidation through mergers and acquisitions, and an increased focus on low-carbon energy sources and technologies.
USA Oil and Gas Market Segmentation
- 1. Upstream
- 2. Midstream
- 3. Downstream
USA Oil and Gas Market Segmentation By Geography
-
1. North America
- 1.1. United States
- 1.2. Canada
- 1.3. Mexico
-
2. South America
- 2.1. Brazil
- 2.2. Argentina
- 2.3. Rest of South America
-
3. Europe
- 3.1. United Kingdom
- 3.2. Germany
- 3.3. France
- 3.4. Italy
- 3.5. Spain
- 3.6. Russia
- 3.7. Benelux
- 3.8. Nordics
- 3.9. Rest of Europe
-
4. Middle East & Africa
- 4.1. Turkey
- 4.2. Israel
- 4.3. GCC
- 4.4. North Africa
- 4.5. South Africa
- 4.6. Rest of Middle East & Africa
-
5. Asia Pacific
- 5.1. China
- 5.2. India
- 5.3. Japan
- 5.4. South Korea
- 5.5. ASEAN
- 5.6. Oceania
- 5.7. Rest of Asia Pacific
USA Oil and Gas Market REPORT HIGHLIGHTS
| Aspects | Details |
|---|---|
| Study Period | 2019-2033 |
| Base Year | 2024 |
| Estimated Year | 2025 |
| Forecast Period | 2025-2033 |
| Historical Period | 2019-2024 |
| Growth Rate | CAGR of > 4.00% from 2019-2033 |
| Segmentation |
|
Table of Contents
- 1. Introduction
- 1.1. Research Scope
- 1.2. Market Segmentation
- 1.3. Research Methodology
- 1.4. Definitions and Assumptions
- 2. Executive Summary
- 2.1. Introduction
- 3. Market Dynamics
- 3.1. Introduction
- 3.2. Market Drivers
- 3.2.1. 4.; Modernization and Upgrades of Existing Military Aircraft Fleets4.; Increasing Defense Budgets
- 3.3. Market Restrains
- 3.3.1. 4.; Shift Toward Unmanned Aircraft
- 3.4. Market Trends
- 3.4.1. Upstream Sector Expected Witness Significant Growth
- 4. Market Factor Analysis
- 4.1. Porters Five Forces
- 4.2. Supply/Value Chain
- 4.3. PESTEL analysis
- 4.4. Market Entropy
- 4.5. Patent/Trademark Analysis
- 5. Global USA Oil and Gas Market Analysis, Insights and Forecast, 2019-2031
- 5.1. Market Analysis, Insights and Forecast - by Upstream
- 5.2. Market Analysis, Insights and Forecast - by Midstream
- 5.3. Market Analysis, Insights and Forecast - by Downstream
- 5.4. Market Analysis, Insights and Forecast - by Region
- 5.4.1. North America
- 5.4.2. South America
- 5.4.3. Europe
- 5.4.4. Middle East & Africa
- 5.4.5. Asia Pacific
- 5.1. Market Analysis, Insights and Forecast - by Upstream
- 6. North America USA Oil and Gas Market Analysis, Insights and Forecast, 2019-2031
- 6.1. Market Analysis, Insights and Forecast - by Upstream
- 6.2. Market Analysis, Insights and Forecast - by Midstream
- 6.3. Market Analysis, Insights and Forecast - by Downstream
- 6.1. Market Analysis, Insights and Forecast - by Upstream
- 7. South America USA Oil and Gas Market Analysis, Insights and Forecast, 2019-2031
- 7.1. Market Analysis, Insights and Forecast - by Upstream
- 7.2. Market Analysis, Insights and Forecast - by Midstream
- 7.3. Market Analysis, Insights and Forecast - by Downstream
- 7.1. Market Analysis, Insights and Forecast - by Upstream
- 8. Europe USA Oil and Gas Market Analysis, Insights and Forecast, 2019-2031
- 8.1. Market Analysis, Insights and Forecast - by Upstream
- 8.2. Market Analysis, Insights and Forecast - by Midstream
- 8.3. Market Analysis, Insights and Forecast - by Downstream
- 8.1. Market Analysis, Insights and Forecast - by Upstream
- 9. Middle East & Africa USA Oil and Gas Market Analysis, Insights and Forecast, 2019-2031
- 9.1. Market Analysis, Insights and Forecast - by Upstream
- 9.2. Market Analysis, Insights and Forecast - by Midstream
- 9.3. Market Analysis, Insights and Forecast - by Downstream
- 9.1. Market Analysis, Insights and Forecast - by Upstream
- 10. Asia Pacific USA Oil and Gas Market Analysis, Insights and Forecast, 2019-2031
- 10.1. Market Analysis, Insights and Forecast - by Upstream
- 10.2. Market Analysis, Insights and Forecast - by Midstream
- 10.3. Market Analysis, Insights and Forecast - by Downstream
- 10.1. Market Analysis, Insights and Forecast - by Upstream
- 11. Northeast USA Oil and Gas Market Analysis, Insights and Forecast, 2019-2031
- 12. Southeast USA Oil and Gas Market Analysis, Insights and Forecast, 2019-2031
- 13. Midwest USA Oil and Gas Market Analysis, Insights and Forecast, 2019-2031
- 14. Southwest USA Oil and Gas Market Analysis, Insights and Forecast, 2019-2031
- 15. West USA Oil and Gas Market Analysis, Insights and Forecast, 2019-2031
- 16. Competitive Analysis
- 16.1. Global Market Share Analysis 2024
- 16.2. Company Profiles
- 16.2.1 Shell PLC
- 16.2.1.1. Overview
- 16.2.1.2. Products
- 16.2.1.3. SWOT Analysis
- 16.2.1.4. Recent Developments
- 16.2.1.5. Financials (Based on Availability)
- 16.2.2 Hess Corporation
- 16.2.2.1. Overview
- 16.2.2.2. Products
- 16.2.2.3. SWOT Analysis
- 16.2.2.4. Recent Developments
- 16.2.2.5. Financials (Based on Availability)
- 16.2.3 ExxonMobil Corporation
- 16.2.3.1. Overview
- 16.2.3.2. Products
- 16.2.3.3. SWOT Analysis
- 16.2.3.4. Recent Developments
- 16.2.3.5. Financials (Based on Availability)
- 16.2.4 Marathon Petroleum Corporation
- 16.2.4.1. Overview
- 16.2.4.2. Products
- 16.2.4.3. SWOT Analysis
- 16.2.4.4. Recent Developments
- 16.2.4.5. Financials (Based on Availability)
- 16.2.5 Occidental Petroleum
- 16.2.5.1. Overview
- 16.2.5.2. Products
- 16.2.5.3. SWOT Analysis
- 16.2.5.4. Recent Developments
- 16.2.5.5. Financials (Based on Availability)
- 16.2.6 Chevron Corporation
- 16.2.6.1. Overview
- 16.2.6.2. Products
- 16.2.6.3. SWOT Analysis
- 16.2.6.4. Recent Developments
- 16.2.6.5. Financials (Based on Availability)
- 16.2.7 ConocoPhillips Company
- 16.2.7.1. Overview
- 16.2.7.2. Products
- 16.2.7.3. SWOT Analysis
- 16.2.7.4. Recent Developments
- 16.2.7.5. Financials (Based on Availability)
- 16.2.8 Valero Energy
- 16.2.8.1. Overview
- 16.2.8.2. Products
- 16.2.8.3. SWOT Analysis
- 16.2.8.4. Recent Developments
- 16.2.8.5. Financials (Based on Availability)
- 16.2.9 EOG Resources
- 16.2.9.1. Overview
- 16.2.9.2. Products
- 16.2.9.3. SWOT Analysis
- 16.2.9.4. Recent Developments
- 16.2.9.5. Financials (Based on Availability)
- 16.2.10 Total Energies SE
- 16.2.10.1. Overview
- 16.2.10.2. Products
- 16.2.10.3. SWOT Analysis
- 16.2.10.4. Recent Developments
- 16.2.10.5. Financials (Based on Availability)
- 16.2.11 Phillips
- 16.2.11.1. Overview
- 16.2.11.2. Products
- 16.2.11.3. SWOT Analysis
- 16.2.11.4. Recent Developments
- 16.2.11.5. Financials (Based on Availability)
- 16.2.12 BP PLC
- 16.2.12.1. Overview
- 16.2.12.2. Products
- 16.2.12.3. SWOT Analysis
- 16.2.12.4. Recent Developments
- 16.2.12.5. Financials (Based on Availability)
- 16.2.1 Shell PLC
List of Figures
- Figure 1: Global USA Oil and Gas Market Revenue Breakdown (Million, %) by Region 2024 & 2032
- Figure 2: Global USA Oil and Gas Market Volume Breakdown (Tonnes, %) by Region 2024 & 2032
- Figure 3: United states USA Oil and Gas Market Revenue (Million), by Country 2024 & 2032
- Figure 4: United states USA Oil and Gas Market Volume (Tonnes), by Country 2024 & 2032
- Figure 5: United states USA Oil and Gas Market Revenue Share (%), by Country 2024 & 2032
- Figure 6: United states USA Oil and Gas Market Volume Share (%), by Country 2024 & 2032
- Figure 7: North America USA Oil and Gas Market Revenue (Million), by Upstream 2024 & 2032
- Figure 8: North America USA Oil and Gas Market Volume (Tonnes), by Upstream 2024 & 2032
- Figure 9: North America USA Oil and Gas Market Revenue Share (%), by Upstream 2024 & 2032
- Figure 10: North America USA Oil and Gas Market Volume Share (%), by Upstream 2024 & 2032
- Figure 11: North America USA Oil and Gas Market Revenue (Million), by Midstream 2024 & 2032
- Figure 12: North America USA Oil and Gas Market Volume (Tonnes), by Midstream 2024 & 2032
- Figure 13: North America USA Oil and Gas Market Revenue Share (%), by Midstream 2024 & 2032
- Figure 14: North America USA Oil and Gas Market Volume Share (%), by Midstream 2024 & 2032
- Figure 15: North America USA Oil and Gas Market Revenue (Million), by Downstream 2024 & 2032
- Figure 16: North America USA Oil and Gas Market Volume (Tonnes), by Downstream 2024 & 2032
- Figure 17: North America USA Oil and Gas Market Revenue Share (%), by Downstream 2024 & 2032
- Figure 18: North America USA Oil and Gas Market Volume Share (%), by Downstream 2024 & 2032
- Figure 19: North America USA Oil and Gas Market Revenue (Million), by Country 2024 & 2032
- Figure 20: North America USA Oil and Gas Market Volume (Tonnes), by Country 2024 & 2032
- Figure 21: North America USA Oil and Gas Market Revenue Share (%), by Country 2024 & 2032
- Figure 22: North America USA Oil and Gas Market Volume Share (%), by Country 2024 & 2032
- Figure 23: South America USA Oil and Gas Market Revenue (Million), by Upstream 2024 & 2032
- Figure 24: South America USA Oil and Gas Market Volume (Tonnes), by Upstream 2024 & 2032
- Figure 25: South America USA Oil and Gas Market Revenue Share (%), by Upstream 2024 & 2032
- Figure 26: South America USA Oil and Gas Market Volume Share (%), by Upstream 2024 & 2032
- Figure 27: South America USA Oil and Gas Market Revenue (Million), by Midstream 2024 & 2032
- Figure 28: South America USA Oil and Gas Market Volume (Tonnes), by Midstream 2024 & 2032
- Figure 29: South America USA Oil and Gas Market Revenue Share (%), by Midstream 2024 & 2032
- Figure 30: South America USA Oil and Gas Market Volume Share (%), by Midstream 2024 & 2032
- Figure 31: South America USA Oil and Gas Market Revenue (Million), by Downstream 2024 & 2032
- Figure 32: South America USA Oil and Gas Market Volume (Tonnes), by Downstream 2024 & 2032
- Figure 33: South America USA Oil and Gas Market Revenue Share (%), by Downstream 2024 & 2032
- Figure 34: South America USA Oil and Gas Market Volume Share (%), by Downstream 2024 & 2032
- Figure 35: South America USA Oil and Gas Market Revenue (Million), by Country 2024 & 2032
- Figure 36: South America USA Oil and Gas Market Volume (Tonnes), by Country 2024 & 2032
- Figure 37: South America USA Oil and Gas Market Revenue Share (%), by Country 2024 & 2032
- Figure 38: South America USA Oil and Gas Market Volume Share (%), by Country 2024 & 2032
- Figure 39: Europe USA Oil and Gas Market Revenue (Million), by Upstream 2024 & 2032
- Figure 40: Europe USA Oil and Gas Market Volume (Tonnes), by Upstream 2024 & 2032
- Figure 41: Europe USA Oil and Gas Market Revenue Share (%), by Upstream 2024 & 2032
- Figure 42: Europe USA Oil and Gas Market Volume Share (%), by Upstream 2024 & 2032
- Figure 43: Europe USA Oil and Gas Market Revenue (Million), by Midstream 2024 & 2032
- Figure 44: Europe USA Oil and Gas Market Volume (Tonnes), by Midstream 2024 & 2032
- Figure 45: Europe USA Oil and Gas Market Revenue Share (%), by Midstream 2024 & 2032
- Figure 46: Europe USA Oil and Gas Market Volume Share (%), by Midstream 2024 & 2032
- Figure 47: Europe USA Oil and Gas Market Revenue (Million), by Downstream 2024 & 2032
- Figure 48: Europe USA Oil and Gas Market Volume (Tonnes), by Downstream 2024 & 2032
- Figure 49: Europe USA Oil and Gas Market Revenue Share (%), by Downstream 2024 & 2032
- Figure 50: Europe USA Oil and Gas Market Volume Share (%), by Downstream 2024 & 2032
- Figure 51: Europe USA Oil and Gas Market Revenue (Million), by Country 2024 & 2032
- Figure 52: Europe USA Oil and Gas Market Volume (Tonnes), by Country 2024 & 2032
- Figure 53: Europe USA Oil and Gas Market Revenue Share (%), by Country 2024 & 2032
- Figure 54: Europe USA Oil and Gas Market Volume Share (%), by Country 2024 & 2032
- Figure 55: Middle East & Africa USA Oil and Gas Market Revenue (Million), by Upstream 2024 & 2032
- Figure 56: Middle East & Africa USA Oil and Gas Market Volume (Tonnes), by Upstream 2024 & 2032
- Figure 57: Middle East & Africa USA Oil and Gas Market Revenue Share (%), by Upstream 2024 & 2032
- Figure 58: Middle East & Africa USA Oil and Gas Market Volume Share (%), by Upstream 2024 & 2032
- Figure 59: Middle East & Africa USA Oil and Gas Market Revenue (Million), by Midstream 2024 & 2032
- Figure 60: Middle East & Africa USA Oil and Gas Market Volume (Tonnes), by Midstream 2024 & 2032
- Figure 61: Middle East & Africa USA Oil and Gas Market Revenue Share (%), by Midstream 2024 & 2032
- Figure 62: Middle East & Africa USA Oil and Gas Market Volume Share (%), by Midstream 2024 & 2032
- Figure 63: Middle East & Africa USA Oil and Gas Market Revenue (Million), by Downstream 2024 & 2032
- Figure 64: Middle East & Africa USA Oil and Gas Market Volume (Tonnes), by Downstream 2024 & 2032
- Figure 65: Middle East & Africa USA Oil and Gas Market Revenue Share (%), by Downstream 2024 & 2032
- Figure 66: Middle East & Africa USA Oil and Gas Market Volume Share (%), by Downstream 2024 & 2032
- Figure 67: Middle East & Africa USA Oil and Gas Market Revenue (Million), by Country 2024 & 2032
- Figure 68: Middle East & Africa USA Oil and Gas Market Volume (Tonnes), by Country 2024 & 2032
- Figure 69: Middle East & Africa USA Oil and Gas Market Revenue Share (%), by Country 2024 & 2032
- Figure 70: Middle East & Africa USA Oil and Gas Market Volume Share (%), by Country 2024 & 2032
- Figure 71: Asia Pacific USA Oil and Gas Market Revenue (Million), by Upstream 2024 & 2032
- Figure 72: Asia Pacific USA Oil and Gas Market Volume (Tonnes), by Upstream 2024 & 2032
- Figure 73: Asia Pacific USA Oil and Gas Market Revenue Share (%), by Upstream 2024 & 2032
- Figure 74: Asia Pacific USA Oil and Gas Market Volume Share (%), by Upstream 2024 & 2032
- Figure 75: Asia Pacific USA Oil and Gas Market Revenue (Million), by Midstream 2024 & 2032
- Figure 76: Asia Pacific USA Oil and Gas Market Volume (Tonnes), by Midstream 2024 & 2032
- Figure 77: Asia Pacific USA Oil and Gas Market Revenue Share (%), by Midstream 2024 & 2032
- Figure 78: Asia Pacific USA Oil and Gas Market Volume Share (%), by Midstream 2024 & 2032
- Figure 79: Asia Pacific USA Oil and Gas Market Revenue (Million), by Downstream 2024 & 2032
- Figure 80: Asia Pacific USA Oil and Gas Market Volume (Tonnes), by Downstream 2024 & 2032
- Figure 81: Asia Pacific USA Oil and Gas Market Revenue Share (%), by Downstream 2024 & 2032
- Figure 82: Asia Pacific USA Oil and Gas Market Volume Share (%), by Downstream 2024 & 2032
- Figure 83: Asia Pacific USA Oil and Gas Market Revenue (Million), by Country 2024 & 2032
- Figure 84: Asia Pacific USA Oil and Gas Market Volume (Tonnes), by Country 2024 & 2032
- Figure 85: Asia Pacific USA Oil and Gas Market Revenue Share (%), by Country 2024 & 2032
- Figure 86: Asia Pacific USA Oil and Gas Market Volume Share (%), by Country 2024 & 2032
List of Tables
- Table 1: Global USA Oil and Gas Market Revenue Million Forecast, by Region 2019 & 2032
- Table 2: Global USA Oil and Gas Market Volume Tonnes Forecast, by Region 2019 & 2032
- Table 3: Global USA Oil and Gas Market Revenue Million Forecast, by Upstream 2019 & 2032
- Table 4: Global USA Oil and Gas Market Volume Tonnes Forecast, by Upstream 2019 & 2032
- Table 5: Global USA Oil and Gas Market Revenue Million Forecast, by Midstream 2019 & 2032
- Table 6: Global USA Oil and Gas Market Volume Tonnes Forecast, by Midstream 2019 & 2032
- Table 7: Global USA Oil and Gas Market Revenue Million Forecast, by Downstream 2019 & 2032
- Table 8: Global USA Oil and Gas Market Volume Tonnes Forecast, by Downstream 2019 & 2032
- Table 9: Global USA Oil and Gas Market Revenue Million Forecast, by Region 2019 & 2032
- Table 10: Global USA Oil and Gas Market Volume Tonnes Forecast, by Region 2019 & 2032
- Table 11: Global USA Oil and Gas Market Revenue Million Forecast, by Country 2019 & 2032
- Table 12: Global USA Oil and Gas Market Volume Tonnes Forecast, by Country 2019 & 2032
- Table 13: Northeast USA Oil and Gas Market Revenue (Million) Forecast, by Application 2019 & 2032
- Table 14: Northeast USA Oil and Gas Market Volume (Tonnes) Forecast, by Application 2019 & 2032
- Table 15: Southeast USA Oil and Gas Market Revenue (Million) Forecast, by Application 2019 & 2032
- Table 16: Southeast USA Oil and Gas Market Volume (Tonnes) Forecast, by Application 2019 & 2032
- Table 17: Midwest USA Oil and Gas Market Revenue (Million) Forecast, by Application 2019 & 2032
- Table 18: Midwest USA Oil and Gas Market Volume (Tonnes) Forecast, by Application 2019 & 2032
- Table 19: Southwest USA Oil and Gas Market Revenue (Million) Forecast, by Application 2019 & 2032
- Table 20: Southwest USA Oil and Gas Market Volume (Tonnes) Forecast, by Application 2019 & 2032
- Table 21: West USA Oil and Gas Market Revenue (Million) Forecast, by Application 2019 & 2032
- Table 22: West USA Oil and Gas Market Volume (Tonnes) Forecast, by Application 2019 & 2032
- Table 23: Global USA Oil and Gas Market Revenue Million Forecast, by Upstream 2019 & 2032
- Table 24: Global USA Oil and Gas Market Volume Tonnes Forecast, by Upstream 2019 & 2032
- Table 25: Global USA Oil and Gas Market Revenue Million Forecast, by Midstream 2019 & 2032
- Table 26: Global USA Oil and Gas Market Volume Tonnes Forecast, by Midstream 2019 & 2032
- Table 27: Global USA Oil and Gas Market Revenue Million Forecast, by Downstream 2019 & 2032
- Table 28: Global USA Oil and Gas Market Volume Tonnes Forecast, by Downstream 2019 & 2032
- Table 29: Global USA Oil and Gas Market Revenue Million Forecast, by Country 2019 & 2032
- Table 30: Global USA Oil and Gas Market Volume Tonnes Forecast, by Country 2019 & 2032
- Table 31: United States USA Oil and Gas Market Revenue (Million) Forecast, by Application 2019 & 2032
- Table 32: United States USA Oil and Gas Market Volume (Tonnes) Forecast, by Application 2019 & 2032
- Table 33: Canada USA Oil and Gas Market Revenue (Million) Forecast, by Application 2019 & 2032
- Table 34: Canada USA Oil and Gas Market Volume (Tonnes) Forecast, by Application 2019 & 2032
- Table 35: Mexico USA Oil and Gas Market Revenue (Million) Forecast, by Application 2019 & 2032
- Table 36: Mexico USA Oil and Gas Market Volume (Tonnes) Forecast, by Application 2019 & 2032
- Table 37: Global USA Oil and Gas Market Revenue Million Forecast, by Upstream 2019 & 2032
- Table 38: Global USA Oil and Gas Market Volume Tonnes Forecast, by Upstream 2019 & 2032
- Table 39: Global USA Oil and Gas Market Revenue Million Forecast, by Midstream 2019 & 2032
- Table 40: Global USA Oil and Gas Market Volume Tonnes Forecast, by Midstream 2019 & 2032
- Table 41: Global USA Oil and Gas Market Revenue Million Forecast, by Downstream 2019 & 2032
- Table 42: Global USA Oil and Gas Market Volume Tonnes Forecast, by Downstream 2019 & 2032
- Table 43: Global USA Oil and Gas Market Revenue Million Forecast, by Country 2019 & 2032
- Table 44: Global USA Oil and Gas Market Volume Tonnes Forecast, by Country 2019 & 2032
- Table 45: Brazil USA Oil and Gas Market Revenue (Million) Forecast, by Application 2019 & 2032
- Table 46: Brazil USA Oil and Gas Market Volume (Tonnes) Forecast, by Application 2019 & 2032
- Table 47: Argentina USA Oil and Gas Market Revenue (Million) Forecast, by Application 2019 & 2032
- Table 48: Argentina USA Oil and Gas Market Volume (Tonnes) Forecast, by Application 2019 & 2032
- Table 49: Rest of South America USA Oil and Gas Market Revenue (Million) Forecast, by Application 2019 & 2032
- Table 50: Rest of South America USA Oil and Gas Market Volume (Tonnes) Forecast, by Application 2019 & 2032
- Table 51: Global USA Oil and Gas Market Revenue Million Forecast, by Upstream 2019 & 2032
- Table 52: Global USA Oil and Gas Market Volume Tonnes Forecast, by Upstream 2019 & 2032
- Table 53: Global USA Oil and Gas Market Revenue Million Forecast, by Midstream 2019 & 2032
- Table 54: Global USA Oil and Gas Market Volume Tonnes Forecast, by Midstream 2019 & 2032
- Table 55: Global USA Oil and Gas Market Revenue Million Forecast, by Downstream 2019 & 2032
- Table 56: Global USA Oil and Gas Market Volume Tonnes Forecast, by Downstream 2019 & 2032
- Table 57: Global USA Oil and Gas Market Revenue Million Forecast, by Country 2019 & 2032
- Table 58: Global USA Oil and Gas Market Volume Tonnes Forecast, by Country 2019 & 2032
- Table 59: United Kingdom USA Oil and Gas Market Revenue (Million) Forecast, by Application 2019 & 2032
- Table 60: United Kingdom USA Oil and Gas Market Volume (Tonnes) Forecast, by Application 2019 & 2032
- Table 61: Germany USA Oil and Gas Market Revenue (Million) Forecast, by Application 2019 & 2032
- Table 62: Germany USA Oil and Gas Market Volume (Tonnes) Forecast, by Application 2019 & 2032
- Table 63: France USA Oil and Gas Market Revenue (Million) Forecast, by Application 2019 & 2032
- Table 64: France USA Oil and Gas Market Volume (Tonnes) Forecast, by Application 2019 & 2032
- Table 65: Italy USA Oil and Gas Market Revenue (Million) Forecast, by Application 2019 & 2032
- Table 66: Italy USA Oil and Gas Market Volume (Tonnes) Forecast, by Application 2019 & 2032
- Table 67: Spain USA Oil and Gas Market Revenue (Million) Forecast, by Application 2019 & 2032
- Table 68: Spain USA Oil and Gas Market Volume (Tonnes) Forecast, by Application 2019 & 2032
- Table 69: Russia USA Oil and Gas Market Revenue (Million) Forecast, by Application 2019 & 2032
- Table 70: Russia USA Oil and Gas Market Volume (Tonnes) Forecast, by Application 2019 & 2032
- Table 71: Benelux USA Oil and Gas Market Revenue (Million) Forecast, by Application 2019 & 2032
- Table 72: Benelux USA Oil and Gas Market Volume (Tonnes) Forecast, by Application 2019 & 2032
- Table 73: Nordics USA Oil and Gas Market Revenue (Million) Forecast, by Application 2019 & 2032
- Table 74: Nordics USA Oil and Gas Market Volume (Tonnes) Forecast, by Application 2019 & 2032
- Table 75: Rest of Europe USA Oil and Gas Market Revenue (Million) Forecast, by Application 2019 & 2032
- Table 76: Rest of Europe USA Oil and Gas Market Volume (Tonnes) Forecast, by Application 2019 & 2032
- Table 77: Global USA Oil and Gas Market Revenue Million Forecast, by Upstream 2019 & 2032
- Table 78: Global USA Oil and Gas Market Volume Tonnes Forecast, by Upstream 2019 & 2032
- Table 79: Global USA Oil and Gas Market Revenue Million Forecast, by Midstream 2019 & 2032
- Table 80: Global USA Oil and Gas Market Volume Tonnes Forecast, by Midstream 2019 & 2032
- Table 81: Global USA Oil and Gas Market Revenue Million Forecast, by Downstream 2019 & 2032
- Table 82: Global USA Oil and Gas Market Volume Tonnes Forecast, by Downstream 2019 & 2032
- Table 83: Global USA Oil and Gas Market Revenue Million Forecast, by Country 2019 & 2032
- Table 84: Global USA Oil and Gas Market Volume Tonnes Forecast, by Country 2019 & 2032
- Table 85: Turkey USA Oil and Gas Market Revenue (Million) Forecast, by Application 2019 & 2032
- Table 86: Turkey USA Oil and Gas Market Volume (Tonnes) Forecast, by Application 2019 & 2032
- Table 87: Israel USA Oil and Gas Market Revenue (Million) Forecast, by Application 2019 & 2032
- Table 88: Israel USA Oil and Gas Market Volume (Tonnes) Forecast, by Application 2019 & 2032
- Table 89: GCC USA Oil and Gas Market Revenue (Million) Forecast, by Application 2019 & 2032
- Table 90: GCC USA Oil and Gas Market Volume (Tonnes) Forecast, by Application 2019 & 2032
- Table 91: North Africa USA Oil and Gas Market Revenue (Million) Forecast, by Application 2019 & 2032
- Table 92: North Africa USA Oil and Gas Market Volume (Tonnes) Forecast, by Application 2019 & 2032
- Table 93: South Africa USA Oil and Gas Market Revenue (Million) Forecast, by Application 2019 & 2032
- Table 94: South Africa USA Oil and Gas Market Volume (Tonnes) Forecast, by Application 2019 & 2032
- Table 95: Rest of Middle East & Africa USA Oil and Gas Market Revenue (Million) Forecast, by Application 2019 & 2032
- Table 96: Rest of Middle East & Africa USA Oil and Gas Market Volume (Tonnes) Forecast, by Application 2019 & 2032
- Table 97: Global USA Oil and Gas Market Revenue Million Forecast, by Upstream 2019 & 2032
- Table 98: Global USA Oil and Gas Market Volume Tonnes Forecast, by Upstream 2019 & 2032
- Table 99: Global USA Oil and Gas Market Revenue Million Forecast, by Midstream 2019 & 2032
- Table 100: Global USA Oil and Gas Market Volume Tonnes Forecast, by Midstream 2019 & 2032
- Table 101: Global USA Oil and Gas Market Revenue Million Forecast, by Downstream 2019 & 2032
- Table 102: Global USA Oil and Gas Market Volume Tonnes Forecast, by Downstream 2019 & 2032
- Table 103: Global USA Oil and Gas Market Revenue Million Forecast, by Country 2019 & 2032
- Table 104: Global USA Oil and Gas Market Volume Tonnes Forecast, by Country 2019 & 2032
- Table 105: China USA Oil and Gas Market Revenue (Million) Forecast, by Application 2019 & 2032
- Table 106: China USA Oil and Gas Market Volume (Tonnes) Forecast, by Application 2019 & 2032
- Table 107: India USA Oil and Gas Market Revenue (Million) Forecast, by Application 2019 & 2032
- Table 108: India USA Oil and Gas Market Volume (Tonnes) Forecast, by Application 2019 & 2032
- Table 109: Japan USA Oil and Gas Market Revenue (Million) Forecast, by Application 2019 & 2032
- Table 110: Japan USA Oil and Gas Market Volume (Tonnes) Forecast, by Application 2019 & 2032
- Table 111: South Korea USA Oil and Gas Market Revenue (Million) Forecast, by Application 2019 & 2032
- Table 112: South Korea USA Oil and Gas Market Volume (Tonnes) Forecast, by Application 2019 & 2032
- Table 113: ASEAN USA Oil and Gas Market Revenue (Million) Forecast, by Application 2019 & 2032
- Table 114: ASEAN USA Oil and Gas Market Volume (Tonnes) Forecast, by Application 2019 & 2032
- Table 115: Oceania USA Oil and Gas Market Revenue (Million) Forecast, by Application 2019 & 2032
- Table 116: Oceania USA Oil and Gas Market Volume (Tonnes) Forecast, by Application 2019 & 2032
- Table 117: Rest of Asia Pacific USA Oil and Gas Market Revenue (Million) Forecast, by Application 2019 & 2032
- Table 118: Rest of Asia Pacific USA Oil and Gas Market Volume (Tonnes) Forecast, by Application 2019 & 2032
Frequently Asked Questions
1. What is the projected Compound Annual Growth Rate (CAGR) of the USA Oil and Gas Market?
The projected CAGR is approximately > 4.00%.
2. Which companies are prominent players in the USA Oil and Gas Market?
Key companies in the market include Shell PLC, Hess Corporation, ExxonMobil Corporation, Marathon Petroleum Corporation, Occidental Petroleum, Chevron Corporation, ConocoPhillips Company, Valero Energy, EOG Resources, Total Energies SE, Phillips, BP PLC.
3. What are the main segments of the USA Oil and Gas Market?
The market segments include Upstream, Midstream, Downstream.
4. Can you provide details about the market size?
The market size is estimated to be USD XX Million as of 2022.
5. What are some drivers contributing to market growth?
4.; Modernization and Upgrades of Existing Military Aircraft Fleets4.; Increasing Defense Budgets.
6. What are the notable trends driving market growth?
Upstream Sector Expected Witness Significant Growth.
7. Are there any restraints impacting market growth?
4.; Shift Toward Unmanned Aircraft.
8. Can you provide examples of recent developments in the market?
March 2022: The United States' President Joe Biden agreed to a landmark energy supply deal with the European Union. Under this deal, the United States was expected to increase transatlantic gas deliveries. This deal is important to reduce dependence on Russia after the Russia-Ukraine War.
9. What pricing options are available for accessing the report?
Pricing options include single-user, multi-user, and enterprise licenses priced at USD 3800, USD 4500, and USD 5800 respectively.
10. Is the market size provided in terms of value or volume?
The market size is provided in terms of value, measured in Million and volume, measured in Tonnes.
11. Are there any specific market keywords associated with the report?
Yes, the market keyword associated with the report is "USA Oil and Gas Market," which aids in identifying and referencing the specific market segment covered.
12. How do I determine which pricing option suits my needs best?
The pricing options vary based on user requirements and access needs. Individual users may opt for single-user licenses, while businesses requiring broader access may choose multi-user or enterprise licenses for cost-effective access to the report.
13. Are there any additional resources or data provided in the USA Oil and Gas Market report?
While the report offers comprehensive insights, it's advisable to review the specific contents or supplementary materials provided to ascertain if additional resources or data are available.
14. How can I stay updated on further developments or reports in the USA Oil and Gas Market?
To stay informed about further developments, trends, and reports in the USA Oil and Gas Market, consider subscribing to industry newsletters, following relevant companies and organizations, or regularly checking reputable industry news sources and publications.
Methodology
Step 1 - Identification of Relevant Samples Size from Population Database


Step 2 - Approaches for Defining Global Market Size (Value, Volume* & Price*)

Note*: In applicable scenarios
Step 3 - Data Sources
Primary Research
- Web Analytics
- Survey Reports
- Research Institute
- Latest Research Reports
- Opinion Leaders
Secondary Research
- Annual Reports
- White Paper
- Latest Press Release
- Industry Association
- Paid Database
- Investor Presentations

Step 4 - Data Triangulation
Involves using different sources of information in order to increase the validity of a study
These sources are likely to be stakeholders in a program - participants, other researchers, program staff, other community members, and so on.
Then we put all data in single framework & apply various statistical tools to find out the dynamic on the market.
During the analysis stage, feedback from the stakeholder groups would be compared to determine areas of agreement as well as areas of divergence


