
Key Insights
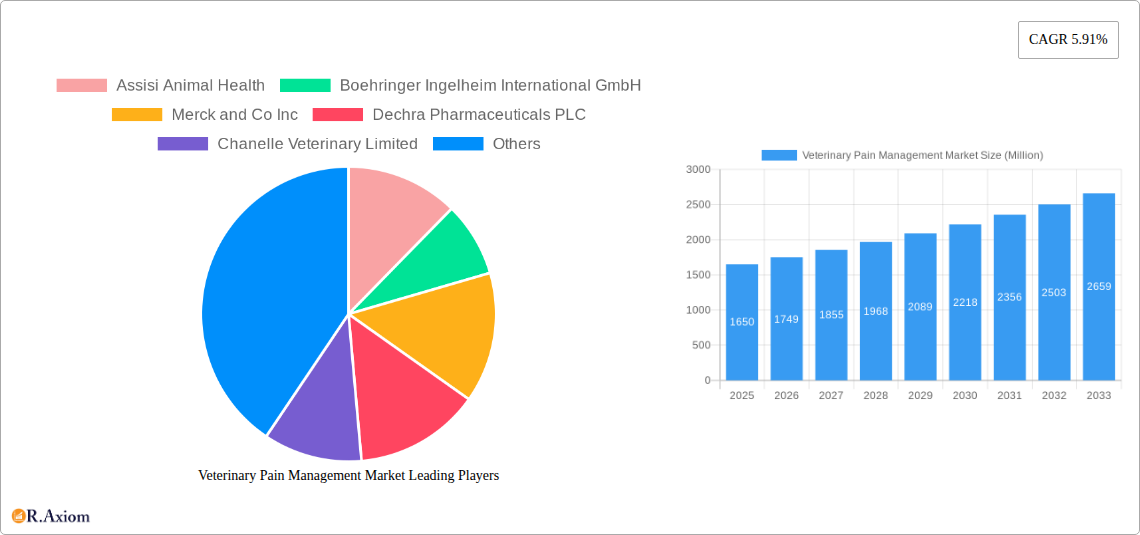
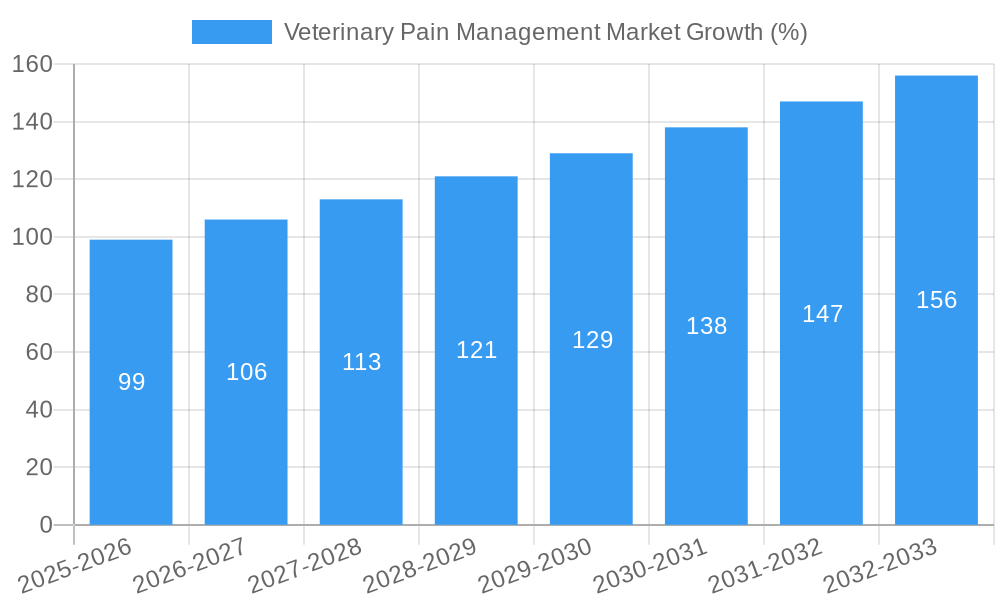
The global veterinary pain management market, valued at $1.65 billion in 2025, is projected to experience robust growth, driven by a rising pet population, increasing pet humanization, and a greater awareness of animal welfare. The market's compound annual growth rate (CAGR) of 5.91% from 2019 to 2024 indicates a steady expansion, expected to continue through 2033. Key drivers include the increasing availability of advanced analgesic drugs, such as NSAIDs and opioids tailored for specific animal species, and the rising adoption of minimally invasive surgical techniques. Technological advancements in pain management, including laser therapy and other innovative devices, are further contributing to market growth. The segment analysis reveals a strong presence of companion animal applications, particularly for osteoarthritis and post-operative pain, reflecting the increasing focus on improving the quality of life for pets. However, potential restraints include stringent regulatory approvals for new drugs and devices, variations in veterinary practices across regions, and concerns regarding the side effects of certain pain medications.
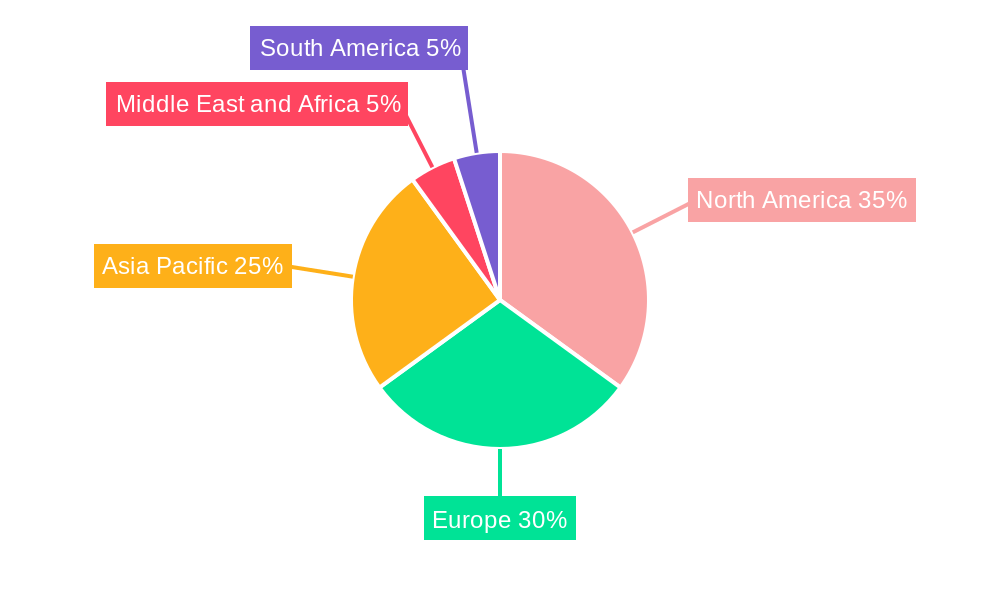
The market's segmentation highlights diverse growth opportunities. The companion animal segment dominates, fueled by rising pet ownership and expenditure on pet healthcare. Within this segment, osteoarthritis and post-operative pain management are the largest applications. The livestock segment, while smaller, shows potential for growth driven by increasing efficiency demands in agricultural practices and the rising focus on animal welfare in livestock production. Geographically, North America and Europe currently hold significant market shares, owing to established veterinary infrastructure and high pet ownership rates. However, Asia-Pacific is anticipated to witness faster growth in the coming years, driven by rising disposable incomes and increasing awareness regarding animal health. Key players, including Zoetis Inc., Elanco Animal Health Incorporated, and Boehringer Ingelheim International GmbH, are actively involved in R&D and market expansion, further bolstering market growth. Overall, the veterinary pain management market presents a promising investment landscape for businesses capitalizing on advancements in pain management technology and growing animal welfare concerns.
This comprehensive report provides a detailed analysis of the Veterinary Pain Management Market, offering invaluable insights for stakeholders across the industry. Covering the period from 2019 to 2033, with a focus on 2025, this report examines market dynamics, segmentation, key players, and future growth potential. The study period spans 2019-2024 (historical), with the base year being 2025 and the forecast period stretching from 2025 to 2033.
Veterinary Pain Management Market Concentration & Innovation
The veterinary pain management market exhibits a moderately concentrated landscape, with key players like Zoetis Inc, Elanco Animal Health Incorporated, and Boehringer Ingelheim International GmbH holding significant market share. Precise market share figures vary by segment and are detailed within the full report. However, we project a consolidated market share for the top 5 players to be approximately xx% in 2025. Innovation is driven by the increasing demand for more effective and safer analgesics, particularly for chronic pain conditions like osteoarthritis. This fuels investment in research and development of novel drug formulations, targeted therapies, and advanced medical devices.
Regulatory frameworks, such as those set by the FDA (in the US) and equivalent bodies globally, play a vital role in shaping product development and market access. The presence of substitute products, including alternative pain management therapies and traditional remedies, exerts competitive pressure. End-user trends show a growing preference for minimally invasive procedures and improved patient outcomes, influencing treatment strategies. Finally, mergers and acquisitions (M&A) activities, as observed with recent industry deals valued at xx Million (data specific to 2019-2024 detailed within), have further shaped the market landscape, leading to consolidation and increased competitiveness.
Veterinary Pain Management Market Industry Trends & Insights
The veterinary pain management market is experiencing robust growth, driven by several key factors. Increasing pet ownership globally, coupled with rising pet healthcare expenditure, significantly fuels demand. Technological advancements in pain management techniques, such as minimally invasive procedures and advanced drug delivery systems, further enhance market growth. The growing awareness of animal welfare and the associated need for effective pain management among veterinarians and pet owners are crucial factors. A shift in consumer preferences towards more holistic and natural pain management approaches is also observed, creating opportunities for targeted product development.
Competitive dynamics remain intense, with established players and new entrants vying for market share. This leads to continuous product innovation, pricing strategies, and strategic partnerships. We estimate a compound annual growth rate (CAGR) of xx% for the period 2025-2033, exceeding the previous period due to increasing awareness and development of new products. Market penetration for advanced pain management solutions is expected to increase from xx% in 2025 to approximately xx% by 2033.
Dominant Markets & Segments in Veterinary Pain Management Market
The companion animal segment (dogs and cats) dominates the market, driven by high pet ownership rates and increased spending on their healthcare. Geographically, North America and Europe are currently leading markets, owing to high veterinary infrastructure and consumer awareness. Within the product segment, drugs hold the largest market share, followed by devices.
- Key Drivers for Companion Animal Segment: High pet ownership, increasing disposable incomes, and rising awareness of animal welfare.
- Key Drivers for North America and Europe: Established veterinary infrastructure, high per capita healthcare spending, and stringent regulatory frameworks.
- Osteoarthritis and Joint Pain Application: This application segment is leading due to the high prevalence of age-related joint conditions in companion animals.
Detailed market size breakdowns for each segment are provided in the full report.
Veterinary Pain Management Market Product Developments
Recent product developments reflect a clear trend towards more targeted, effective, and safer analgesics. This includes the development of novel drug formulations with improved bioavailability and reduced side effects. Advanced drug delivery systems, such as transdermal patches and implantable devices, are also gaining traction, improving treatment compliance and patient comfort. The integration of technology, such as telemedicine platforms and remote monitoring devices, enhances pain management outcomes. These innovations demonstrate a strong focus on meeting unmet needs within the market.
Report Scope & Segmentation Analysis
This report segments the veterinary pain management market based on product type (Drugs, Devices), application (Osteoarthritis and Joint Pain, Postoperative Pain, Cancer, Other Applications), animal type (Companion, Livestock), and end-user (Hospitals and Clinics, Retail Outlet, Others). Each segment’s growth projections, market size, and competitive dynamics are analyzed in detail.
- Product: The drug segment is projected to maintain its dominance due to the efficacy and wide availability of various analgesic medications.
- Application: Osteoarthritis and Joint Pain are forecast to dominate, driven by the high prevalence of this condition in older pets.
- Animal Type: Companion animals will continue to be the main revenue driver due to increased pet ownership and healthcare spending.
- End-User: Hospitals and clinics will continue to be major revenue contributors but the retail outlet segment is expected to grow at a faster rate.
Key Drivers of Veterinary Pain Management Market Growth
Several factors contribute to the market's growth. Technological advancements in drug delivery and diagnostic tools improve treatment efficacy. Economic factors such as increasing disposable incomes and pet insurance penetration drive higher veterinary healthcare spending. Favorable regulatory environments promote innovation and market entry of new products, driving further growth in the veterinary pain management sector.
Challenges in the Veterinary Pain Management Market Sector
Challenges include stringent regulatory approvals for new drugs and devices, increasing competition from generic drugs, and fluctuating raw material prices impacting manufacturing costs. Supply chain disruptions caused by geopolitical instability or pandemics may also impact product availability and prices, potentially impacting the market growth trajectory by approximately xx Million annually.
Emerging Opportunities in Veterinary Pain Management Market
Emerging opportunities include the development of personalized medicine approaches, leveraging genomics and other technologies to tailor pain management strategies to individual animals. There’s also increasing potential in expanding into new geographical markets, particularly in developing economies experiencing rising pet ownership. Additionally, the development of more effective and safer pain management solutions for livestock animals presents a significant growth opportunity.
Leading Players in the Veterinary Pain Management Market
- Assisi Animal Health
- Boehringer Ingelheim International GmbH [Boehringer Ingelheim]
- Merck and Co Inc [Merck]
- Dechra Pharmaceuticals PLC [Dechra]
- Chanelle Veterinary Limited
- Vetoquinol SA [Vetoquinol]
- Norbrook
- Eltech K-Laser SRL
- Ceva Sante Animale [Ceva]
- Elanco Animal Health Incorporated [Elanco]
- Zoetis Inc [Zoetis]
Key Developments in Veterinary Pain Management Market Industry
- September 2022: Zoetis launched Solensia to manage feline osteoarthritis pain in the United States, significantly expanding treatment options and market potential.
- April 2022: FDA approval of medetomidine and vatinoxan hydrochlorides injection broadened the available analgesics for dogs, impacting procedural pain management.
Strategic Outlook for Veterinary Pain Management Market
The veterinary pain management market is poised for continued growth, driven by factors such as increasing pet ownership, rising healthcare expenditure, and advancements in pain management technologies. Strategic opportunities exist in developing innovative products, expanding into underserved markets, and forging strategic partnerships to consolidate market share. The focus on personalized medicine and preventative care will further shape the industry's future.
Veterinary Pain Management Market Segmentation
-
1. Product
-
1.1. Drugs
- 1.1.1. NSAIDs
- 1.1.2. Anesthetics
- 1.1.3. Opioids
- 1.1.4. Other Drugs
-
1.2. Devices
- 1.2.1. Laser Therapy
- 1.2.2. Electromagnetic Therapy
-
1.1. Drugs
-
2. Application
- 2.1. Osteoarthritis and Joint Pain
- 2.2. Postoperative Pain
- 2.3. Cancer
- 2.4. Other Applications
-
3. Animal Type
- 3.1. Companion
- 3.2. Livestock
-
4. End User
- 4.1. Hospitals and Clinics
- 4.2. Retail Outlet and Others
Veterinary Pain Management Market Segmentation By Geography
-
1. North America
- 1.1. United States
- 1.2. Canada
- 1.3. Mexico
-
2. Europe
- 2.1. Germany
- 2.2. United Kingdom
- 2.3. France
- 2.4. Italy
- 2.5. Spain
- 2.6. Rest of Europe
-
3. Asia Pacific
- 3.1. China
- 3.2. Japan
- 3.3. India
- 3.4. Australia
- 3.5. South Korea
- 3.6. Rest of Asia Pacific
-
4. Middle East and Africa
- 4.1. GCC
- 4.2. South Africa
- 4.3. Rest of Middle East and Africa
-
5. South America
- 5.1. Brazil
- 5.2. Argentina
- 5.3. Rest of South America
Veterinary Pain Management Market REPORT HIGHLIGHTS
| Aspects | Details |
|---|---|
| Study Period | 2019-2033 |
| Base Year | 2024 |
| Estimated Year | 2025 |
| Forecast Period | 2025-2033 |
| Historical Period | 2019-2024 |
| Growth Rate | CAGR of 5.91% from 2019-2033 |
| Segmentation |
|
Table of Contents
- 1. Introduction
- 1.1. Research Scope
- 1.2. Market Segmentation
- 1.3. Research Methodology
- 1.4. Definitions and Assumptions
- 2. Executive Summary
- 2.1. Introduction
- 3. Market Dynamics
- 3.1. Introduction
- 3.2. Market Drivers
- 3.2.1. Growth in Prevalence of Painful and Inflammatory Diseases in Animals; Rise in Need for Easily Accessible and Affordable Treatment Options; Increase in Awareness about Animal Health and Welfare
- 3.3. Market Restrains
- 3.3.1. Side Effects Associated With Treatment and High Cost of Certain Products
- 3.4. Market Trends
- 3.4.1. Laser Therapy is Expected to Witness Considerable Growth Over the Forecast Period
- 4. Market Factor Analysis
- 4.1. Porters Five Forces
- 4.2. Supply/Value Chain
- 4.3. PESTEL analysis
- 4.4. Market Entropy
- 4.5. Patent/Trademark Analysis
- 5. Global Veterinary Pain Management Market Analysis, Insights and Forecast, 2019-2031
- 5.1. Market Analysis, Insights and Forecast - by Product
- 5.1.1. Drugs
- 5.1.1.1. NSAIDs
- 5.1.1.2. Anesthetics
- 5.1.1.3. Opioids
- 5.1.1.4. Other Drugs
- 5.1.2. Devices
- 5.1.2.1. Laser Therapy
- 5.1.2.2. Electromagnetic Therapy
- 5.1.1. Drugs
- 5.2. Market Analysis, Insights and Forecast - by Application
- 5.2.1. Osteoarthritis and Joint Pain
- 5.2.2. Postoperative Pain
- 5.2.3. Cancer
- 5.2.4. Other Applications
- 5.3. Market Analysis, Insights and Forecast - by Animal Type
- 5.3.1. Companion
- 5.3.2. Livestock
- 5.4. Market Analysis, Insights and Forecast - by End User
- 5.4.1. Hospitals and Clinics
- 5.4.2. Retail Outlet and Others
- 5.5. Market Analysis, Insights and Forecast - by Region
- 5.5.1. North America
- 5.5.2. Europe
- 5.5.3. Asia Pacific
- 5.5.4. Middle East and Africa
- 5.5.5. South America
- 5.1. Market Analysis, Insights and Forecast - by Product
- 6. North America Veterinary Pain Management Market Analysis, Insights and Forecast, 2019-2031
- 6.1. Market Analysis, Insights and Forecast - by Product
- 6.1.1. Drugs
- 6.1.1.1. NSAIDs
- 6.1.1.2. Anesthetics
- 6.1.1.3. Opioids
- 6.1.1.4. Other Drugs
- 6.1.2. Devices
- 6.1.2.1. Laser Therapy
- 6.1.2.2. Electromagnetic Therapy
- 6.1.1. Drugs
- 6.2. Market Analysis, Insights and Forecast - by Application
- 6.2.1. Osteoarthritis and Joint Pain
- 6.2.2. Postoperative Pain
- 6.2.3. Cancer
- 6.2.4. Other Applications
- 6.3. Market Analysis, Insights and Forecast - by Animal Type
- 6.3.1. Companion
- 6.3.2. Livestock
- 6.4. Market Analysis, Insights and Forecast - by End User
- 6.4.1. Hospitals and Clinics
- 6.4.2. Retail Outlet and Others
- 6.1. Market Analysis, Insights and Forecast - by Product
- 7. Europe Veterinary Pain Management Market Analysis, Insights and Forecast, 2019-2031
- 7.1. Market Analysis, Insights and Forecast - by Product
- 7.1.1. Drugs
- 7.1.1.1. NSAIDs
- 7.1.1.2. Anesthetics
- 7.1.1.3. Opioids
- 7.1.1.4. Other Drugs
- 7.1.2. Devices
- 7.1.2.1. Laser Therapy
- 7.1.2.2. Electromagnetic Therapy
- 7.1.1. Drugs
- 7.2. Market Analysis, Insights and Forecast - by Application
- 7.2.1. Osteoarthritis and Joint Pain
- 7.2.2. Postoperative Pain
- 7.2.3. Cancer
- 7.2.4. Other Applications
- 7.3. Market Analysis, Insights and Forecast - by Animal Type
- 7.3.1. Companion
- 7.3.2. Livestock
- 7.4. Market Analysis, Insights and Forecast - by End User
- 7.4.1. Hospitals and Clinics
- 7.4.2. Retail Outlet and Others
- 7.1. Market Analysis, Insights and Forecast - by Product
- 8. Asia Pacific Veterinary Pain Management Market Analysis, Insights and Forecast, 2019-2031
- 8.1. Market Analysis, Insights and Forecast - by Product
- 8.1.1. Drugs
- 8.1.1.1. NSAIDs
- 8.1.1.2. Anesthetics
- 8.1.1.3. Opioids
- 8.1.1.4. Other Drugs
- 8.1.2. Devices
- 8.1.2.1. Laser Therapy
- 8.1.2.2. Electromagnetic Therapy
- 8.1.1. Drugs
- 8.2. Market Analysis, Insights and Forecast - by Application
- 8.2.1. Osteoarthritis and Joint Pain
- 8.2.2. Postoperative Pain
- 8.2.3. Cancer
- 8.2.4. Other Applications
- 8.3. Market Analysis, Insights and Forecast - by Animal Type
- 8.3.1. Companion
- 8.3.2. Livestock
- 8.4. Market Analysis, Insights and Forecast - by End User
- 8.4.1. Hospitals and Clinics
- 8.4.2. Retail Outlet and Others
- 8.1. Market Analysis, Insights and Forecast - by Product
- 9. Middle East and Africa Veterinary Pain Management Market Analysis, Insights and Forecast, 2019-2031
- 9.1. Market Analysis, Insights and Forecast - by Product
- 9.1.1. Drugs
- 9.1.1.1. NSAIDs
- 9.1.1.2. Anesthetics
- 9.1.1.3. Opioids
- 9.1.1.4. Other Drugs
- 9.1.2. Devices
- 9.1.2.1. Laser Therapy
- 9.1.2.2. Electromagnetic Therapy
- 9.1.1. Drugs
- 9.2. Market Analysis, Insights and Forecast - by Application
- 9.2.1. Osteoarthritis and Joint Pain
- 9.2.2. Postoperative Pain
- 9.2.3. Cancer
- 9.2.4. Other Applications
- 9.3. Market Analysis, Insights and Forecast - by Animal Type
- 9.3.1. Companion
- 9.3.2. Livestock
- 9.4. Market Analysis, Insights and Forecast - by End User
- 9.4.1. Hospitals and Clinics
- 9.4.2. Retail Outlet and Others
- 9.1. Market Analysis, Insights and Forecast - by Product
- 10. South America Veterinary Pain Management Market Analysis, Insights and Forecast, 2019-2031
- 10.1. Market Analysis, Insights and Forecast - by Product
- 10.1.1. Drugs
- 10.1.1.1. NSAIDs
- 10.1.1.2. Anesthetics
- 10.1.1.3. Opioids
- 10.1.1.4. Other Drugs
- 10.1.2. Devices
- 10.1.2.1. Laser Therapy
- 10.1.2.2. Electromagnetic Therapy
- 10.1.1. Drugs
- 10.2. Market Analysis, Insights and Forecast - by Application
- 10.2.1. Osteoarthritis and Joint Pain
- 10.2.2. Postoperative Pain
- 10.2.3. Cancer
- 10.2.4. Other Applications
- 10.3. Market Analysis, Insights and Forecast - by Animal Type
- 10.3.1. Companion
- 10.3.2. Livestock
- 10.4. Market Analysis, Insights and Forecast - by End User
- 10.4.1. Hospitals and Clinics
- 10.4.2. Retail Outlet and Others
- 10.1. Market Analysis, Insights and Forecast - by Product
- 11. North America Veterinary Pain Management Market Analysis, Insights and Forecast, 2019-2031
- 11.1. Market Analysis, Insights and Forecast - By Country/Sub-region
- 11.1.1. undefined
- 12. Europe Veterinary Pain Management Market Analysis, Insights and Forecast, 2019-2031
- 12.1. Market Analysis, Insights and Forecast - By Country/Sub-region
- 12.1.1. undefined
- 13. Asia Pacific Veterinary Pain Management Market Analysis, Insights and Forecast, 2019-2031
- 13.1. Market Analysis, Insights and Forecast - By Country/Sub-region
- 13.1.1. undefined
- 14. Middle East and Africa Veterinary Pain Management Market Analysis, Insights and Forecast, 2019-2031
- 14.1. Market Analysis, Insights and Forecast - By Country/Sub-region
- 14.1.1. undefined
- 15. South America Veterinary Pain Management Market Analysis, Insights and Forecast, 2019-2031
- 15.1. Market Analysis, Insights and Forecast - By Country/Sub-region
- 15.1.1. undefined
- 16. Competitive Analysis
- 16.1. Global Market Share Analysis 2024
- 16.2. Company Profiles
- 16.2.1 Assisi Animal Health
- 16.2.1.1. Overview
- 16.2.1.2. Products
- 16.2.1.3. SWOT Analysis
- 16.2.1.4. Recent Developments
- 16.2.1.5. Financials (Based on Availability)
- 16.2.2 Boehringer Ingelheim International GmbH
- 16.2.2.1. Overview
- 16.2.2.2. Products
- 16.2.2.3. SWOT Analysis
- 16.2.2.4. Recent Developments
- 16.2.2.5. Financials (Based on Availability)
- 16.2.3 Merck and Co Inc
- 16.2.3.1. Overview
- 16.2.3.2. Products
- 16.2.3.3. SWOT Analysis
- 16.2.3.4. Recent Developments
- 16.2.3.5. Financials (Based on Availability)
- 16.2.4 Dechra Pharmaceuticals PLC
- 16.2.4.1. Overview
- 16.2.4.2. Products
- 16.2.4.3. SWOT Analysis
- 16.2.4.4. Recent Developments
- 16.2.4.5. Financials (Based on Availability)
- 16.2.5 Chanelle Veterinary Limited
- 16.2.5.1. Overview
- 16.2.5.2. Products
- 16.2.5.3. SWOT Analysis
- 16.2.5.4. Recent Developments
- 16.2.5.5. Financials (Based on Availability)
- 16.2.6 VetoquinolSA
- 16.2.6.1. Overview
- 16.2.6.2. Products
- 16.2.6.3. SWOT Analysis
- 16.2.6.4. Recent Developments
- 16.2.6.5. Financials (Based on Availability)
- 16.2.7 Norbrook
- 16.2.7.1. Overview
- 16.2.7.2. Products
- 16.2.7.3. SWOT Analysis
- 16.2.7.4. Recent Developments
- 16.2.7.5. Financials (Based on Availability)
- 16.2.8 Eltech K-Laser SRL
- 16.2.8.1. Overview
- 16.2.8.2. Products
- 16.2.8.3. SWOT Analysis
- 16.2.8.4. Recent Developments
- 16.2.8.5. Financials (Based on Availability)
- 16.2.9 Ceva Sante Animale
- 16.2.9.1. Overview
- 16.2.9.2. Products
- 16.2.9.3. SWOT Analysis
- 16.2.9.4. Recent Developments
- 16.2.9.5. Financials (Based on Availability)
- 16.2.10 Elanco Animal Health Incorporated
- 16.2.10.1. Overview
- 16.2.10.2. Products
- 16.2.10.3. SWOT Analysis
- 16.2.10.4. Recent Developments
- 16.2.10.5. Financials (Based on Availability)
- 16.2.11 Zoetis Inc
- 16.2.11.1. Overview
- 16.2.11.2. Products
- 16.2.11.3. SWOT Analysis
- 16.2.11.4. Recent Developments
- 16.2.11.5. Financials (Based on Availability)
- 16.2.1 Assisi Animal Health
List of Figures
- Figure 1: Global Veterinary Pain Management Market Revenue Breakdown (Million, %) by Region 2024 & 2032
- Figure 2: Global Veterinary Pain Management Market Volume Breakdown (K Unit, %) by Region 2024 & 2032
- Figure 3: North America Veterinary Pain Management Market Revenue (Million), by Country 2024 & 2032
- Figure 4: North America Veterinary Pain Management Market Volume (K Unit), by Country 2024 & 2032
- Figure 5: North America Veterinary Pain Management Market Revenue Share (%), by Country 2024 & 2032
- Figure 6: North America Veterinary Pain Management Market Volume Share (%), by Country 2024 & 2032
- Figure 7: Europe Veterinary Pain Management Market Revenue (Million), by Country 2024 & 2032
- Figure 8: Europe Veterinary Pain Management Market Volume (K Unit), by Country 2024 & 2032
- Figure 9: Europe Veterinary Pain Management Market Revenue Share (%), by Country 2024 & 2032
- Figure 10: Europe Veterinary Pain Management Market Volume Share (%), by Country 2024 & 2032
- Figure 11: Asia Pacific Veterinary Pain Management Market Revenue (Million), by Country 2024 & 2032
- Figure 12: Asia Pacific Veterinary Pain Management Market Volume (K Unit), by Country 2024 & 2032
- Figure 13: Asia Pacific Veterinary Pain Management Market Revenue Share (%), by Country 2024 & 2032
- Figure 14: Asia Pacific Veterinary Pain Management Market Volume Share (%), by Country 2024 & 2032
- Figure 15: Middle East and Africa Veterinary Pain Management Market Revenue (Million), by Country 2024 & 2032
- Figure 16: Middle East and Africa Veterinary Pain Management Market Volume (K Unit), by Country 2024 & 2032
- Figure 17: Middle East and Africa Veterinary Pain Management Market Revenue Share (%), by Country 2024 & 2032
- Figure 18: Middle East and Africa Veterinary Pain Management Market Volume Share (%), by Country 2024 & 2032
- Figure 19: South America Veterinary Pain Management Market Revenue (Million), by Country 2024 & 2032
- Figure 20: South America Veterinary Pain Management Market Volume (K Unit), by Country 2024 & 2032
- Figure 21: South America Veterinary Pain Management Market Revenue Share (%), by Country 2024 & 2032
- Figure 22: South America Veterinary Pain Management Market Volume Share (%), by Country 2024 & 2032
- Figure 23: North America Veterinary Pain Management Market Revenue (Million), by Product 2024 & 2032
- Figure 24: North America Veterinary Pain Management Market Volume (K Unit), by Product 2024 & 2032
- Figure 25: North America Veterinary Pain Management Market Revenue Share (%), by Product 2024 & 2032
- Figure 26: North America Veterinary Pain Management Market Volume Share (%), by Product 2024 & 2032
- Figure 27: North America Veterinary Pain Management Market Revenue (Million), by Application 2024 & 2032
- Figure 28: North America Veterinary Pain Management Market Volume (K Unit), by Application 2024 & 2032
- Figure 29: North America Veterinary Pain Management Market Revenue Share (%), by Application 2024 & 2032
- Figure 30: North America Veterinary Pain Management Market Volume Share (%), by Application 2024 & 2032
- Figure 31: North America Veterinary Pain Management Market Revenue (Million), by Animal Type 2024 & 2032
- Figure 32: North America Veterinary Pain Management Market Volume (K Unit), by Animal Type 2024 & 2032
- Figure 33: North America Veterinary Pain Management Market Revenue Share (%), by Animal Type 2024 & 2032
- Figure 34: North America Veterinary Pain Management Market Volume Share (%), by Animal Type 2024 & 2032
- Figure 35: North America Veterinary Pain Management Market Revenue (Million), by End User 2024 & 2032
- Figure 36: North America Veterinary Pain Management Market Volume (K Unit), by End User 2024 & 2032
- Figure 37: North America Veterinary Pain Management Market Revenue Share (%), by End User 2024 & 2032
- Figure 38: North America Veterinary Pain Management Market Volume Share (%), by End User 2024 & 2032
- Figure 39: North America Veterinary Pain Management Market Revenue (Million), by Country 2024 & 2032
- Figure 40: North America Veterinary Pain Management Market Volume (K Unit), by Country 2024 & 2032
- Figure 41: North America Veterinary Pain Management Market Revenue Share (%), by Country 2024 & 2032
- Figure 42: North America Veterinary Pain Management Market Volume Share (%), by Country 2024 & 2032
- Figure 43: Europe Veterinary Pain Management Market Revenue (Million), by Product 2024 & 2032
- Figure 44: Europe Veterinary Pain Management Market Volume (K Unit), by Product 2024 & 2032
- Figure 45: Europe Veterinary Pain Management Market Revenue Share (%), by Product 2024 & 2032
- Figure 46: Europe Veterinary Pain Management Market Volume Share (%), by Product 2024 & 2032
- Figure 47: Europe Veterinary Pain Management Market Revenue (Million), by Application 2024 & 2032
- Figure 48: Europe Veterinary Pain Management Market Volume (K Unit), by Application 2024 & 2032
- Figure 49: Europe Veterinary Pain Management Market Revenue Share (%), by Application 2024 & 2032
- Figure 50: Europe Veterinary Pain Management Market Volume Share (%), by Application 2024 & 2032
- Figure 51: Europe Veterinary Pain Management Market Revenue (Million), by Animal Type 2024 & 2032
- Figure 52: Europe Veterinary Pain Management Market Volume (K Unit), by Animal Type 2024 & 2032
- Figure 53: Europe Veterinary Pain Management Market Revenue Share (%), by Animal Type 2024 & 2032
- Figure 54: Europe Veterinary Pain Management Market Volume Share (%), by Animal Type 2024 & 2032
- Figure 55: Europe Veterinary Pain Management Market Revenue (Million), by End User 2024 & 2032
- Figure 56: Europe Veterinary Pain Management Market Volume (K Unit), by End User 2024 & 2032
- Figure 57: Europe Veterinary Pain Management Market Revenue Share (%), by End User 2024 & 2032
- Figure 58: Europe Veterinary Pain Management Market Volume Share (%), by End User 2024 & 2032
- Figure 59: Europe Veterinary Pain Management Market Revenue (Million), by Country 2024 & 2032
- Figure 60: Europe Veterinary Pain Management Market Volume (K Unit), by Country 2024 & 2032
- Figure 61: Europe Veterinary Pain Management Market Revenue Share (%), by Country 2024 & 2032
- Figure 62: Europe Veterinary Pain Management Market Volume Share (%), by Country 2024 & 2032
- Figure 63: Asia Pacific Veterinary Pain Management Market Revenue (Million), by Product 2024 & 2032
- Figure 64: Asia Pacific Veterinary Pain Management Market Volume (K Unit), by Product 2024 & 2032
- Figure 65: Asia Pacific Veterinary Pain Management Market Revenue Share (%), by Product 2024 & 2032
- Figure 66: Asia Pacific Veterinary Pain Management Market Volume Share (%), by Product 2024 & 2032
- Figure 67: Asia Pacific Veterinary Pain Management Market Revenue (Million), by Application 2024 & 2032
- Figure 68: Asia Pacific Veterinary Pain Management Market Volume (K Unit), by Application 2024 & 2032
- Figure 69: Asia Pacific Veterinary Pain Management Market Revenue Share (%), by Application 2024 & 2032
- Figure 70: Asia Pacific Veterinary Pain Management Market Volume Share (%), by Application 2024 & 2032
- Figure 71: Asia Pacific Veterinary Pain Management Market Revenue (Million), by Animal Type 2024 & 2032
- Figure 72: Asia Pacific Veterinary Pain Management Market Volume (K Unit), by Animal Type 2024 & 2032
- Figure 73: Asia Pacific Veterinary Pain Management Market Revenue Share (%), by Animal Type 2024 & 2032
- Figure 74: Asia Pacific Veterinary Pain Management Market Volume Share (%), by Animal Type 2024 & 2032
- Figure 75: Asia Pacific Veterinary Pain Management Market Revenue (Million), by End User 2024 & 2032
- Figure 76: Asia Pacific Veterinary Pain Management Market Volume (K Unit), by End User 2024 & 2032
- Figure 77: Asia Pacific Veterinary Pain Management Market Revenue Share (%), by End User 2024 & 2032
- Figure 78: Asia Pacific Veterinary Pain Management Market Volume Share (%), by End User 2024 & 2032
- Figure 79: Asia Pacific Veterinary Pain Management Market Revenue (Million), by Country 2024 & 2032
- Figure 80: Asia Pacific Veterinary Pain Management Market Volume (K Unit), by Country 2024 & 2032
- Figure 81: Asia Pacific Veterinary Pain Management Market Revenue Share (%), by Country 2024 & 2032
- Figure 82: Asia Pacific Veterinary Pain Management Market Volume Share (%), by Country 2024 & 2032
- Figure 83: Middle East and Africa Veterinary Pain Management Market Revenue (Million), by Product 2024 & 2032
- Figure 84: Middle East and Africa Veterinary Pain Management Market Volume (K Unit), by Product 2024 & 2032
- Figure 85: Middle East and Africa Veterinary Pain Management Market Revenue Share (%), by Product 2024 & 2032
- Figure 86: Middle East and Africa Veterinary Pain Management Market Volume Share (%), by Product 2024 & 2032
- Figure 87: Middle East and Africa Veterinary Pain Management Market Revenue (Million), by Application 2024 & 2032
- Figure 88: Middle East and Africa Veterinary Pain Management Market Volume (K Unit), by Application 2024 & 2032
- Figure 89: Middle East and Africa Veterinary Pain Management Market Revenue Share (%), by Application 2024 & 2032
- Figure 90: Middle East and Africa Veterinary Pain Management Market Volume Share (%), by Application 2024 & 2032
- Figure 91: Middle East and Africa Veterinary Pain Management Market Revenue (Million), by Animal Type 2024 & 2032
- Figure 92: Middle East and Africa Veterinary Pain Management Market Volume (K Unit), by Animal Type 2024 & 2032
- Figure 93: Middle East and Africa Veterinary Pain Management Market Revenue Share (%), by Animal Type 2024 & 2032
- Figure 94: Middle East and Africa Veterinary Pain Management Market Volume Share (%), by Animal Type 2024 & 2032
- Figure 95: Middle East and Africa Veterinary Pain Management Market Revenue (Million), by End User 2024 & 2032
- Figure 96: Middle East and Africa Veterinary Pain Management Market Volume (K Unit), by End User 2024 & 2032
- Figure 97: Middle East and Africa Veterinary Pain Management Market Revenue Share (%), by End User 2024 & 2032
- Figure 98: Middle East and Africa Veterinary Pain Management Market Volume Share (%), by End User 2024 & 2032
- Figure 99: Middle East and Africa Veterinary Pain Management Market Revenue (Million), by Country 2024 & 2032
- Figure 100: Middle East and Africa Veterinary Pain Management Market Volume (K Unit), by Country 2024 & 2032
- Figure 101: Middle East and Africa Veterinary Pain Management Market Revenue Share (%), by Country 2024 & 2032
- Figure 102: Middle East and Africa Veterinary Pain Management Market Volume Share (%), by Country 2024 & 2032
- Figure 103: South America Veterinary Pain Management Market Revenue (Million), by Product 2024 & 2032
- Figure 104: South America Veterinary Pain Management Market Volume (K Unit), by Product 2024 & 2032
- Figure 105: South America Veterinary Pain Management Market Revenue Share (%), by Product 2024 & 2032
- Figure 106: South America Veterinary Pain Management Market Volume Share (%), by Product 2024 & 2032
- Figure 107: South America Veterinary Pain Management Market Revenue (Million), by Application 2024 & 2032
- Figure 108: South America Veterinary Pain Management Market Volume (K Unit), by Application 2024 & 2032
- Figure 109: South America Veterinary Pain Management Market Revenue Share (%), by Application 2024 & 2032
- Figure 110: South America Veterinary Pain Management Market Volume Share (%), by Application 2024 & 2032
- Figure 111: South America Veterinary Pain Management Market Revenue (Million), by Animal Type 2024 & 2032
- Figure 112: South America Veterinary Pain Management Market Volume (K Unit), by Animal Type 2024 & 2032
- Figure 113: South America Veterinary Pain Management Market Revenue Share (%), by Animal Type 2024 & 2032
- Figure 114: South America Veterinary Pain Management Market Volume Share (%), by Animal Type 2024 & 2032
- Figure 115: South America Veterinary Pain Management Market Revenue (Million), by End User 2024 & 2032
- Figure 116: South America Veterinary Pain Management Market Volume (K Unit), by End User 2024 & 2032
- Figure 117: South America Veterinary Pain Management Market Revenue Share (%), by End User 2024 & 2032
- Figure 118: South America Veterinary Pain Management Market Volume Share (%), by End User 2024 & 2032
- Figure 119: South America Veterinary Pain Management Market Revenue (Million), by Country 2024 & 2032
- Figure 120: South America Veterinary Pain Management Market Volume (K Unit), by Country 2024 & 2032
- Figure 121: South America Veterinary Pain Management Market Revenue Share (%), by Country 2024 & 2032
- Figure 122: South America Veterinary Pain Management Market Volume Share (%), by Country 2024 & 2032
List of Tables
- Table 1: Global Veterinary Pain Management Market Revenue Million Forecast, by Region 2019 & 2032
- Table 2: Global Veterinary Pain Management Market Volume K Unit Forecast, by Region 2019 & 2032
- Table 3: Global Veterinary Pain Management Market Revenue Million Forecast, by Product 2019 & 2032
- Table 4: Global Veterinary Pain Management Market Volume K Unit Forecast, by Product 2019 & 2032
- Table 5: Global Veterinary Pain Management Market Revenue Million Forecast, by Application 2019 & 2032
- Table 6: Global Veterinary Pain Management Market Volume K Unit Forecast, by Application 2019 & 2032
- Table 7: Global Veterinary Pain Management Market Revenue Million Forecast, by Animal Type 2019 & 2032
- Table 8: Global Veterinary Pain Management Market Volume K Unit Forecast, by Animal Type 2019 & 2032
- Table 9: Global Veterinary Pain Management Market Revenue Million Forecast, by End User 2019 & 2032
- Table 10: Global Veterinary Pain Management Market Volume K Unit Forecast, by End User 2019 & 2032
- Table 11: Global Veterinary Pain Management Market Revenue Million Forecast, by Region 2019 & 2032
- Table 12: Global Veterinary Pain Management Market Volume K Unit Forecast, by Region 2019 & 2032
- Table 13: Global Veterinary Pain Management Market Revenue Million Forecast, by Country 2019 & 2032
- Table 14: Global Veterinary Pain Management Market Volume K Unit Forecast, by Country 2019 & 2032
- Table 15: Global Veterinary Pain Management Market Revenue Million Forecast, by Country 2019 & 2032
- Table 16: Global Veterinary Pain Management Market Volume K Unit Forecast, by Country 2019 & 2032
- Table 17: Global Veterinary Pain Management Market Revenue Million Forecast, by Country 2019 & 2032
- Table 18: Global Veterinary Pain Management Market Volume K Unit Forecast, by Country 2019 & 2032
- Table 19: Global Veterinary Pain Management Market Revenue Million Forecast, by Country 2019 & 2032
- Table 20: Global Veterinary Pain Management Market Volume K Unit Forecast, by Country 2019 & 2032
- Table 21: Global Veterinary Pain Management Market Revenue Million Forecast, by Country 2019 & 2032
- Table 22: Global Veterinary Pain Management Market Volume K Unit Forecast, by Country 2019 & 2032
- Table 23: Global Veterinary Pain Management Market Revenue Million Forecast, by Product 2019 & 2032
- Table 24: Global Veterinary Pain Management Market Volume K Unit Forecast, by Product 2019 & 2032
- Table 25: Global Veterinary Pain Management Market Revenue Million Forecast, by Application 2019 & 2032
- Table 26: Global Veterinary Pain Management Market Volume K Unit Forecast, by Application 2019 & 2032
- Table 27: Global Veterinary Pain Management Market Revenue Million Forecast, by Animal Type 2019 & 2032
- Table 28: Global Veterinary Pain Management Market Volume K Unit Forecast, by Animal Type 2019 & 2032
- Table 29: Global Veterinary Pain Management Market Revenue Million Forecast, by End User 2019 & 2032
- Table 30: Global Veterinary Pain Management Market Volume K Unit Forecast, by End User 2019 & 2032
- Table 31: Global Veterinary Pain Management Market Revenue Million Forecast, by Country 2019 & 2032
- Table 32: Global Veterinary Pain Management Market Volume K Unit Forecast, by Country 2019 & 2032
- Table 33: United States Veterinary Pain Management Market Revenue (Million) Forecast, by Application 2019 & 2032
- Table 34: United States Veterinary Pain Management Market Volume (K Unit) Forecast, by Application 2019 & 2032
- Table 35: Canada Veterinary Pain Management Market Revenue (Million) Forecast, by Application 2019 & 2032
- Table 36: Canada Veterinary Pain Management Market Volume (K Unit) Forecast, by Application 2019 & 2032
- Table 37: Mexico Veterinary Pain Management Market Revenue (Million) Forecast, by Application 2019 & 2032
- Table 38: Mexico Veterinary Pain Management Market Volume (K Unit) Forecast, by Application 2019 & 2032
- Table 39: Global Veterinary Pain Management Market Revenue Million Forecast, by Product 2019 & 2032
- Table 40: Global Veterinary Pain Management Market Volume K Unit Forecast, by Product 2019 & 2032
- Table 41: Global Veterinary Pain Management Market Revenue Million Forecast, by Application 2019 & 2032
- Table 42: Global Veterinary Pain Management Market Volume K Unit Forecast, by Application 2019 & 2032
- Table 43: Global Veterinary Pain Management Market Revenue Million Forecast, by Animal Type 2019 & 2032
- Table 44: Global Veterinary Pain Management Market Volume K Unit Forecast, by Animal Type 2019 & 2032
- Table 45: Global Veterinary Pain Management Market Revenue Million Forecast, by End User 2019 & 2032
- Table 46: Global Veterinary Pain Management Market Volume K Unit Forecast, by End User 2019 & 2032
- Table 47: Global Veterinary Pain Management Market Revenue Million Forecast, by Country 2019 & 2032
- Table 48: Global Veterinary Pain Management Market Volume K Unit Forecast, by Country 2019 & 2032
- Table 49: Germany Veterinary Pain Management Market Revenue (Million) Forecast, by Application 2019 & 2032
- Table 50: Germany Veterinary Pain Management Market Volume (K Unit) Forecast, by Application 2019 & 2032
- Table 51: United Kingdom Veterinary Pain Management Market Revenue (Million) Forecast, by Application 2019 & 2032
- Table 52: United Kingdom Veterinary Pain Management Market Volume (K Unit) Forecast, by Application 2019 & 2032
- Table 53: France Veterinary Pain Management Market Revenue (Million) Forecast, by Application 2019 & 2032
- Table 54: France Veterinary Pain Management Market Volume (K Unit) Forecast, by Application 2019 & 2032
- Table 55: Italy Veterinary Pain Management Market Revenue (Million) Forecast, by Application 2019 & 2032
- Table 56: Italy Veterinary Pain Management Market Volume (K Unit) Forecast, by Application 2019 & 2032
- Table 57: Spain Veterinary Pain Management Market Revenue (Million) Forecast, by Application 2019 & 2032
- Table 58: Spain Veterinary Pain Management Market Volume (K Unit) Forecast, by Application 2019 & 2032
- Table 59: Rest of Europe Veterinary Pain Management Market Revenue (Million) Forecast, by Application 2019 & 2032
- Table 60: Rest of Europe Veterinary Pain Management Market Volume (K Unit) Forecast, by Application 2019 & 2032
- Table 61: Global Veterinary Pain Management Market Revenue Million Forecast, by Product 2019 & 2032
- Table 62: Global Veterinary Pain Management Market Volume K Unit Forecast, by Product 2019 & 2032
- Table 63: Global Veterinary Pain Management Market Revenue Million Forecast, by Application 2019 & 2032
- Table 64: Global Veterinary Pain Management Market Volume K Unit Forecast, by Application 2019 & 2032
- Table 65: Global Veterinary Pain Management Market Revenue Million Forecast, by Animal Type 2019 & 2032
- Table 66: Global Veterinary Pain Management Market Volume K Unit Forecast, by Animal Type 2019 & 2032
- Table 67: Global Veterinary Pain Management Market Revenue Million Forecast, by End User 2019 & 2032
- Table 68: Global Veterinary Pain Management Market Volume K Unit Forecast, by End User 2019 & 2032
- Table 69: Global Veterinary Pain Management Market Revenue Million Forecast, by Country 2019 & 2032
- Table 70: Global Veterinary Pain Management Market Volume K Unit Forecast, by Country 2019 & 2032
- Table 71: China Veterinary Pain Management Market Revenue (Million) Forecast, by Application 2019 & 2032
- Table 72: China Veterinary Pain Management Market Volume (K Unit) Forecast, by Application 2019 & 2032
- Table 73: Japan Veterinary Pain Management Market Revenue (Million) Forecast, by Application 2019 & 2032
- Table 74: Japan Veterinary Pain Management Market Volume (K Unit) Forecast, by Application 2019 & 2032
- Table 75: India Veterinary Pain Management Market Revenue (Million) Forecast, by Application 2019 & 2032
- Table 76: India Veterinary Pain Management Market Volume (K Unit) Forecast, by Application 2019 & 2032
- Table 77: Australia Veterinary Pain Management Market Revenue (Million) Forecast, by Application 2019 & 2032
- Table 78: Australia Veterinary Pain Management Market Volume (K Unit) Forecast, by Application 2019 & 2032
- Table 79: South Korea Veterinary Pain Management Market Revenue (Million) Forecast, by Application 2019 & 2032
- Table 80: South Korea Veterinary Pain Management Market Volume (K Unit) Forecast, by Application 2019 & 2032
- Table 81: Rest of Asia Pacific Veterinary Pain Management Market Revenue (Million) Forecast, by Application 2019 & 2032
- Table 82: Rest of Asia Pacific Veterinary Pain Management Market Volume (K Unit) Forecast, by Application 2019 & 2032
- Table 83: Global Veterinary Pain Management Market Revenue Million Forecast, by Product 2019 & 2032
- Table 84: Global Veterinary Pain Management Market Volume K Unit Forecast, by Product 2019 & 2032
- Table 85: Global Veterinary Pain Management Market Revenue Million Forecast, by Application 2019 & 2032
- Table 86: Global Veterinary Pain Management Market Volume K Unit Forecast, by Application 2019 & 2032
- Table 87: Global Veterinary Pain Management Market Revenue Million Forecast, by Animal Type 2019 & 2032
- Table 88: Global Veterinary Pain Management Market Volume K Unit Forecast, by Animal Type 2019 & 2032
- Table 89: Global Veterinary Pain Management Market Revenue Million Forecast, by End User 2019 & 2032
- Table 90: Global Veterinary Pain Management Market Volume K Unit Forecast, by End User 2019 & 2032
- Table 91: Global Veterinary Pain Management Market Revenue Million Forecast, by Country 2019 & 2032
- Table 92: Global Veterinary Pain Management Market Volume K Unit Forecast, by Country 2019 & 2032
- Table 93: GCC Veterinary Pain Management Market Revenue (Million) Forecast, by Application 2019 & 2032
- Table 94: GCC Veterinary Pain Management Market Volume (K Unit) Forecast, by Application 2019 & 2032
- Table 95: South Africa Veterinary Pain Management Market Revenue (Million) Forecast, by Application 2019 & 2032
- Table 96: South Africa Veterinary Pain Management Market Volume (K Unit) Forecast, by Application 2019 & 2032
- Table 97: Rest of Middle East and Africa Veterinary Pain Management Market Revenue (Million) Forecast, by Application 2019 & 2032
- Table 98: Rest of Middle East and Africa Veterinary Pain Management Market Volume (K Unit) Forecast, by Application 2019 & 2032
- Table 99: Global Veterinary Pain Management Market Revenue Million Forecast, by Product 2019 & 2032
- Table 100: Global Veterinary Pain Management Market Volume K Unit Forecast, by Product 2019 & 2032
- Table 101: Global Veterinary Pain Management Market Revenue Million Forecast, by Application 2019 & 2032
- Table 102: Global Veterinary Pain Management Market Volume K Unit Forecast, by Application 2019 & 2032
- Table 103: Global Veterinary Pain Management Market Revenue Million Forecast, by Animal Type 2019 & 2032
- Table 104: Global Veterinary Pain Management Market Volume K Unit Forecast, by Animal Type 2019 & 2032
- Table 105: Global Veterinary Pain Management Market Revenue Million Forecast, by End User 2019 & 2032
- Table 106: Global Veterinary Pain Management Market Volume K Unit Forecast, by End User 2019 & 2032
- Table 107: Global Veterinary Pain Management Market Revenue Million Forecast, by Country 2019 & 2032
- Table 108: Global Veterinary Pain Management Market Volume K Unit Forecast, by Country 2019 & 2032
- Table 109: Brazil Veterinary Pain Management Market Revenue (Million) Forecast, by Application 2019 & 2032
- Table 110: Brazil Veterinary Pain Management Market Volume (K Unit) Forecast, by Application 2019 & 2032
- Table 111: Argentina Veterinary Pain Management Market Revenue (Million) Forecast, by Application 2019 & 2032
- Table 112: Argentina Veterinary Pain Management Market Volume (K Unit) Forecast, by Application 2019 & 2032
- Table 113: Rest of South America Veterinary Pain Management Market Revenue (Million) Forecast, by Application 2019 & 2032
- Table 114: Rest of South America Veterinary Pain Management Market Volume (K Unit) Forecast, by Application 2019 & 2032
Frequently Asked Questions
1. What is the projected Compound Annual Growth Rate (CAGR) of the Veterinary Pain Management Market?
The projected CAGR is approximately 5.91%.
2. Which companies are prominent players in the Veterinary Pain Management Market?
Key companies in the market include Assisi Animal Health, Boehringer Ingelheim International GmbH, Merck and Co Inc, Dechra Pharmaceuticals PLC, Chanelle Veterinary Limited, VetoquinolSA, Norbrook, Eltech K-Laser SRL, Ceva Sante Animale, Elanco Animal Health Incorporated, Zoetis Inc.
3. What are the main segments of the Veterinary Pain Management Market?
The market segments include Product, Application, Animal Type, End User.
4. Can you provide details about the market size?
The market size is estimated to be USD 1.65 Million as of 2022.
5. What are some drivers contributing to market growth?
Growth in Prevalence of Painful and Inflammatory Diseases in Animals; Rise in Need for Easily Accessible and Affordable Treatment Options; Increase in Awareness about Animal Health and Welfare.
6. What are the notable trends driving market growth?
Laser Therapy is Expected to Witness Considerable Growth Over the Forecast Period.
7. Are there any restraints impacting market growth?
Side Effects Associated With Treatment and High Cost of Certain Products.
8. Can you provide examples of recent developments in the market?
September 2022: Zoetis launched Solensia to manage feline osteoarthritis pain in the United States.
9. What pricing options are available for accessing the report?
Pricing options include single-user, multi-user, and enterprise licenses priced at USD 4750, USD 5250, and USD 8750 respectively.
10. Is the market size provided in terms of value or volume?
The market size is provided in terms of value, measured in Million and volume, measured in K Unit.
11. Are there any specific market keywords associated with the report?
Yes, the market keyword associated with the report is "Veterinary Pain Management Market," which aids in identifying and referencing the specific market segment covered.
12. How do I determine which pricing option suits my needs best?
The pricing options vary based on user requirements and access needs. Individual users may opt for single-user licenses, while businesses requiring broader access may choose multi-user or enterprise licenses for cost-effective access to the report.
13. Are there any additional resources or data provided in the Veterinary Pain Management Market report?
While the report offers comprehensive insights, it's advisable to review the specific contents or supplementary materials provided to ascertain if additional resources or data are available.
14. How can I stay updated on further developments or reports in the Veterinary Pain Management Market?
To stay informed about further developments, trends, and reports in the Veterinary Pain Management Market, consider subscribing to industry newsletters, following relevant companies and organizations, or regularly checking reputable industry news sources and publications.
Methodology
Step 1 - Identification of Relevant Samples Size from Population Database


Step 2 - Approaches for Defining Global Market Size (Value, Volume* & Price*)

Note*: In applicable scenarios
Step 3 - Data Sources
Primary Research
- Web Analytics
- Survey Reports
- Research Institute
- Latest Research Reports
- Opinion Leaders
Secondary Research
- Annual Reports
- White Paper
- Latest Press Release
- Industry Association
- Paid Database
- Investor Presentations

Step 4 - Data Triangulation
Involves using different sources of information in order to increase the validity of a study
These sources are likely to be stakeholders in a program - participants, other researchers, program staff, other community members, and so on.
Then we put all data in single framework & apply various statistical tools to find out the dynamic on the market.
During the analysis stage, feedback from the stakeholder groups would be compared to determine areas of agreement as well as areas of divergence


