
Key Insights
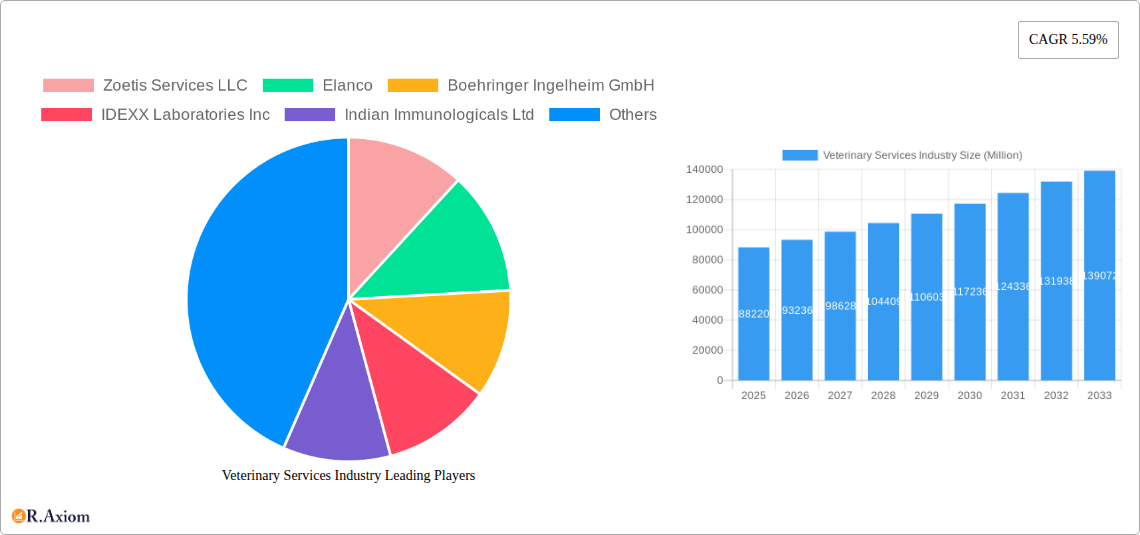
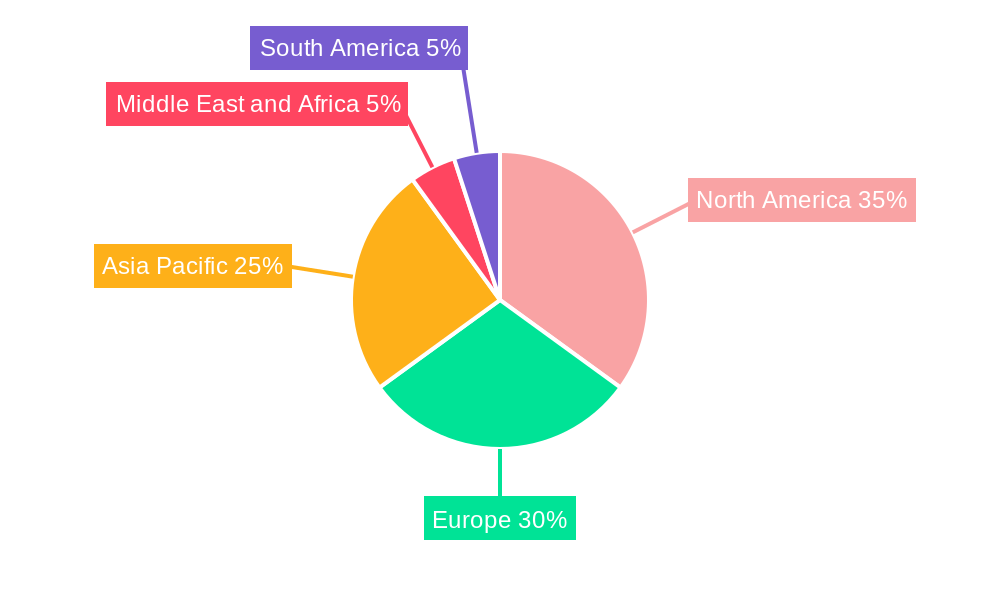
The global veterinary services market, valued at $88.22 billion in 2025, is projected to experience robust growth, driven by several key factors. Rising pet ownership worldwide, increasing humanization of pets leading to greater expenditure on animal healthcare, and advancements in veterinary diagnostic and treatment technologies are significant contributors to this expansion. The market's segmentation reveals a substantial contribution from companion animal care, reflecting the strong emotional bond between humans and their pets. Emergency and specialty services also represent lucrative segments, indicating a growing demand for advanced veterinary interventions. Geographic analysis suggests North America and Europe currently hold the largest market shares due to high pet ownership rates and developed healthcare infrastructure. However, the Asia-Pacific region is poised for significant growth, driven by rising disposable incomes and increasing pet adoption rates in developing economies. Key players like Zoetis, Elanco, and IDEXX are leveraging technological innovations and strategic acquisitions to consolidate their market positions and cater to the evolving needs of the veterinary industry. The increasing prevalence of chronic diseases in animals also fuels demand for ongoing care, contributing to market growth.
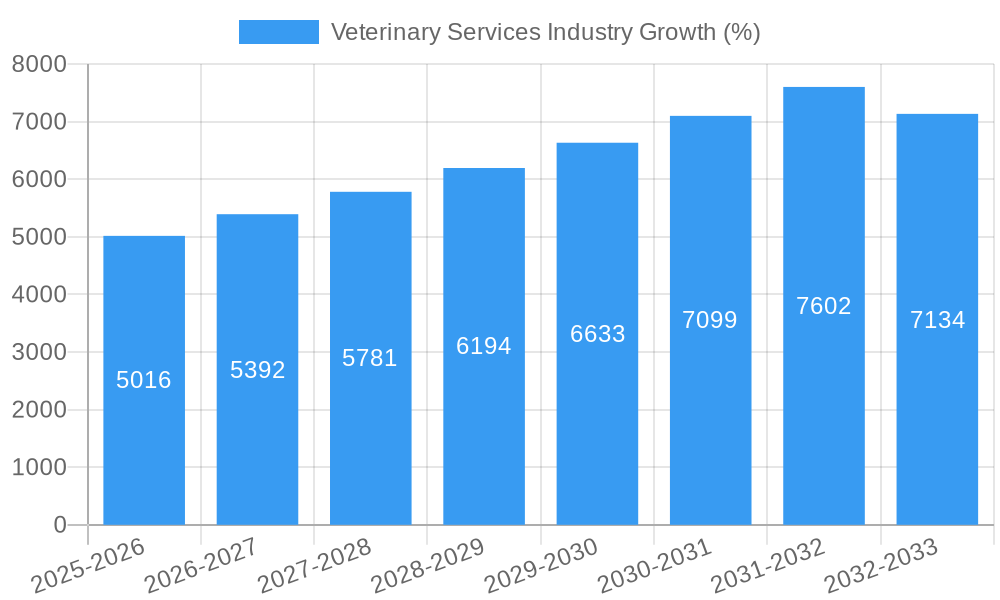
Competition within the veterinary services sector is intense, with established multinational corporations and regional players vying for market share. This competition fosters innovation in service offerings, pricing strategies, and technological advancements. While the market faces certain restraints such as varying regulatory landscapes across different regions and the potential for economic downturns impacting pet owner spending, the long-term outlook remains positive. The market's consistent CAGR of 5.59% suggests sustained growth throughout the forecast period (2025-2033). Further expansion is expected through the integration of telemedicine, personalized medicine, and preventative care strategies within the veterinary services landscape. The continuing trend of pet humanization and the expanding middle class in developing nations will remain pivotal drivers in shaping the future of this dynamic sector.
Veterinary Services Industry Market Report: 2019-2033
This comprehensive report provides a detailed analysis of the Veterinary Services industry, projecting robust growth from 2019 to 2033. The report covers market sizing, segmentation, key players, and future trends, offering actionable insights for industry stakeholders. With a focus on key segments – Companion Animals and Production Animals, and service types including Primary, Emergency, Critical, Specialty, and Diagnostic – this report is essential for strategic decision-making. The total market value is projected to reach xx Million by 2033.
Veterinary Services Industry Market Concentration & Innovation
The veterinary services market exhibits a moderately concentrated structure, with a few multinational corporations holding significant market share. Key players like Zoetis Services LLC, Elanco, and Boehringer Ingelheim GmbH collectively account for an estimated xx% of the global market in 2025. However, a significant number of smaller, regional players also contribute, creating a dynamic competitive landscape.
Innovation is a critical driver, fueled by advancements in diagnostic technologies, therapeutic treatments, and preventative care. Regulatory frameworks, particularly those concerning drug approvals and animal welfare, significantly influence market dynamics. Product substitutes, such as herbal remedies and alternative therapies, are gaining traction, albeit slowly, impacting the market share of traditional pharmaceutical products.
End-user trends, including increasing pet ownership and a growing awareness of animal health, are boosting demand. The industry has seen considerable M&A activity in recent years, with deal values exceeding xx Million in the historical period (2019-2024). These mergers and acquisitions are aimed at expanding product portfolios, gaining market access, and achieving economies of scale.
- Market Leaders: Zoetis Services LLC, Elanco, Boehringer Ingelheim GmbH
- M&A Activity (2019-2024): Total deal value exceeding xx Million.
- Key Innovation Areas: Diagnostics, therapeutics, preventative care.
Veterinary Services Industry Industry Trends & Insights
The veterinary services market is experiencing significant growth, driven by several factors. Increasing pet ownership, particularly in developing economies, is a primary contributor. Rising disposable incomes and changing lifestyles are leading to greater pet humanization, with pet owners investing more in their animals' health and wellbeing. Technological advancements, such as advanced diagnostics (IDEXX Laboratories Inc. is a key player here) and minimally invasive surgical procedures, are improving treatment outcomes and enhancing the overall quality of animal care. Consumer preferences are shifting towards holistic and preventative care, creating new opportunities for specialized services.
The competitive landscape is highly dynamic, with established players facing increased competition from smaller, specialized clinics and telehealth providers. The market is expected to grow at a CAGR of xx% during the forecast period (2025-2033), with market penetration of specialized services steadily increasing. Technological disruptions, including the adoption of telemedicine and AI-driven diagnostic tools, are reshaping the industry, improving efficiency and expanding access to care.
Dominant Markets & Segments in Veterinary Services Industry
The companion animal segment currently dominates the veterinary services market, driven by higher pet ownership rates and increasing consumer spending on pet health. North America and Europe are the leading regions, benefiting from high per capita income and advanced healthcare infrastructure. Within the types of care, the primary care segment is the largest, accounting for the bulk of market revenue in 2025.
- Dominant Segment: Companion Animal
- Leading Regions: North America, Europe
- Key Drivers for Companion Animal Segment:
- High pet ownership rates
- Increasing pet humanization
- Rising disposable incomes
- Key Drivers for Primary Care Segment:
- Routine check-ups and preventative care
- Wide accessibility
The production animal segment is projected to experience slower growth, although it still holds a significant market share. This is attributed to factors such as fluctuating livestock prices and disease outbreaks.
Veterinary Services Industry Product Developments
Recent product innovations focus on enhancing diagnostic capabilities, developing more effective therapeutics, and improving animal welfare. New diagnostic tools, including advanced imaging and genetic testing, provide more accurate and faster diagnoses. The development of targeted therapies, such as monoclonal antibodies, offers improved treatment outcomes with fewer side effects. Furthermore, the increased focus on preventative care is leading to the development of new vaccines and parasite control products. These innovations are improving treatment efficiency and generating higher profitability for industry players.
Report Scope & Segmentation Analysis
This report segments the veterinary services market by animal type (Companion Animal, Production Animal) and by type of care (Primary, Emergency, Critical, Specialty Services, Others Services – including Diagnostic Services, Counselling for Pet Care and Other Types of Care). Each segment is analyzed based on market size, growth projections, and competitive dynamics. The Companion Animal segment is expected to demonstrate the highest growth rate during the forecast period, driven by factors such as increasing pet ownership and higher disposable incomes. The Primary care segment represents the largest revenue share in 2025. The Specialty Services segment is expected to experience considerable growth due to increased demand for specialized treatments and diagnostic services.
Key Drivers of Veterinary Services Industry Growth
Several factors are driving the growth of the veterinary services industry. These include increasing pet ownership rates globally, particularly in emerging markets; rising consumer spending on pet healthcare due to increased pet humanization; advancements in diagnostic technologies and treatment options; and expanding access to veterinary services through mobile clinics and telehealth platforms. Furthermore, supportive government policies and increased investments in animal health research are contributing to the market's expansion.
Challenges in the Veterinary Services Industry Sector
The veterinary services industry faces several challenges, including regulatory hurdles in the approval of new drugs and treatments, which can lead to increased time and costs for bringing new products to market. Fluctuations in the supply chain, particularly for specialized equipment and medications, can impact the availability and cost of services. Increasing competition from both established and new market entrants puts pressure on pricing and margins. Furthermore, the rising cost of veterinary education and the shortage of qualified professionals are significant concerns. These factors could collectively impact market growth by xx% during the forecast period.
Emerging Opportunities in Veterinary Services Industry
Emerging opportunities include the growth of the companion animal segment in emerging economies, as more consumers gain purchasing power and demand for higher quality animal healthcare increases. Advancements in telemedicine and digital health are creating opportunities for remote diagnosis and monitoring, improving access to care. There is also potential in expanding services to cover areas such as preventative pet care and nutritional advice, catering to an increasingly informed consumer base. Furthermore, the development of personalized medicine approaches to animal healthcare, creating tailored treatments based on specific animal genetic and health profiles, presents a future growth opportunity.
Leading Players in the Veterinary Services Industry Market
- Zoetis Services LLC
- Elanco
- Boehringer Ingelheim GmbH
- IDEXX Laboratories Inc
- Indian Immunologicals Ltd
- Vetoquinol S A
- Hester Bioscience
- Heska Corp
- Ceva Sant Animale
- Phibro Animal Health
- Virbac
- Merck Animal Health
Key Developments in Veterinary Services Industry Industry
- April 2022: Animalcare launched Plaqtiv+, a range of dental care products for cats and dogs designed to reduce calculus formation. This product launch strengthens Animalcare’s position in the companion animal market.
- April 2022: Aurena Laboratories AB (Aurena) entered a collaboration with Swedish start-up Emollivet to become their manufacturing partner for its innovative animal healthcare products based on Lipitor AKVANO technology in spray form. This collaboration signifies a significant move towards innovative delivery methods in animal healthcare.
Strategic Outlook for Veterinary Services Industry Market
The veterinary services market is poised for continued growth, driven by factors such as increasing pet ownership, rising disposable incomes, and technological advancements. The focus on preventative care, the expansion of specialized services, and the integration of digital technologies are creating significant opportunities for market players. The development of new therapeutic agents, innovative diagnostics, and personalized medicine approaches will further drive market expansion and profitability in the coming years. The long-term outlook is exceptionally positive for veterinary services providers that can adapt to evolving consumer preferences and technological disruptions.
Veterinary Services Industry Segmentation
-
1. Animal Type
- 1.1. Companion Animal
- 1.2. Production Animal
-
2. Type of Care
- 2.1. Primary
- 2.2. Emergency
- 2.3. Critical
- 2.4. Specialty Services
- 2.5. Others S
Veterinary Services Industry Segmentation By Geography
-
1. North America
- 1.1. United States
- 1.2. Canada
- 1.3. Mexico
-
2. Europe
- 2.1. Germany
- 2.2. United Kingdom
- 2.3. France
- 2.4. Italy
- 2.5. Spain
- 2.6. Rest of Europe
-
3. Asia Pacific
- 3.1. China
- 3.2. Japan
- 3.3. India
- 3.4. Australia
- 3.5. South Korea
- 3.6. Rest of Asia Pacific
-
4. Middle East and Africa
- 4.1. GCC
- 4.2. South Africa
- 4.3. Rest of Middle East and Africa
-
5. South America
- 5.1. Brazil
- 5.2. Argentina
- 5.3. Rest of South America
Veterinary Services Industry REPORT HIGHLIGHTS
| Aspects | Details |
|---|---|
| Study Period | 2019-2033 |
| Base Year | 2024 |
| Estimated Year | 2025 |
| Forecast Period | 2025-2033 |
| Historical Period | 2019-2024 |
| Growth Rate | CAGR of 5.59% from 2019-2033 |
| Segmentation |
|
Table of Contents
- 1. Introduction
- 1.1. Research Scope
- 1.2. Market Segmentation
- 1.3. Research Methodology
- 1.4. Definitions and Assumptions
- 2. Executive Summary
- 2.1. Introduction
- 3. Market Dynamics
- 3.1. Introduction
- 3.2. Market Drivers
- 3.2.1. Rising Chronic Diseases and Awareness Regarding Veterinary Care; Increasing Initiatives by Governments and Animal Welfare Associations in Different Countries
- 3.3. Market Restrains
- 3.3.1. Increasing Costs of Animal Care Product and Veterinary Services
- 3.4. Market Trends
- 3.4.1. Companion Animal Segment is Expected to Hold Significant Market Share in the Market Over the Forecast Period
- 4. Market Factor Analysis
- 4.1. Porters Five Forces
- 4.2. Supply/Value Chain
- 4.3. PESTEL analysis
- 4.4. Market Entropy
- 4.5. Patent/Trademark Analysis
- 5. Global Veterinary Services Industry Analysis, Insights and Forecast, 2019-2031
- 5.1. Market Analysis, Insights and Forecast - by Animal Type
- 5.1.1. Companion Animal
- 5.1.2. Production Animal
- 5.2. Market Analysis, Insights and Forecast - by Type of Care
- 5.2.1. Primary
- 5.2.2. Emergency
- 5.2.3. Critical
- 5.2.4. Specialty Services
- 5.2.5. Others S
- 5.3. Market Analysis, Insights and Forecast - by Region
- 5.3.1. North America
- 5.3.2. Europe
- 5.3.3. Asia Pacific
- 5.3.4. Middle East and Africa
- 5.3.5. South America
- 5.1. Market Analysis, Insights and Forecast - by Animal Type
- 6. North America Veterinary Services Industry Analysis, Insights and Forecast, 2019-2031
- 6.1. Market Analysis, Insights and Forecast - by Animal Type
- 6.1.1. Companion Animal
- 6.1.2. Production Animal
- 6.2. Market Analysis, Insights and Forecast - by Type of Care
- 6.2.1. Primary
- 6.2.2. Emergency
- 6.2.3. Critical
- 6.2.4. Specialty Services
- 6.2.5. Others S
- 6.1. Market Analysis, Insights and Forecast - by Animal Type
- 7. Europe Veterinary Services Industry Analysis, Insights and Forecast, 2019-2031
- 7.1. Market Analysis, Insights and Forecast - by Animal Type
- 7.1.1. Companion Animal
- 7.1.2. Production Animal
- 7.2. Market Analysis, Insights and Forecast - by Type of Care
- 7.2.1. Primary
- 7.2.2. Emergency
- 7.2.3. Critical
- 7.2.4. Specialty Services
- 7.2.5. Others S
- 7.1. Market Analysis, Insights and Forecast - by Animal Type
- 8. Asia Pacific Veterinary Services Industry Analysis, Insights and Forecast, 2019-2031
- 8.1. Market Analysis, Insights and Forecast - by Animal Type
- 8.1.1. Companion Animal
- 8.1.2. Production Animal
- 8.2. Market Analysis, Insights and Forecast - by Type of Care
- 8.2.1. Primary
- 8.2.2. Emergency
- 8.2.3. Critical
- 8.2.4. Specialty Services
- 8.2.5. Others S
- 8.1. Market Analysis, Insights and Forecast - by Animal Type
- 9. Middle East and Africa Veterinary Services Industry Analysis, Insights and Forecast, 2019-2031
- 9.1. Market Analysis, Insights and Forecast - by Animal Type
- 9.1.1. Companion Animal
- 9.1.2. Production Animal
- 9.2. Market Analysis, Insights and Forecast - by Type of Care
- 9.2.1. Primary
- 9.2.2. Emergency
- 9.2.3. Critical
- 9.2.4. Specialty Services
- 9.2.5. Others S
- 9.1. Market Analysis, Insights and Forecast - by Animal Type
- 10. South America Veterinary Services Industry Analysis, Insights and Forecast, 2019-2031
- 10.1. Market Analysis, Insights and Forecast - by Animal Type
- 10.1.1. Companion Animal
- 10.1.2. Production Animal
- 10.2. Market Analysis, Insights and Forecast - by Type of Care
- 10.2.1. Primary
- 10.2.2. Emergency
- 10.2.3. Critical
- 10.2.4. Specialty Services
- 10.2.5. Others S
- 10.1. Market Analysis, Insights and Forecast - by Animal Type
- 11. North America Veterinary Services Industry Analysis, Insights and Forecast, 2019-2031
- 11.1. Market Analysis, Insights and Forecast - By Country/Sub-region
- 11.1.1 United States
- 11.1.2 Canada
- 11.1.3 Mexico
- 12. Europe Veterinary Services Industry Analysis, Insights and Forecast, 2019-2031
- 12.1. Market Analysis, Insights and Forecast - By Country/Sub-region
- 12.1.1 Germany
- 12.1.2 United Kingdom
- 12.1.3 France
- 12.1.4 Italy
- 12.1.5 Spain
- 12.1.6 Rest of Europe
- 13. Asia Pacific Veterinary Services Industry Analysis, Insights and Forecast, 2019-2031
- 13.1. Market Analysis, Insights and Forecast - By Country/Sub-region
- 13.1.1 China
- 13.1.2 Japan
- 13.1.3 India
- 13.1.4 Australia
- 13.1.5 South Korea
- 13.1.6 Rest of Asia Pacific
- 14. Middle East and Africa Veterinary Services Industry Analysis, Insights and Forecast, 2019-2031
- 14.1. Market Analysis, Insights and Forecast - By Country/Sub-region
- 14.1.1 GCC
- 14.1.2 South Africa
- 14.1.3 Rest of Middle East and Africa
- 15. South America Veterinary Services Industry Analysis, Insights and Forecast, 2019-2031
- 15.1. Market Analysis, Insights and Forecast - By Country/Sub-region
- 15.1.1 Brazil
- 15.1.2 Argentina
- 15.1.3 Rest of South America
- 16. Competitive Analysis
- 16.1. Global Market Share Analysis 2024
- 16.2. Company Profiles
- 16.2.1 Zoetis Services LLC
- 16.2.1.1. Overview
- 16.2.1.2. Products
- 16.2.1.3. SWOT Analysis
- 16.2.1.4. Recent Developments
- 16.2.1.5. Financials (Based on Availability)
- 16.2.2 Elanco
- 16.2.2.1. Overview
- 16.2.2.2. Products
- 16.2.2.3. SWOT Analysis
- 16.2.2.4. Recent Developments
- 16.2.2.5. Financials (Based on Availability)
- 16.2.3 Boehringer Ingelheim GmbH
- 16.2.3.1. Overview
- 16.2.3.2. Products
- 16.2.3.3. SWOT Analysis
- 16.2.3.4. Recent Developments
- 16.2.3.5. Financials (Based on Availability)
- 16.2.4 IDEXX Laboratories Inc
- 16.2.4.1. Overview
- 16.2.4.2. Products
- 16.2.4.3. SWOT Analysis
- 16.2.4.4. Recent Developments
- 16.2.4.5. Financials (Based on Availability)
- 16.2.5 Indian Immunologicals Ltd
- 16.2.5.1. Overview
- 16.2.5.2. Products
- 16.2.5.3. SWOT Analysis
- 16.2.5.4. Recent Developments
- 16.2.5.5. Financials (Based on Availability)
- 16.2.6 Vetoquinol S A
- 16.2.6.1. Overview
- 16.2.6.2. Products
- 16.2.6.3. SWOT Analysis
- 16.2.6.4. Recent Developments
- 16.2.6.5. Financials (Based on Availability)
- 16.2.7 Hester Bioscience
- 16.2.7.1. Overview
- 16.2.7.2. Products
- 16.2.7.3. SWOT Analysis
- 16.2.7.4. Recent Developments
- 16.2.7.5. Financials (Based on Availability)
- 16.2.8 Heska Corp
- 16.2.8.1. Overview
- 16.2.8.2. Products
- 16.2.8.3. SWOT Analysis
- 16.2.8.4. Recent Developments
- 16.2.8.5. Financials (Based on Availability)
- 16.2.9 Ceva Sant Animale
- 16.2.9.1. Overview
- 16.2.9.2. Products
- 16.2.9.3. SWOT Analysis
- 16.2.9.4. Recent Developments
- 16.2.9.5. Financials (Based on Availability)
- 16.2.10 Phibro Animal Health
- 16.2.10.1. Overview
- 16.2.10.2. Products
- 16.2.10.3. SWOT Analysis
- 16.2.10.4. Recent Developments
- 16.2.10.5. Financials (Based on Availability)
- 16.2.11 Virbac
- 16.2.11.1. Overview
- 16.2.11.2. Products
- 16.2.11.3. SWOT Analysis
- 16.2.11.4. Recent Developments
- 16.2.11.5. Financials (Based on Availability)
- 16.2.12 Merck Animal Health
- 16.2.12.1. Overview
- 16.2.12.2. Products
- 16.2.12.3. SWOT Analysis
- 16.2.12.4. Recent Developments
- 16.2.12.5. Financials (Based on Availability)
- 16.2.1 Zoetis Services LLC
List of Figures
- Figure 1: Global Veterinary Services Industry Revenue Breakdown (Million, %) by Region 2024 & 2032
- Figure 2: Global Veterinary Services Industry Volume Breakdown (K Unit, %) by Region 2024 & 2032
- Figure 3: North America Veterinary Services Industry Revenue (Million), by Country 2024 & 2032
- Figure 4: North America Veterinary Services Industry Volume (K Unit), by Country 2024 & 2032
- Figure 5: North America Veterinary Services Industry Revenue Share (%), by Country 2024 & 2032
- Figure 6: North America Veterinary Services Industry Volume Share (%), by Country 2024 & 2032
- Figure 7: Europe Veterinary Services Industry Revenue (Million), by Country 2024 & 2032
- Figure 8: Europe Veterinary Services Industry Volume (K Unit), by Country 2024 & 2032
- Figure 9: Europe Veterinary Services Industry Revenue Share (%), by Country 2024 & 2032
- Figure 10: Europe Veterinary Services Industry Volume Share (%), by Country 2024 & 2032
- Figure 11: Asia Pacific Veterinary Services Industry Revenue (Million), by Country 2024 & 2032
- Figure 12: Asia Pacific Veterinary Services Industry Volume (K Unit), by Country 2024 & 2032
- Figure 13: Asia Pacific Veterinary Services Industry Revenue Share (%), by Country 2024 & 2032
- Figure 14: Asia Pacific Veterinary Services Industry Volume Share (%), by Country 2024 & 2032
- Figure 15: Middle East and Africa Veterinary Services Industry Revenue (Million), by Country 2024 & 2032
- Figure 16: Middle East and Africa Veterinary Services Industry Volume (K Unit), by Country 2024 & 2032
- Figure 17: Middle East and Africa Veterinary Services Industry Revenue Share (%), by Country 2024 & 2032
- Figure 18: Middle East and Africa Veterinary Services Industry Volume Share (%), by Country 2024 & 2032
- Figure 19: South America Veterinary Services Industry Revenue (Million), by Country 2024 & 2032
- Figure 20: South America Veterinary Services Industry Volume (K Unit), by Country 2024 & 2032
- Figure 21: South America Veterinary Services Industry Revenue Share (%), by Country 2024 & 2032
- Figure 22: South America Veterinary Services Industry Volume Share (%), by Country 2024 & 2032
- Figure 23: North America Veterinary Services Industry Revenue (Million), by Animal Type 2024 & 2032
- Figure 24: North America Veterinary Services Industry Volume (K Unit), by Animal Type 2024 & 2032
- Figure 25: North America Veterinary Services Industry Revenue Share (%), by Animal Type 2024 & 2032
- Figure 26: North America Veterinary Services Industry Volume Share (%), by Animal Type 2024 & 2032
- Figure 27: North America Veterinary Services Industry Revenue (Million), by Type of Care 2024 & 2032
- Figure 28: North America Veterinary Services Industry Volume (K Unit), by Type of Care 2024 & 2032
- Figure 29: North America Veterinary Services Industry Revenue Share (%), by Type of Care 2024 & 2032
- Figure 30: North America Veterinary Services Industry Volume Share (%), by Type of Care 2024 & 2032
- Figure 31: North America Veterinary Services Industry Revenue (Million), by Country 2024 & 2032
- Figure 32: North America Veterinary Services Industry Volume (K Unit), by Country 2024 & 2032
- Figure 33: North America Veterinary Services Industry Revenue Share (%), by Country 2024 & 2032
- Figure 34: North America Veterinary Services Industry Volume Share (%), by Country 2024 & 2032
- Figure 35: Europe Veterinary Services Industry Revenue (Million), by Animal Type 2024 & 2032
- Figure 36: Europe Veterinary Services Industry Volume (K Unit), by Animal Type 2024 & 2032
- Figure 37: Europe Veterinary Services Industry Revenue Share (%), by Animal Type 2024 & 2032
- Figure 38: Europe Veterinary Services Industry Volume Share (%), by Animal Type 2024 & 2032
- Figure 39: Europe Veterinary Services Industry Revenue (Million), by Type of Care 2024 & 2032
- Figure 40: Europe Veterinary Services Industry Volume (K Unit), by Type of Care 2024 & 2032
- Figure 41: Europe Veterinary Services Industry Revenue Share (%), by Type of Care 2024 & 2032
- Figure 42: Europe Veterinary Services Industry Volume Share (%), by Type of Care 2024 & 2032
- Figure 43: Europe Veterinary Services Industry Revenue (Million), by Country 2024 & 2032
- Figure 44: Europe Veterinary Services Industry Volume (K Unit), by Country 2024 & 2032
- Figure 45: Europe Veterinary Services Industry Revenue Share (%), by Country 2024 & 2032
- Figure 46: Europe Veterinary Services Industry Volume Share (%), by Country 2024 & 2032
- Figure 47: Asia Pacific Veterinary Services Industry Revenue (Million), by Animal Type 2024 & 2032
- Figure 48: Asia Pacific Veterinary Services Industry Volume (K Unit), by Animal Type 2024 & 2032
- Figure 49: Asia Pacific Veterinary Services Industry Revenue Share (%), by Animal Type 2024 & 2032
- Figure 50: Asia Pacific Veterinary Services Industry Volume Share (%), by Animal Type 2024 & 2032
- Figure 51: Asia Pacific Veterinary Services Industry Revenue (Million), by Type of Care 2024 & 2032
- Figure 52: Asia Pacific Veterinary Services Industry Volume (K Unit), by Type of Care 2024 & 2032
- Figure 53: Asia Pacific Veterinary Services Industry Revenue Share (%), by Type of Care 2024 & 2032
- Figure 54: Asia Pacific Veterinary Services Industry Volume Share (%), by Type of Care 2024 & 2032
- Figure 55: Asia Pacific Veterinary Services Industry Revenue (Million), by Country 2024 & 2032
- Figure 56: Asia Pacific Veterinary Services Industry Volume (K Unit), by Country 2024 & 2032
- Figure 57: Asia Pacific Veterinary Services Industry Revenue Share (%), by Country 2024 & 2032
- Figure 58: Asia Pacific Veterinary Services Industry Volume Share (%), by Country 2024 & 2032
- Figure 59: Middle East and Africa Veterinary Services Industry Revenue (Million), by Animal Type 2024 & 2032
- Figure 60: Middle East and Africa Veterinary Services Industry Volume (K Unit), by Animal Type 2024 & 2032
- Figure 61: Middle East and Africa Veterinary Services Industry Revenue Share (%), by Animal Type 2024 & 2032
- Figure 62: Middle East and Africa Veterinary Services Industry Volume Share (%), by Animal Type 2024 & 2032
- Figure 63: Middle East and Africa Veterinary Services Industry Revenue (Million), by Type of Care 2024 & 2032
- Figure 64: Middle East and Africa Veterinary Services Industry Volume (K Unit), by Type of Care 2024 & 2032
- Figure 65: Middle East and Africa Veterinary Services Industry Revenue Share (%), by Type of Care 2024 & 2032
- Figure 66: Middle East and Africa Veterinary Services Industry Volume Share (%), by Type of Care 2024 & 2032
- Figure 67: Middle East and Africa Veterinary Services Industry Revenue (Million), by Country 2024 & 2032
- Figure 68: Middle East and Africa Veterinary Services Industry Volume (K Unit), by Country 2024 & 2032
- Figure 69: Middle East and Africa Veterinary Services Industry Revenue Share (%), by Country 2024 & 2032
- Figure 70: Middle East and Africa Veterinary Services Industry Volume Share (%), by Country 2024 & 2032
- Figure 71: South America Veterinary Services Industry Revenue (Million), by Animal Type 2024 & 2032
- Figure 72: South America Veterinary Services Industry Volume (K Unit), by Animal Type 2024 & 2032
- Figure 73: South America Veterinary Services Industry Revenue Share (%), by Animal Type 2024 & 2032
- Figure 74: South America Veterinary Services Industry Volume Share (%), by Animal Type 2024 & 2032
- Figure 75: South America Veterinary Services Industry Revenue (Million), by Type of Care 2024 & 2032
- Figure 76: South America Veterinary Services Industry Volume (K Unit), by Type of Care 2024 & 2032
- Figure 77: South America Veterinary Services Industry Revenue Share (%), by Type of Care 2024 & 2032
- Figure 78: South America Veterinary Services Industry Volume Share (%), by Type of Care 2024 & 2032
- Figure 79: South America Veterinary Services Industry Revenue (Million), by Country 2024 & 2032
- Figure 80: South America Veterinary Services Industry Volume (K Unit), by Country 2024 & 2032
- Figure 81: South America Veterinary Services Industry Revenue Share (%), by Country 2024 & 2032
- Figure 82: South America Veterinary Services Industry Volume Share (%), by Country 2024 & 2032
List of Tables
- Table 1: Global Veterinary Services Industry Revenue Million Forecast, by Region 2019 & 2032
- Table 2: Global Veterinary Services Industry Volume K Unit Forecast, by Region 2019 & 2032
- Table 3: Global Veterinary Services Industry Revenue Million Forecast, by Animal Type 2019 & 2032
- Table 4: Global Veterinary Services Industry Volume K Unit Forecast, by Animal Type 2019 & 2032
- Table 5: Global Veterinary Services Industry Revenue Million Forecast, by Type of Care 2019 & 2032
- Table 6: Global Veterinary Services Industry Volume K Unit Forecast, by Type of Care 2019 & 2032
- Table 7: Global Veterinary Services Industry Revenue Million Forecast, by Region 2019 & 2032
- Table 8: Global Veterinary Services Industry Volume K Unit Forecast, by Region 2019 & 2032
- Table 9: Global Veterinary Services Industry Revenue Million Forecast, by Country 2019 & 2032
- Table 10: Global Veterinary Services Industry Volume K Unit Forecast, by Country 2019 & 2032
- Table 11: United States Veterinary Services Industry Revenue (Million) Forecast, by Application 2019 & 2032
- Table 12: United States Veterinary Services Industry Volume (K Unit) Forecast, by Application 2019 & 2032
- Table 13: Canada Veterinary Services Industry Revenue (Million) Forecast, by Application 2019 & 2032
- Table 14: Canada Veterinary Services Industry Volume (K Unit) Forecast, by Application 2019 & 2032
- Table 15: Mexico Veterinary Services Industry Revenue (Million) Forecast, by Application 2019 & 2032
- Table 16: Mexico Veterinary Services Industry Volume (K Unit) Forecast, by Application 2019 & 2032
- Table 17: Global Veterinary Services Industry Revenue Million Forecast, by Country 2019 & 2032
- Table 18: Global Veterinary Services Industry Volume K Unit Forecast, by Country 2019 & 2032
- Table 19: Germany Veterinary Services Industry Revenue (Million) Forecast, by Application 2019 & 2032
- Table 20: Germany Veterinary Services Industry Volume (K Unit) Forecast, by Application 2019 & 2032
- Table 21: United Kingdom Veterinary Services Industry Revenue (Million) Forecast, by Application 2019 & 2032
- Table 22: United Kingdom Veterinary Services Industry Volume (K Unit) Forecast, by Application 2019 & 2032
- Table 23: France Veterinary Services Industry Revenue (Million) Forecast, by Application 2019 & 2032
- Table 24: France Veterinary Services Industry Volume (K Unit) Forecast, by Application 2019 & 2032
- Table 25: Italy Veterinary Services Industry Revenue (Million) Forecast, by Application 2019 & 2032
- Table 26: Italy Veterinary Services Industry Volume (K Unit) Forecast, by Application 2019 & 2032
- Table 27: Spain Veterinary Services Industry Revenue (Million) Forecast, by Application 2019 & 2032
- Table 28: Spain Veterinary Services Industry Volume (K Unit) Forecast, by Application 2019 & 2032
- Table 29: Rest of Europe Veterinary Services Industry Revenue (Million) Forecast, by Application 2019 & 2032
- Table 30: Rest of Europe Veterinary Services Industry Volume (K Unit) Forecast, by Application 2019 & 2032
- Table 31: Global Veterinary Services Industry Revenue Million Forecast, by Country 2019 & 2032
- Table 32: Global Veterinary Services Industry Volume K Unit Forecast, by Country 2019 & 2032
- Table 33: China Veterinary Services Industry Revenue (Million) Forecast, by Application 2019 & 2032
- Table 34: China Veterinary Services Industry Volume (K Unit) Forecast, by Application 2019 & 2032
- Table 35: Japan Veterinary Services Industry Revenue (Million) Forecast, by Application 2019 & 2032
- Table 36: Japan Veterinary Services Industry Volume (K Unit) Forecast, by Application 2019 & 2032
- Table 37: India Veterinary Services Industry Revenue (Million) Forecast, by Application 2019 & 2032
- Table 38: India Veterinary Services Industry Volume (K Unit) Forecast, by Application 2019 & 2032
- Table 39: Australia Veterinary Services Industry Revenue (Million) Forecast, by Application 2019 & 2032
- Table 40: Australia Veterinary Services Industry Volume (K Unit) Forecast, by Application 2019 & 2032
- Table 41: South Korea Veterinary Services Industry Revenue (Million) Forecast, by Application 2019 & 2032
- Table 42: South Korea Veterinary Services Industry Volume (K Unit) Forecast, by Application 2019 & 2032
- Table 43: Rest of Asia Pacific Veterinary Services Industry Revenue (Million) Forecast, by Application 2019 & 2032
- Table 44: Rest of Asia Pacific Veterinary Services Industry Volume (K Unit) Forecast, by Application 2019 & 2032
- Table 45: Global Veterinary Services Industry Revenue Million Forecast, by Country 2019 & 2032
- Table 46: Global Veterinary Services Industry Volume K Unit Forecast, by Country 2019 & 2032
- Table 47: GCC Veterinary Services Industry Revenue (Million) Forecast, by Application 2019 & 2032
- Table 48: GCC Veterinary Services Industry Volume (K Unit) Forecast, by Application 2019 & 2032
- Table 49: South Africa Veterinary Services Industry Revenue (Million) Forecast, by Application 2019 & 2032
- Table 50: South Africa Veterinary Services Industry Volume (K Unit) Forecast, by Application 2019 & 2032
- Table 51: Rest of Middle East and Africa Veterinary Services Industry Revenue (Million) Forecast, by Application 2019 & 2032
- Table 52: Rest of Middle East and Africa Veterinary Services Industry Volume (K Unit) Forecast, by Application 2019 & 2032
- Table 53: Global Veterinary Services Industry Revenue Million Forecast, by Country 2019 & 2032
- Table 54: Global Veterinary Services Industry Volume K Unit Forecast, by Country 2019 & 2032
- Table 55: Brazil Veterinary Services Industry Revenue (Million) Forecast, by Application 2019 & 2032
- Table 56: Brazil Veterinary Services Industry Volume (K Unit) Forecast, by Application 2019 & 2032
- Table 57: Argentina Veterinary Services Industry Revenue (Million) Forecast, by Application 2019 & 2032
- Table 58: Argentina Veterinary Services Industry Volume (K Unit) Forecast, by Application 2019 & 2032
- Table 59: Rest of South America Veterinary Services Industry Revenue (Million) Forecast, by Application 2019 & 2032
- Table 60: Rest of South America Veterinary Services Industry Volume (K Unit) Forecast, by Application 2019 & 2032
- Table 61: Global Veterinary Services Industry Revenue Million Forecast, by Animal Type 2019 & 2032
- Table 62: Global Veterinary Services Industry Volume K Unit Forecast, by Animal Type 2019 & 2032
- Table 63: Global Veterinary Services Industry Revenue Million Forecast, by Type of Care 2019 & 2032
- Table 64: Global Veterinary Services Industry Volume K Unit Forecast, by Type of Care 2019 & 2032
- Table 65: Global Veterinary Services Industry Revenue Million Forecast, by Country 2019 & 2032
- Table 66: Global Veterinary Services Industry Volume K Unit Forecast, by Country 2019 & 2032
- Table 67: United States Veterinary Services Industry Revenue (Million) Forecast, by Application 2019 & 2032
- Table 68: United States Veterinary Services Industry Volume (K Unit) Forecast, by Application 2019 & 2032
- Table 69: Canada Veterinary Services Industry Revenue (Million) Forecast, by Application 2019 & 2032
- Table 70: Canada Veterinary Services Industry Volume (K Unit) Forecast, by Application 2019 & 2032
- Table 71: Mexico Veterinary Services Industry Revenue (Million) Forecast, by Application 2019 & 2032
- Table 72: Mexico Veterinary Services Industry Volume (K Unit) Forecast, by Application 2019 & 2032
- Table 73: Global Veterinary Services Industry Revenue Million Forecast, by Animal Type 2019 & 2032
- Table 74: Global Veterinary Services Industry Volume K Unit Forecast, by Animal Type 2019 & 2032
- Table 75: Global Veterinary Services Industry Revenue Million Forecast, by Type of Care 2019 & 2032
- Table 76: Global Veterinary Services Industry Volume K Unit Forecast, by Type of Care 2019 & 2032
- Table 77: Global Veterinary Services Industry Revenue Million Forecast, by Country 2019 & 2032
- Table 78: Global Veterinary Services Industry Volume K Unit Forecast, by Country 2019 & 2032
- Table 79: Germany Veterinary Services Industry Revenue (Million) Forecast, by Application 2019 & 2032
- Table 80: Germany Veterinary Services Industry Volume (K Unit) Forecast, by Application 2019 & 2032
- Table 81: United Kingdom Veterinary Services Industry Revenue (Million) Forecast, by Application 2019 & 2032
- Table 82: United Kingdom Veterinary Services Industry Volume (K Unit) Forecast, by Application 2019 & 2032
- Table 83: France Veterinary Services Industry Revenue (Million) Forecast, by Application 2019 & 2032
- Table 84: France Veterinary Services Industry Volume (K Unit) Forecast, by Application 2019 & 2032
- Table 85: Italy Veterinary Services Industry Revenue (Million) Forecast, by Application 2019 & 2032
- Table 86: Italy Veterinary Services Industry Volume (K Unit) Forecast, by Application 2019 & 2032
- Table 87: Spain Veterinary Services Industry Revenue (Million) Forecast, by Application 2019 & 2032
- Table 88: Spain Veterinary Services Industry Volume (K Unit) Forecast, by Application 2019 & 2032
- Table 89: Rest of Europe Veterinary Services Industry Revenue (Million) Forecast, by Application 2019 & 2032
- Table 90: Rest of Europe Veterinary Services Industry Volume (K Unit) Forecast, by Application 2019 & 2032
- Table 91: Global Veterinary Services Industry Revenue Million Forecast, by Animal Type 2019 & 2032
- Table 92: Global Veterinary Services Industry Volume K Unit Forecast, by Animal Type 2019 & 2032
- Table 93: Global Veterinary Services Industry Revenue Million Forecast, by Type of Care 2019 & 2032
- Table 94: Global Veterinary Services Industry Volume K Unit Forecast, by Type of Care 2019 & 2032
- Table 95: Global Veterinary Services Industry Revenue Million Forecast, by Country 2019 & 2032
- Table 96: Global Veterinary Services Industry Volume K Unit Forecast, by Country 2019 & 2032
- Table 97: China Veterinary Services Industry Revenue (Million) Forecast, by Application 2019 & 2032
- Table 98: China Veterinary Services Industry Volume (K Unit) Forecast, by Application 2019 & 2032
- Table 99: Japan Veterinary Services Industry Revenue (Million) Forecast, by Application 2019 & 2032
- Table 100: Japan Veterinary Services Industry Volume (K Unit) Forecast, by Application 2019 & 2032
- Table 101: India Veterinary Services Industry Revenue (Million) Forecast, by Application 2019 & 2032
- Table 102: India Veterinary Services Industry Volume (K Unit) Forecast, by Application 2019 & 2032
- Table 103: Australia Veterinary Services Industry Revenue (Million) Forecast, by Application 2019 & 2032
- Table 104: Australia Veterinary Services Industry Volume (K Unit) Forecast, by Application 2019 & 2032
- Table 105: South Korea Veterinary Services Industry Revenue (Million) Forecast, by Application 2019 & 2032
- Table 106: South Korea Veterinary Services Industry Volume (K Unit) Forecast, by Application 2019 & 2032
- Table 107: Rest of Asia Pacific Veterinary Services Industry Revenue (Million) Forecast, by Application 2019 & 2032
- Table 108: Rest of Asia Pacific Veterinary Services Industry Volume (K Unit) Forecast, by Application 2019 & 2032
- Table 109: Global Veterinary Services Industry Revenue Million Forecast, by Animal Type 2019 & 2032
- Table 110: Global Veterinary Services Industry Volume K Unit Forecast, by Animal Type 2019 & 2032
- Table 111: Global Veterinary Services Industry Revenue Million Forecast, by Type of Care 2019 & 2032
- Table 112: Global Veterinary Services Industry Volume K Unit Forecast, by Type of Care 2019 & 2032
- Table 113: Global Veterinary Services Industry Revenue Million Forecast, by Country 2019 & 2032
- Table 114: Global Veterinary Services Industry Volume K Unit Forecast, by Country 2019 & 2032
- Table 115: GCC Veterinary Services Industry Revenue (Million) Forecast, by Application 2019 & 2032
- Table 116: GCC Veterinary Services Industry Volume (K Unit) Forecast, by Application 2019 & 2032
- Table 117: South Africa Veterinary Services Industry Revenue (Million) Forecast, by Application 2019 & 2032
- Table 118: South Africa Veterinary Services Industry Volume (K Unit) Forecast, by Application 2019 & 2032
- Table 119: Rest of Middle East and Africa Veterinary Services Industry Revenue (Million) Forecast, by Application 2019 & 2032
- Table 120: Rest of Middle East and Africa Veterinary Services Industry Volume (K Unit) Forecast, by Application 2019 & 2032
- Table 121: Global Veterinary Services Industry Revenue Million Forecast, by Animal Type 2019 & 2032
- Table 122: Global Veterinary Services Industry Volume K Unit Forecast, by Animal Type 2019 & 2032
- Table 123: Global Veterinary Services Industry Revenue Million Forecast, by Type of Care 2019 & 2032
- Table 124: Global Veterinary Services Industry Volume K Unit Forecast, by Type of Care 2019 & 2032
- Table 125: Global Veterinary Services Industry Revenue Million Forecast, by Country 2019 & 2032
- Table 126: Global Veterinary Services Industry Volume K Unit Forecast, by Country 2019 & 2032
- Table 127: Brazil Veterinary Services Industry Revenue (Million) Forecast, by Application 2019 & 2032
- Table 128: Brazil Veterinary Services Industry Volume (K Unit) Forecast, by Application 2019 & 2032
- Table 129: Argentina Veterinary Services Industry Revenue (Million) Forecast, by Application 2019 & 2032
- Table 130: Argentina Veterinary Services Industry Volume (K Unit) Forecast, by Application 2019 & 2032
- Table 131: Rest of South America Veterinary Services Industry Revenue (Million) Forecast, by Application 2019 & 2032
- Table 132: Rest of South America Veterinary Services Industry Volume (K Unit) Forecast, by Application 2019 & 2032
Frequently Asked Questions
1. What is the projected Compound Annual Growth Rate (CAGR) of the Veterinary Services Industry?
The projected CAGR is approximately 5.59%.
2. Which companies are prominent players in the Veterinary Services Industry?
Key companies in the market include Zoetis Services LLC, Elanco, Boehringer Ingelheim GmbH, IDEXX Laboratories Inc, Indian Immunologicals Ltd, Vetoquinol S A, Hester Bioscience, Heska Corp, Ceva Sant Animale, Phibro Animal Health, Virbac, Merck Animal Health.
3. What are the main segments of the Veterinary Services Industry?
The market segments include Animal Type, Type of Care.
4. Can you provide details about the market size?
The market size is estimated to be USD 88.22 Million as of 2022.
5. What are some drivers contributing to market growth?
Rising Chronic Diseases and Awareness Regarding Veterinary Care; Increasing Initiatives by Governments and Animal Welfare Associations in Different Countries.
6. What are the notable trends driving market growth?
Companion Animal Segment is Expected to Hold Significant Market Share in the Market Over the Forecast Period.
7. Are there any restraints impacting market growth?
Increasing Costs of Animal Care Product and Veterinary Services.
8. Can you provide examples of recent developments in the market?
April 2022: Animalcare launched Plaqtiv+, a range of dental care products for cats and dogs designed to reduce calculus formation.
9. What pricing options are available for accessing the report?
Pricing options include single-user, multi-user, and enterprise licenses priced at USD 4750, USD 5250, and USD 8750 respectively.
10. Is the market size provided in terms of value or volume?
The market size is provided in terms of value, measured in Million and volume, measured in K Unit.
11. Are there any specific market keywords associated with the report?
Yes, the market keyword associated with the report is "Veterinary Services Industry," which aids in identifying and referencing the specific market segment covered.
12. How do I determine which pricing option suits my needs best?
The pricing options vary based on user requirements and access needs. Individual users may opt for single-user licenses, while businesses requiring broader access may choose multi-user or enterprise licenses for cost-effective access to the report.
13. Are there any additional resources or data provided in the Veterinary Services Industry report?
While the report offers comprehensive insights, it's advisable to review the specific contents or supplementary materials provided to ascertain if additional resources or data are available.
14. How can I stay updated on further developments or reports in the Veterinary Services Industry?
To stay informed about further developments, trends, and reports in the Veterinary Services Industry, consider subscribing to industry newsletters, following relevant companies and organizations, or regularly checking reputable industry news sources and publications.
Methodology
Step 1 - Identification of Relevant Samples Size from Population Database


Step 2 - Approaches for Defining Global Market Size (Value, Volume* & Price*)

Note*: In applicable scenarios
Step 3 - Data Sources
Primary Research
- Web Analytics
- Survey Reports
- Research Institute
- Latest Research Reports
- Opinion Leaders
Secondary Research
- Annual Reports
- White Paper
- Latest Press Release
- Industry Association
- Paid Database
- Investor Presentations

Step 4 - Data Triangulation
Involves using different sources of information in order to increase the validity of a study
These sources are likely to be stakeholders in a program - participants, other researchers, program staff, other community members, and so on.
Then we put all data in single framework & apply various statistical tools to find out the dynamic on the market.
During the analysis stage, feedback from the stakeholder groups would be compared to determine areas of agreement as well as areas of divergence


