
Key Insights
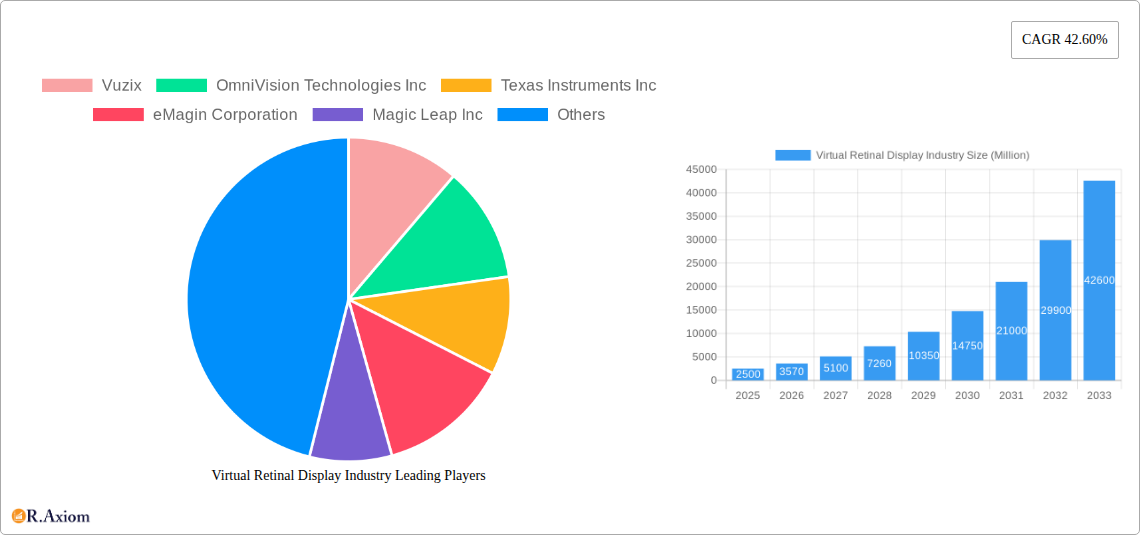
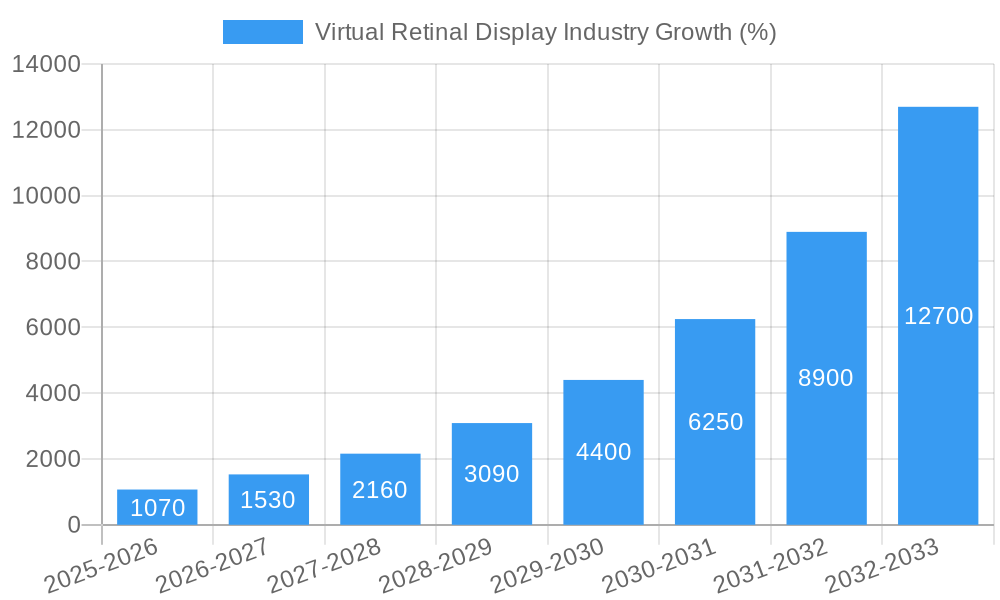
The virtual retinal display (VRD) market is experiencing explosive growth, projected to reach a substantial size driven by advancements in micro-display technology and increasing demand across diverse sectors. The 42.60% CAGR from 2019-2024 indicates a rapidly expanding market, with continued strong growth anticipated through 2033. Key drivers include the rising adoption of augmented reality (AR) and virtual reality (VR) technologies in medical and life sciences for advanced surgical procedures and training simulations, as well as the expanding use in aerospace and defense for pilot training and heads-up displays. The entertainment industry's integration of VRDs in high-end gaming headsets and immersive cinema experiences further fuels market expansion. While technological hurdles and high manufacturing costs pose some restraints, ongoing innovation and economies of scale are expected to mitigate these challenges. The segmentation reveals a significant presence across various end-user industries, with medical and life sciences likely holding the largest share due to high investment and regulatory approvals. North America and Asia-Pacific are currently leading regions, however, increasing adoption in Europe and other emerging markets promises substantial future growth opportunities. The competitive landscape is dynamic, with key players constantly innovating to enhance display resolution, reduce power consumption and improve overall user experience.
The sustained growth in the VRD market is underpinned by several converging factors. The increasing affordability and accessibility of AR/VR technologies are empowering broader adoption across numerous applications. Moreover, the integration of advanced features like improved image quality, wider fields of view, and enhanced comfort are significantly improving user experience, driving further market penetration. The continuous miniaturization of display components and improvements in power efficiency are also contributing to the overall market expansion. The collaborative efforts of technology providers, research institutions, and industry stakeholders are accelerating innovation, leading to the development of more sophisticated and user-friendly VRD solutions. This positive feedback loop of innovation, affordability, and increased adoption is poised to propel the VRD market to even greater heights in the coming decade.
Virtual Retinal Display Industry Market Report: 2019-2033
This comprehensive report provides an in-depth analysis of the Virtual Retinal Display industry, covering market size, growth drivers, challenges, and key players. The report covers the period from 2019 to 2033, with a focus on the forecast period from 2025 to 2033 and a base year of 2025. The study encompasses various segments, including end-user industries and leading companies driving innovation. This report is essential for investors, industry professionals, and anyone seeking to understand the future of virtual retinal display technology.
Virtual Retinal Display Industry Market Concentration & Innovation
The virtual retinal display (VRD) market is characterized by a moderately concentrated landscape with a few key players holding significant market share. While precise market share figures for individual companies remain proprietary, estimates suggest that the top five companies control approximately xx% of the market in 2025. This concentration is expected to slightly decrease by 2033 due to increased innovation and market entry by smaller companies. Innovation within the sector is primarily driven by the need for higher resolution, wider field-of-view displays, and improved power efficiency. Several factors influence the market, including stringent regulatory frameworks related to safety and health standards for near-eye displays, the availability of substitute technologies such as augmented reality glasses, and constantly evolving end-user preferences pushing for more immersive and comfortable experiences. M&A activity is relatively modest, with xx Million in deal value recorded during the historical period (2019-2024). Future M&A activities are predicted to focus on consolidation and strategic partnerships to expand market reach and technological capabilities.
- Market Concentration: Top 5 companies control approximately xx% in 2025; expected to slightly decrease by 2033.
- Innovation Drivers: Higher resolution, wider field-of-view, improved power efficiency.
- Regulatory Framework: Stringent safety and health standards for near-eye displays.
- Product Substitutes: Augmented reality glasses, other display technologies.
- End-user Trends: Demand for more immersive and comfortable VR/AR experiences.
- M&A Activity: Approximately xx Million in deal value (2019-2024).
Virtual Retinal Display Industry Industry Trends & Insights
The global virtual retinal display market is experiencing robust growth, propelled by increasing demand across various sectors. The market is projected to witness a Compound Annual Growth Rate (CAGR) of xx% during the forecast period (2025-2033), reaching a market value of xx Million by 2033. This growth is fueled by several key factors. Technological advancements, particularly in micro-display technology and optics, are continuously improving the resolution, field of view, and overall user experience of VRD devices. Consumer preference for immersive experiences in gaming, entertainment, and education is driving significant adoption, leading to increased market penetration. The competitive landscape is dynamic, with established players and new entrants constantly vying for market share through product innovation and strategic partnerships. Furthermore, the increasing integration of VRD technology in medical and aerospace applications contributes to the market's overall expansion. However, challenges like high manufacturing costs and potential health concerns related to prolonged use remain barriers to widespread adoption.
Dominant Markets & Segments in Virtual Retinal Display Industry
The Medical & Lifesciences segment currently dominates the virtual retinal display market, accounting for the largest market share in 2025 at approximately xx%. The strong growth in this segment is primarily driven by the increasing adoption of VRD technology in ophthalmology for retinal surgery, imaging, diagnosis, and education.
- Key Drivers for Medical & Lifesciences Dominance:
- Advanced medical imaging and diagnostics.
- Minimally invasive surgical procedures.
- Enhanced medical training and education.
- Aerospace and Defense: This segment shows promising growth driven by the need for high-resolution displays in pilot training simulators and heads-up displays for military applications.
- Media and Entertainment: This sector is witnessing steady adoption, although penetration is comparatively lower than Medical & Lifesciences. The development of high-quality VR and AR experiences drives demand.
- Other End-user Verticals: This sector includes various applications, such as industrial design and training. Growth is expected to be moderate, with opportunities emerging in niche areas.
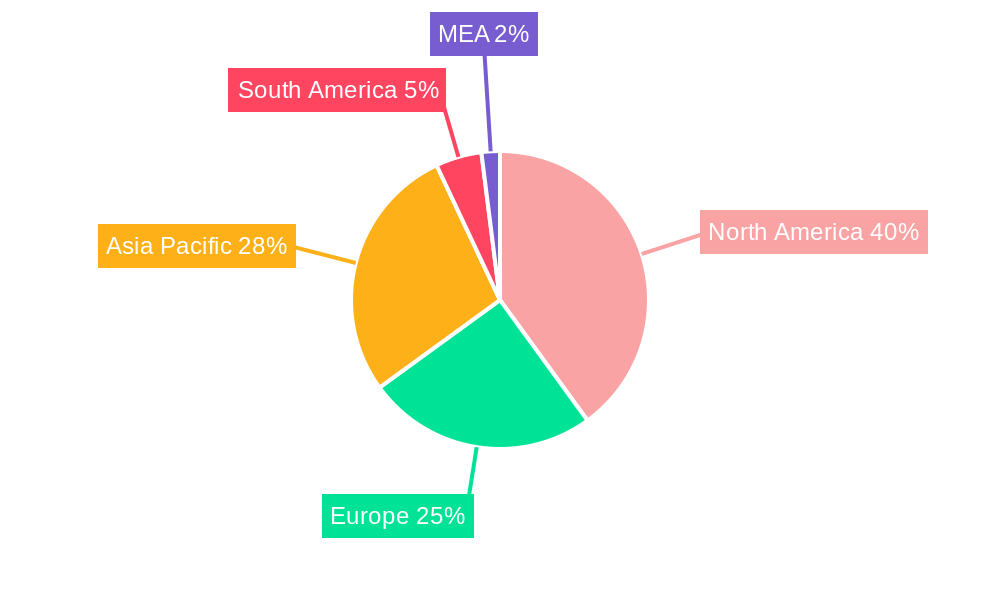
North America currently holds the largest regional market share, due primarily to the presence of major technology companies and robust R&D activities. However, the Asia-Pacific region is projected to demonstrate faster growth during the forecast period due to increasing investment in technology and rising consumer spending.
Virtual Retinal Display Industry Product Developments
Recent advancements in micro-display technology, such as the development of higher-resolution OLED displays with improved color gamut and contrast ratios, significantly enhance the quality and immersive nature of VRD experiences. The pursuit of lighter, more power-efficient displays is ongoing, addressing user comfort and usability challenges. The development of sophisticated optics is also crucial, aiming to widen the field of view and reduce distortion. These improvements directly address market demands for enhanced resolution, comfort, and portability, significantly impacting market fit and competitiveness.
Report Scope & Segmentation Analysis
This report segments the virtual retinal display market by end-user industry:
Medical & Lifesciences: This segment encompasses applications in ophthalmology, surgery, diagnostics, and medical training. It is projected to maintain robust growth throughout the forecast period (2025-2033), driven by technological advancements and increased adoption in healthcare settings. Market size is estimated at xx Million in 2025.
Aerospace and Defense: This segment comprises applications in pilot training, heads-up displays, and other military applications. Growth is expected to be moderate but steady, driven by government investments in advanced military technology. The estimated market size in 2025 is xx Million.
Media and Entertainment: This segment includes applications in virtual reality (VR) and augmented reality (AR) gaming, entertainment, and education. Growth is expected to be influenced by consumer adoption trends. Market size is estimated at xx Million in 2025.
Other End-user Verticals: This segment encompasses various industrial applications, such as design, training, and simulation. The market size is estimated at xx Million in 2025.
Key Drivers of Virtual Retinal Display Industry Growth
Several factors contribute to the growth of the VRD industry. Advancements in micro-display technology, particularly OLED and micro-LED displays, are enabling higher resolution, wider field-of-view, and more power-efficient devices. Increased investment in R&D from both private companies and governments fuels innovation. The rising demand for immersive experiences in gaming, entertainment, and education stimulates market expansion. Furthermore, the integration of VRD in various medical and industrial applications presents significant growth opportunities. Government initiatives promoting technological advancement also play a role in market growth.
Challenges in the Virtual Retinal Display Industry Sector
Despite promising growth prospects, several challenges hinder the widespread adoption of VRD technology. High manufacturing costs and the complexity of integrating sophisticated optics pose significant barriers. Potential health concerns related to prolonged use, such as eye strain and motion sickness, require careful consideration and mitigation strategies. The relatively high cost of devices compared to traditional display technologies also limits market penetration. Competition from alternative display technologies also presents an ongoing challenge. These factors contribute to a slower than expected market expansion for the industry.
Emerging Opportunities in Virtual Retinal Display Industry
Emerging opportunities are plentiful in the VRD industry. The development of new display technologies such as holographic displays and advancements in eye-tracking technology hold significant potential. The integration of VRD technology into wearable devices and the expansion into new application areas, such as industrial automation and remote collaboration, present attractive opportunities. The increasing adoption of 5G and other high-bandwidth networks facilitates the deployment of high-resolution VRD systems. Growing demand for enhanced user experiences in areas like education and healthcare creates further opportunities for market expansion.
Leading Players in the Virtual Retinal Display Industry Market
- Vuzix
- OmniVision Technologies Inc
- Texas Instruments Inc
- eMagin Corporation
- Magic Leap Inc
- Optivent
- Human Interface Technology Laboratory
- Avegant Corporation
- Movidius Inc (Intel Corporation)
- QD Laser Co Ltd
- Analogix Semiconductor Inc
- Himax Technologies Inc
Key Developments in Virtual Retinal Display Industry Industry
December 2022: Meta confirms plans to bring a Retina-resolution VR headset to product maturity. This announcement highlights a significant industry milestone, signaling a push for higher resolution and more immersive VR experiences. Meta's Quest Pro, with 22 PPD (pixels per degree), demonstrates advancements in display technology, though it still falls short of the Retina's approximately 60 PPD. The Butterscotch prototype, achieving 55 PPD but with a reduced field of view, represents a further step towards this goal.
December 2022: eMagin Corporation's participation at the 10th International Congress on OCT and OCT Angiography showcases the increasing adoption of high-resolution OLED microdisplays in medical applications. This highlights the expanding use of VRD technology in the medical and life sciences sector.
Strategic Outlook for Virtual Retinal Display Industry Market
The future of the virtual retinal display market is promising. Continued technological advancements, specifically in display resolution, field-of-view, and power efficiency, are key growth catalysts. Expansion into new applications across healthcare, aerospace, and industrial sectors will drive market growth. Strategic partnerships and mergers and acquisitions will play a significant role in shaping the competitive landscape. The increasing demand for immersive experiences across various segments ensures sustained growth potential for the virtual retinal display market over the next decade.
Virtual Retinal Display Industry Segmentation
-
1. End-user Industry
- 1.1. Medical & Lifesciences
- 1.2. Aerospace and Defense
- 1.3. Media and Entertainment
- 1.4. Other End-user Verticals
Virtual Retinal Display Industry Segmentation By Geography
- 1. North America
- 2. Europe
- 3. Asia Pacific
- 4. Latin America
- 5. Middle East
Virtual Retinal Display Industry REPORT HIGHLIGHTS
| Aspects | Details |
|---|---|
| Study Period | 2019-2033 |
| Base Year | 2024 |
| Estimated Year | 2025 |
| Forecast Period | 2025-2033 |
| Historical Period | 2019-2024 |
| Growth Rate | CAGR of 42.60% from 2019-2033 |
| Segmentation |
|
Table of Contents
- 1. Introduction
- 1.1. Research Scope
- 1.2. Market Segmentation
- 1.3. Research Methodology
- 1.4. Definitions and Assumptions
- 2. Executive Summary
- 2.1. Introduction
- 3. Market Dynamics
- 3.1. Introduction
- 3.2. Market Drivers
- 3.2.1. Technical Advantages Over Screen-Based Devices
- 3.3. Market Restrains
- 3.3.1. Security Concerns Regarding Cloud-based Solutions
- 3.4. Market Trends
- 3.4.1. Virtual Reality and Augmented Reality are Gaining Surging Demand from the Entertainment Industry
- 4. Market Factor Analysis
- 4.1. Porters Five Forces
- 4.2. Supply/Value Chain
- 4.3. PESTEL analysis
- 4.4. Market Entropy
- 4.5. Patent/Trademark Analysis
- 5. Global Virtual Retinal Display Industry Analysis, Insights and Forecast, 2019-2031
- 5.1. Market Analysis, Insights and Forecast - by End-user Industry
- 5.1.1. Medical & Lifesciences
- 5.1.2. Aerospace and Defense
- 5.1.3. Media and Entertainment
- 5.1.4. Other End-user Verticals
- 5.2. Market Analysis, Insights and Forecast - by Region
- 5.2.1. North America
- 5.2.2. Europe
- 5.2.3. Asia Pacific
- 5.2.4. Latin America
- 5.2.5. Middle East
- 5.1. Market Analysis, Insights and Forecast - by End-user Industry
- 6. North America Virtual Retinal Display Industry Analysis, Insights and Forecast, 2019-2031
- 6.1. Market Analysis, Insights and Forecast - by End-user Industry
- 6.1.1. Medical & Lifesciences
- 6.1.2. Aerospace and Defense
- 6.1.3. Media and Entertainment
- 6.1.4. Other End-user Verticals
- 6.1. Market Analysis, Insights and Forecast - by End-user Industry
- 7. Europe Virtual Retinal Display Industry Analysis, Insights and Forecast, 2019-2031
- 7.1. Market Analysis, Insights and Forecast - by End-user Industry
- 7.1.1. Medical & Lifesciences
- 7.1.2. Aerospace and Defense
- 7.1.3. Media and Entertainment
- 7.1.4. Other End-user Verticals
- 7.1. Market Analysis, Insights and Forecast - by End-user Industry
- 8. Asia Pacific Virtual Retinal Display Industry Analysis, Insights and Forecast, 2019-2031
- 8.1. Market Analysis, Insights and Forecast - by End-user Industry
- 8.1.1. Medical & Lifesciences
- 8.1.2. Aerospace and Defense
- 8.1.3. Media and Entertainment
- 8.1.4. Other End-user Verticals
- 8.1. Market Analysis, Insights and Forecast - by End-user Industry
- 9. Latin America Virtual Retinal Display Industry Analysis, Insights and Forecast, 2019-2031
- 9.1. Market Analysis, Insights and Forecast - by End-user Industry
- 9.1.1. Medical & Lifesciences
- 9.1.2. Aerospace and Defense
- 9.1.3. Media and Entertainment
- 9.1.4. Other End-user Verticals
- 9.1. Market Analysis, Insights and Forecast - by End-user Industry
- 10. Middle East Virtual Retinal Display Industry Analysis, Insights and Forecast, 2019-2031
- 10.1. Market Analysis, Insights and Forecast - by End-user Industry
- 10.1.1. Medical & Lifesciences
- 10.1.2. Aerospace and Defense
- 10.1.3. Media and Entertainment
- 10.1.4. Other End-user Verticals
- 10.1. Market Analysis, Insights and Forecast - by End-user Industry
- 11. North America Virtual Retinal Display Industry Analysis, Insights and Forecast, 2019-2031
- 11.1. Market Analysis, Insights and Forecast - By Country/Sub-region
- 11.1.1 United States
- 11.1.2 Canada
- 11.1.3 Mexico
- 12. Europe Virtual Retinal Display Industry Analysis, Insights and Forecast, 2019-2031
- 12.1. Market Analysis, Insights and Forecast - By Country/Sub-region
- 12.1.1 Germany
- 12.1.2 United Kingdom
- 12.1.3 France
- 12.1.4 Spain
- 12.1.5 Italy
- 12.1.6 Spain
- 12.1.7 Belgium
- 12.1.8 Netherland
- 12.1.9 Nordics
- 12.1.10 Rest of Europe
- 13. Asia Pacific Virtual Retinal Display Industry Analysis, Insights and Forecast, 2019-2031
- 13.1. Market Analysis, Insights and Forecast - By Country/Sub-region
- 13.1.1 China
- 13.1.2 Japan
- 13.1.3 India
- 13.1.4 South Korea
- 13.1.5 Southeast Asia
- 13.1.6 Australia
- 13.1.7 Indonesia
- 13.1.8 Phillipes
- 13.1.9 Singapore
- 13.1.10 Thailandc
- 13.1.11 Rest of Asia Pacific
- 14. South America Virtual Retinal Display Industry Analysis, Insights and Forecast, 2019-2031
- 14.1. Market Analysis, Insights and Forecast - By Country/Sub-region
- 14.1.1 Brazil
- 14.1.2 Argentina
- 14.1.3 Peru
- 14.1.4 Chile
- 14.1.5 Colombia
- 14.1.6 Ecuador
- 14.1.7 Venezuela
- 14.1.8 Rest of South America
- 15. North America Virtual Retinal Display Industry Analysis, Insights and Forecast, 2019-2031
- 15.1. Market Analysis, Insights and Forecast - By Country/Sub-region
- 15.1.1 United States
- 15.1.2 Canada
- 15.1.3 Mexico
- 16. MEA Virtual Retinal Display Industry Analysis, Insights and Forecast, 2019-2031
- 16.1. Market Analysis, Insights and Forecast - By Country/Sub-region
- 16.1.1 United Arab Emirates
- 16.1.2 Saudi Arabia
- 16.1.3 South Africa
- 16.1.4 Rest of Middle East and Africa
- 17. Competitive Analysis
- 17.1. Global Market Share Analysis 2024
- 17.2. Company Profiles
- 17.2.1 Vuzix
- 17.2.1.1. Overview
- 17.2.1.2. Products
- 17.2.1.3. SWOT Analysis
- 17.2.1.4. Recent Developments
- 17.2.1.5. Financials (Based on Availability)
- 17.2.2 OmniVision Technologies Inc
- 17.2.2.1. Overview
- 17.2.2.2. Products
- 17.2.2.3. SWOT Analysis
- 17.2.2.4. Recent Developments
- 17.2.2.5. Financials (Based on Availability)
- 17.2.3 Texas Instruments Inc
- 17.2.3.1. Overview
- 17.2.3.2. Products
- 17.2.3.3. SWOT Analysis
- 17.2.3.4. Recent Developments
- 17.2.3.5. Financials (Based on Availability)
- 17.2.4 eMagin Corporation
- 17.2.4.1. Overview
- 17.2.4.2. Products
- 17.2.4.3. SWOT Analysis
- 17.2.4.4. Recent Developments
- 17.2.4.5. Financials (Based on Availability)
- 17.2.5 Magic Leap Inc
- 17.2.5.1. Overview
- 17.2.5.2. Products
- 17.2.5.3. SWOT Analysis
- 17.2.5.4. Recent Developments
- 17.2.5.5. Financials (Based on Availability)
- 17.2.6 Optivent
- 17.2.6.1. Overview
- 17.2.6.2. Products
- 17.2.6.3. SWOT Analysis
- 17.2.6.4. Recent Developments
- 17.2.6.5. Financials (Based on Availability)
- 17.2.7 Human Interface Technology Laboratory
- 17.2.7.1. Overview
- 17.2.7.2. Products
- 17.2.7.3. SWOT Analysis
- 17.2.7.4. Recent Developments
- 17.2.7.5. Financials (Based on Availability)
- 17.2.8 Avegant Corporation
- 17.2.8.1. Overview
- 17.2.8.2. Products
- 17.2.8.3. SWOT Analysis
- 17.2.8.4. Recent Developments
- 17.2.8.5. Financials (Based on Availability)
- 17.2.9 Movidius Inc (Intel Corporation)
- 17.2.9.1. Overview
- 17.2.9.2. Products
- 17.2.9.3. SWOT Analysis
- 17.2.9.4. Recent Developments
- 17.2.9.5. Financials (Based on Availability)
- 17.2.10 QD Laser Co Ltd
- 17.2.10.1. Overview
- 17.2.10.2. Products
- 17.2.10.3. SWOT Analysis
- 17.2.10.4. Recent Developments
- 17.2.10.5. Financials (Based on Availability)
- 17.2.11 Analogix Semiconductor Inc
- 17.2.11.1. Overview
- 17.2.11.2. Products
- 17.2.11.3. SWOT Analysis
- 17.2.11.4. Recent Developments
- 17.2.11.5. Financials (Based on Availability)
- 17.2.12 Himax Technologies Inc
- 17.2.12.1. Overview
- 17.2.12.2. Products
- 17.2.12.3. SWOT Analysis
- 17.2.12.4. Recent Developments
- 17.2.12.5. Financials (Based on Availability)
- 17.2.1 Vuzix
List of Figures
- Figure 1: Global Virtual Retinal Display Industry Revenue Breakdown (Million, %) by Region 2024 & 2032
- Figure 2: Global Virtual Retinal Display Industry Volume Breakdown (K Unit, %) by Region 2024 & 2032
- Figure 3: North America Virtual Retinal Display Industry Revenue (Million), by Country 2024 & 2032
- Figure 4: North America Virtual Retinal Display Industry Volume (K Unit), by Country 2024 & 2032
- Figure 5: North America Virtual Retinal Display Industry Revenue Share (%), by Country 2024 & 2032
- Figure 6: North America Virtual Retinal Display Industry Volume Share (%), by Country 2024 & 2032
- Figure 7: Europe Virtual Retinal Display Industry Revenue (Million), by Country 2024 & 2032
- Figure 8: Europe Virtual Retinal Display Industry Volume (K Unit), by Country 2024 & 2032
- Figure 9: Europe Virtual Retinal Display Industry Revenue Share (%), by Country 2024 & 2032
- Figure 10: Europe Virtual Retinal Display Industry Volume Share (%), by Country 2024 & 2032
- Figure 11: Asia Pacific Virtual Retinal Display Industry Revenue (Million), by Country 2024 & 2032
- Figure 12: Asia Pacific Virtual Retinal Display Industry Volume (K Unit), by Country 2024 & 2032
- Figure 13: Asia Pacific Virtual Retinal Display Industry Revenue Share (%), by Country 2024 & 2032
- Figure 14: Asia Pacific Virtual Retinal Display Industry Volume Share (%), by Country 2024 & 2032
- Figure 15: South America Virtual Retinal Display Industry Revenue (Million), by Country 2024 & 2032
- Figure 16: South America Virtual Retinal Display Industry Volume (K Unit), by Country 2024 & 2032
- Figure 17: South America Virtual Retinal Display Industry Revenue Share (%), by Country 2024 & 2032
- Figure 18: South America Virtual Retinal Display Industry Volume Share (%), by Country 2024 & 2032
- Figure 19: North America Virtual Retinal Display Industry Revenue (Million), by Country 2024 & 2032
- Figure 20: North America Virtual Retinal Display Industry Volume (K Unit), by Country 2024 & 2032
- Figure 21: North America Virtual Retinal Display Industry Revenue Share (%), by Country 2024 & 2032
- Figure 22: North America Virtual Retinal Display Industry Volume Share (%), by Country 2024 & 2032
- Figure 23: MEA Virtual Retinal Display Industry Revenue (Million), by Country 2024 & 2032
- Figure 24: MEA Virtual Retinal Display Industry Volume (K Unit), by Country 2024 & 2032
- Figure 25: MEA Virtual Retinal Display Industry Revenue Share (%), by Country 2024 & 2032
- Figure 26: MEA Virtual Retinal Display Industry Volume Share (%), by Country 2024 & 2032
- Figure 27: North America Virtual Retinal Display Industry Revenue (Million), by End-user Industry 2024 & 2032
- Figure 28: North America Virtual Retinal Display Industry Volume (K Unit), by End-user Industry 2024 & 2032
- Figure 29: North America Virtual Retinal Display Industry Revenue Share (%), by End-user Industry 2024 & 2032
- Figure 30: North America Virtual Retinal Display Industry Volume Share (%), by End-user Industry 2024 & 2032
- Figure 31: North America Virtual Retinal Display Industry Revenue (Million), by Country 2024 & 2032
- Figure 32: North America Virtual Retinal Display Industry Volume (K Unit), by Country 2024 & 2032
- Figure 33: North America Virtual Retinal Display Industry Revenue Share (%), by Country 2024 & 2032
- Figure 34: North America Virtual Retinal Display Industry Volume Share (%), by Country 2024 & 2032
- Figure 35: Europe Virtual Retinal Display Industry Revenue (Million), by End-user Industry 2024 & 2032
- Figure 36: Europe Virtual Retinal Display Industry Volume (K Unit), by End-user Industry 2024 & 2032
- Figure 37: Europe Virtual Retinal Display Industry Revenue Share (%), by End-user Industry 2024 & 2032
- Figure 38: Europe Virtual Retinal Display Industry Volume Share (%), by End-user Industry 2024 & 2032
- Figure 39: Europe Virtual Retinal Display Industry Revenue (Million), by Country 2024 & 2032
- Figure 40: Europe Virtual Retinal Display Industry Volume (K Unit), by Country 2024 & 2032
- Figure 41: Europe Virtual Retinal Display Industry Revenue Share (%), by Country 2024 & 2032
- Figure 42: Europe Virtual Retinal Display Industry Volume Share (%), by Country 2024 & 2032
- Figure 43: Asia Pacific Virtual Retinal Display Industry Revenue (Million), by End-user Industry 2024 & 2032
- Figure 44: Asia Pacific Virtual Retinal Display Industry Volume (K Unit), by End-user Industry 2024 & 2032
- Figure 45: Asia Pacific Virtual Retinal Display Industry Revenue Share (%), by End-user Industry 2024 & 2032
- Figure 46: Asia Pacific Virtual Retinal Display Industry Volume Share (%), by End-user Industry 2024 & 2032
- Figure 47: Asia Pacific Virtual Retinal Display Industry Revenue (Million), by Country 2024 & 2032
- Figure 48: Asia Pacific Virtual Retinal Display Industry Volume (K Unit), by Country 2024 & 2032
- Figure 49: Asia Pacific Virtual Retinal Display Industry Revenue Share (%), by Country 2024 & 2032
- Figure 50: Asia Pacific Virtual Retinal Display Industry Volume Share (%), by Country 2024 & 2032
- Figure 51: Latin America Virtual Retinal Display Industry Revenue (Million), by End-user Industry 2024 & 2032
- Figure 52: Latin America Virtual Retinal Display Industry Volume (K Unit), by End-user Industry 2024 & 2032
- Figure 53: Latin America Virtual Retinal Display Industry Revenue Share (%), by End-user Industry 2024 & 2032
- Figure 54: Latin America Virtual Retinal Display Industry Volume Share (%), by End-user Industry 2024 & 2032
- Figure 55: Latin America Virtual Retinal Display Industry Revenue (Million), by Country 2024 & 2032
- Figure 56: Latin America Virtual Retinal Display Industry Volume (K Unit), by Country 2024 & 2032
- Figure 57: Latin America Virtual Retinal Display Industry Revenue Share (%), by Country 2024 & 2032
- Figure 58: Latin America Virtual Retinal Display Industry Volume Share (%), by Country 2024 & 2032
- Figure 59: Middle East Virtual Retinal Display Industry Revenue (Million), by End-user Industry 2024 & 2032
- Figure 60: Middle East Virtual Retinal Display Industry Volume (K Unit), by End-user Industry 2024 & 2032
- Figure 61: Middle East Virtual Retinal Display Industry Revenue Share (%), by End-user Industry 2024 & 2032
- Figure 62: Middle East Virtual Retinal Display Industry Volume Share (%), by End-user Industry 2024 & 2032
- Figure 63: Middle East Virtual Retinal Display Industry Revenue (Million), by Country 2024 & 2032
- Figure 64: Middle East Virtual Retinal Display Industry Volume (K Unit), by Country 2024 & 2032
- Figure 65: Middle East Virtual Retinal Display Industry Revenue Share (%), by Country 2024 & 2032
- Figure 66: Middle East Virtual Retinal Display Industry Volume Share (%), by Country 2024 & 2032
List of Tables
- Table 1: Global Virtual Retinal Display Industry Revenue Million Forecast, by Region 2019 & 2032
- Table 2: Global Virtual Retinal Display Industry Volume K Unit Forecast, by Region 2019 & 2032
- Table 3: Global Virtual Retinal Display Industry Revenue Million Forecast, by End-user Industry 2019 & 2032
- Table 4: Global Virtual Retinal Display Industry Volume K Unit Forecast, by End-user Industry 2019 & 2032
- Table 5: Global Virtual Retinal Display Industry Revenue Million Forecast, by Region 2019 & 2032
- Table 6: Global Virtual Retinal Display Industry Volume K Unit Forecast, by Region 2019 & 2032
- Table 7: Global Virtual Retinal Display Industry Revenue Million Forecast, by Country 2019 & 2032
- Table 8: Global Virtual Retinal Display Industry Volume K Unit Forecast, by Country 2019 & 2032
- Table 9: United States Virtual Retinal Display Industry Revenue (Million) Forecast, by Application 2019 & 2032
- Table 10: United States Virtual Retinal Display Industry Volume (K Unit) Forecast, by Application 2019 & 2032
- Table 11: Canada Virtual Retinal Display Industry Revenue (Million) Forecast, by Application 2019 & 2032
- Table 12: Canada Virtual Retinal Display Industry Volume (K Unit) Forecast, by Application 2019 & 2032
- Table 13: Mexico Virtual Retinal Display Industry Revenue (Million) Forecast, by Application 2019 & 2032
- Table 14: Mexico Virtual Retinal Display Industry Volume (K Unit) Forecast, by Application 2019 & 2032
- Table 15: Global Virtual Retinal Display Industry Revenue Million Forecast, by Country 2019 & 2032
- Table 16: Global Virtual Retinal Display Industry Volume K Unit Forecast, by Country 2019 & 2032
- Table 17: Germany Virtual Retinal Display Industry Revenue (Million) Forecast, by Application 2019 & 2032
- Table 18: Germany Virtual Retinal Display Industry Volume (K Unit) Forecast, by Application 2019 & 2032
- Table 19: United Kingdom Virtual Retinal Display Industry Revenue (Million) Forecast, by Application 2019 & 2032
- Table 20: United Kingdom Virtual Retinal Display Industry Volume (K Unit) Forecast, by Application 2019 & 2032
- Table 21: France Virtual Retinal Display Industry Revenue (Million) Forecast, by Application 2019 & 2032
- Table 22: France Virtual Retinal Display Industry Volume (K Unit) Forecast, by Application 2019 & 2032
- Table 23: Spain Virtual Retinal Display Industry Revenue (Million) Forecast, by Application 2019 & 2032
- Table 24: Spain Virtual Retinal Display Industry Volume (K Unit) Forecast, by Application 2019 & 2032
- Table 25: Italy Virtual Retinal Display Industry Revenue (Million) Forecast, by Application 2019 & 2032
- Table 26: Italy Virtual Retinal Display Industry Volume (K Unit) Forecast, by Application 2019 & 2032
- Table 27: Spain Virtual Retinal Display Industry Revenue (Million) Forecast, by Application 2019 & 2032
- Table 28: Spain Virtual Retinal Display Industry Volume (K Unit) Forecast, by Application 2019 & 2032
- Table 29: Belgium Virtual Retinal Display Industry Revenue (Million) Forecast, by Application 2019 & 2032
- Table 30: Belgium Virtual Retinal Display Industry Volume (K Unit) Forecast, by Application 2019 & 2032
- Table 31: Netherland Virtual Retinal Display Industry Revenue (Million) Forecast, by Application 2019 & 2032
- Table 32: Netherland Virtual Retinal Display Industry Volume (K Unit) Forecast, by Application 2019 & 2032
- Table 33: Nordics Virtual Retinal Display Industry Revenue (Million) Forecast, by Application 2019 & 2032
- Table 34: Nordics Virtual Retinal Display Industry Volume (K Unit) Forecast, by Application 2019 & 2032
- Table 35: Rest of Europe Virtual Retinal Display Industry Revenue (Million) Forecast, by Application 2019 & 2032
- Table 36: Rest of Europe Virtual Retinal Display Industry Volume (K Unit) Forecast, by Application 2019 & 2032
- Table 37: Global Virtual Retinal Display Industry Revenue Million Forecast, by Country 2019 & 2032
- Table 38: Global Virtual Retinal Display Industry Volume K Unit Forecast, by Country 2019 & 2032
- Table 39: China Virtual Retinal Display Industry Revenue (Million) Forecast, by Application 2019 & 2032
- Table 40: China Virtual Retinal Display Industry Volume (K Unit) Forecast, by Application 2019 & 2032
- Table 41: Japan Virtual Retinal Display Industry Revenue (Million) Forecast, by Application 2019 & 2032
- Table 42: Japan Virtual Retinal Display Industry Volume (K Unit) Forecast, by Application 2019 & 2032
- Table 43: India Virtual Retinal Display Industry Revenue (Million) Forecast, by Application 2019 & 2032
- Table 44: India Virtual Retinal Display Industry Volume (K Unit) Forecast, by Application 2019 & 2032
- Table 45: South Korea Virtual Retinal Display Industry Revenue (Million) Forecast, by Application 2019 & 2032
- Table 46: South Korea Virtual Retinal Display Industry Volume (K Unit) Forecast, by Application 2019 & 2032
- Table 47: Southeast Asia Virtual Retinal Display Industry Revenue (Million) Forecast, by Application 2019 & 2032
- Table 48: Southeast Asia Virtual Retinal Display Industry Volume (K Unit) Forecast, by Application 2019 & 2032
- Table 49: Australia Virtual Retinal Display Industry Revenue (Million) Forecast, by Application 2019 & 2032
- Table 50: Australia Virtual Retinal Display Industry Volume (K Unit) Forecast, by Application 2019 & 2032
- Table 51: Indonesia Virtual Retinal Display Industry Revenue (Million) Forecast, by Application 2019 & 2032
- Table 52: Indonesia Virtual Retinal Display Industry Volume (K Unit) Forecast, by Application 2019 & 2032
- Table 53: Phillipes Virtual Retinal Display Industry Revenue (Million) Forecast, by Application 2019 & 2032
- Table 54: Phillipes Virtual Retinal Display Industry Volume (K Unit) Forecast, by Application 2019 & 2032
- Table 55: Singapore Virtual Retinal Display Industry Revenue (Million) Forecast, by Application 2019 & 2032
- Table 56: Singapore Virtual Retinal Display Industry Volume (K Unit) Forecast, by Application 2019 & 2032
- Table 57: Thailandc Virtual Retinal Display Industry Revenue (Million) Forecast, by Application 2019 & 2032
- Table 58: Thailandc Virtual Retinal Display Industry Volume (K Unit) Forecast, by Application 2019 & 2032
- Table 59: Rest of Asia Pacific Virtual Retinal Display Industry Revenue (Million) Forecast, by Application 2019 & 2032
- Table 60: Rest of Asia Pacific Virtual Retinal Display Industry Volume (K Unit) Forecast, by Application 2019 & 2032
- Table 61: Global Virtual Retinal Display Industry Revenue Million Forecast, by Country 2019 & 2032
- Table 62: Global Virtual Retinal Display Industry Volume K Unit Forecast, by Country 2019 & 2032
- Table 63: Brazil Virtual Retinal Display Industry Revenue (Million) Forecast, by Application 2019 & 2032
- Table 64: Brazil Virtual Retinal Display Industry Volume (K Unit) Forecast, by Application 2019 & 2032
- Table 65: Argentina Virtual Retinal Display Industry Revenue (Million) Forecast, by Application 2019 & 2032
- Table 66: Argentina Virtual Retinal Display Industry Volume (K Unit) Forecast, by Application 2019 & 2032
- Table 67: Peru Virtual Retinal Display Industry Revenue (Million) Forecast, by Application 2019 & 2032
- Table 68: Peru Virtual Retinal Display Industry Volume (K Unit) Forecast, by Application 2019 & 2032
- Table 69: Chile Virtual Retinal Display Industry Revenue (Million) Forecast, by Application 2019 & 2032
- Table 70: Chile Virtual Retinal Display Industry Volume (K Unit) Forecast, by Application 2019 & 2032
- Table 71: Colombia Virtual Retinal Display Industry Revenue (Million) Forecast, by Application 2019 & 2032
- Table 72: Colombia Virtual Retinal Display Industry Volume (K Unit) Forecast, by Application 2019 & 2032
- Table 73: Ecuador Virtual Retinal Display Industry Revenue (Million) Forecast, by Application 2019 & 2032
- Table 74: Ecuador Virtual Retinal Display Industry Volume (K Unit) Forecast, by Application 2019 & 2032
- Table 75: Venezuela Virtual Retinal Display Industry Revenue (Million) Forecast, by Application 2019 & 2032
- Table 76: Venezuela Virtual Retinal Display Industry Volume (K Unit) Forecast, by Application 2019 & 2032
- Table 77: Rest of South America Virtual Retinal Display Industry Revenue (Million) Forecast, by Application 2019 & 2032
- Table 78: Rest of South America Virtual Retinal Display Industry Volume (K Unit) Forecast, by Application 2019 & 2032
- Table 79: Global Virtual Retinal Display Industry Revenue Million Forecast, by Country 2019 & 2032
- Table 80: Global Virtual Retinal Display Industry Volume K Unit Forecast, by Country 2019 & 2032
- Table 81: United States Virtual Retinal Display Industry Revenue (Million) Forecast, by Application 2019 & 2032
- Table 82: United States Virtual Retinal Display Industry Volume (K Unit) Forecast, by Application 2019 & 2032
- Table 83: Canada Virtual Retinal Display Industry Revenue (Million) Forecast, by Application 2019 & 2032
- Table 84: Canada Virtual Retinal Display Industry Volume (K Unit) Forecast, by Application 2019 & 2032
- Table 85: Mexico Virtual Retinal Display Industry Revenue (Million) Forecast, by Application 2019 & 2032
- Table 86: Mexico Virtual Retinal Display Industry Volume (K Unit) Forecast, by Application 2019 & 2032
- Table 87: Global Virtual Retinal Display Industry Revenue Million Forecast, by Country 2019 & 2032
- Table 88: Global Virtual Retinal Display Industry Volume K Unit Forecast, by Country 2019 & 2032
- Table 89: United Arab Emirates Virtual Retinal Display Industry Revenue (Million) Forecast, by Application 2019 & 2032
- Table 90: United Arab Emirates Virtual Retinal Display Industry Volume (K Unit) Forecast, by Application 2019 & 2032
- Table 91: Saudi Arabia Virtual Retinal Display Industry Revenue (Million) Forecast, by Application 2019 & 2032
- Table 92: Saudi Arabia Virtual Retinal Display Industry Volume (K Unit) Forecast, by Application 2019 & 2032
- Table 93: South Africa Virtual Retinal Display Industry Revenue (Million) Forecast, by Application 2019 & 2032
- Table 94: South Africa Virtual Retinal Display Industry Volume (K Unit) Forecast, by Application 2019 & 2032
- Table 95: Rest of Middle East and Africa Virtual Retinal Display Industry Revenue (Million) Forecast, by Application 2019 & 2032
- Table 96: Rest of Middle East and Africa Virtual Retinal Display Industry Volume (K Unit) Forecast, by Application 2019 & 2032
- Table 97: Global Virtual Retinal Display Industry Revenue Million Forecast, by End-user Industry 2019 & 2032
- Table 98: Global Virtual Retinal Display Industry Volume K Unit Forecast, by End-user Industry 2019 & 2032
- Table 99: Global Virtual Retinal Display Industry Revenue Million Forecast, by Country 2019 & 2032
- Table 100: Global Virtual Retinal Display Industry Volume K Unit Forecast, by Country 2019 & 2032
- Table 101: Global Virtual Retinal Display Industry Revenue Million Forecast, by End-user Industry 2019 & 2032
- Table 102: Global Virtual Retinal Display Industry Volume K Unit Forecast, by End-user Industry 2019 & 2032
- Table 103: Global Virtual Retinal Display Industry Revenue Million Forecast, by Country 2019 & 2032
- Table 104: Global Virtual Retinal Display Industry Volume K Unit Forecast, by Country 2019 & 2032
- Table 105: Global Virtual Retinal Display Industry Revenue Million Forecast, by End-user Industry 2019 & 2032
- Table 106: Global Virtual Retinal Display Industry Volume K Unit Forecast, by End-user Industry 2019 & 2032
- Table 107: Global Virtual Retinal Display Industry Revenue Million Forecast, by Country 2019 & 2032
- Table 108: Global Virtual Retinal Display Industry Volume K Unit Forecast, by Country 2019 & 2032
- Table 109: Global Virtual Retinal Display Industry Revenue Million Forecast, by End-user Industry 2019 & 2032
- Table 110: Global Virtual Retinal Display Industry Volume K Unit Forecast, by End-user Industry 2019 & 2032
- Table 111: Global Virtual Retinal Display Industry Revenue Million Forecast, by Country 2019 & 2032
- Table 112: Global Virtual Retinal Display Industry Volume K Unit Forecast, by Country 2019 & 2032
- Table 113: Global Virtual Retinal Display Industry Revenue Million Forecast, by End-user Industry 2019 & 2032
- Table 114: Global Virtual Retinal Display Industry Volume K Unit Forecast, by End-user Industry 2019 & 2032
- Table 115: Global Virtual Retinal Display Industry Revenue Million Forecast, by Country 2019 & 2032
- Table 116: Global Virtual Retinal Display Industry Volume K Unit Forecast, by Country 2019 & 2032
Frequently Asked Questions
1. What is the projected Compound Annual Growth Rate (CAGR) of the Virtual Retinal Display Industry?
The projected CAGR is approximately 42.60%.
2. Which companies are prominent players in the Virtual Retinal Display Industry?
Key companies in the market include Vuzix, OmniVision Technologies Inc, Texas Instruments Inc, eMagin Corporation, Magic Leap Inc, Optivent, Human Interface Technology Laboratory, Avegant Corporation, Movidius Inc (Intel Corporation), QD Laser Co Ltd, Analogix Semiconductor Inc, Himax Technologies Inc.
3. What are the main segments of the Virtual Retinal Display Industry?
The market segments include End-user Industry.
4. Can you provide details about the market size?
The market size is estimated to be USD XX Million as of 2022.
5. What are some drivers contributing to market growth?
Technical Advantages Over Screen-Based Devices.
6. What are the notable trends driving market growth?
Virtual Reality and Augmented Reality are Gaining Surging Demand from the Entertainment Industry.
7. Are there any restraints impacting market growth?
Security Concerns Regarding Cloud-based Solutions.
8. Can you provide examples of recent developments in the market?
December 2022: Meta confirms that it plans to bring a Retina-resolution VR headset to product maturity. Quest Pro has ten percent more PPD than Meta Quest 2, according to Meta (22 vs. 20 PPD). The PPD value takes the screen and the optics into account and measures the number of pixels within 1° of the field of view. For comparison, the Retina's 'resolution' is around 60 PPD, which is also the value Meta is aiming In the summer, display researchers presented the Butterscotch prototype, which achieves 55 PPD, but only has half the field of view of Meta Quest 2.
9. What pricing options are available for accessing the report?
Pricing options include single-user, multi-user, and enterprise licenses priced at USD 4750, USD 5250, and USD 8750 respectively.
10. Is the market size provided in terms of value or volume?
The market size is provided in terms of value, measured in Million and volume, measured in K Unit.
11. Are there any specific market keywords associated with the report?
Yes, the market keyword associated with the report is "Virtual Retinal Display Industry," which aids in identifying and referencing the specific market segment covered.
12. How do I determine which pricing option suits my needs best?
The pricing options vary based on user requirements and access needs. Individual users may opt for single-user licenses, while businesses requiring broader access may choose multi-user or enterprise licenses for cost-effective access to the report.
13. Are there any additional resources or data provided in the Virtual Retinal Display Industry report?
While the report offers comprehensive insights, it's advisable to review the specific contents or supplementary materials provided to ascertain if additional resources or data are available.
14. How can I stay updated on further developments or reports in the Virtual Retinal Display Industry?
To stay informed about further developments, trends, and reports in the Virtual Retinal Display Industry, consider subscribing to industry newsletters, following relevant companies and organizations, or regularly checking reputable industry news sources and publications.
Methodology
Step 1 - Identification of Relevant Samples Size from Population Database


Step 2 - Approaches for Defining Global Market Size (Value, Volume* & Price*)

Note*: In applicable scenarios
Step 3 - Data Sources
Primary Research
- Web Analytics
- Survey Reports
- Research Institute
- Latest Research Reports
- Opinion Leaders
Secondary Research
- Annual Reports
- White Paper
- Latest Press Release
- Industry Association
- Paid Database
- Investor Presentations

Step 4 - Data Triangulation
Involves using different sources of information in order to increase the validity of a study
These sources are likely to be stakeholders in a program - participants, other researchers, program staff, other community members, and so on.
Then we put all data in single framework & apply various statistical tools to find out the dynamic on the market.
During the analysis stage, feedback from the stakeholder groups would be compared to determine areas of agreement as well as areas of divergence


