
Key Insights
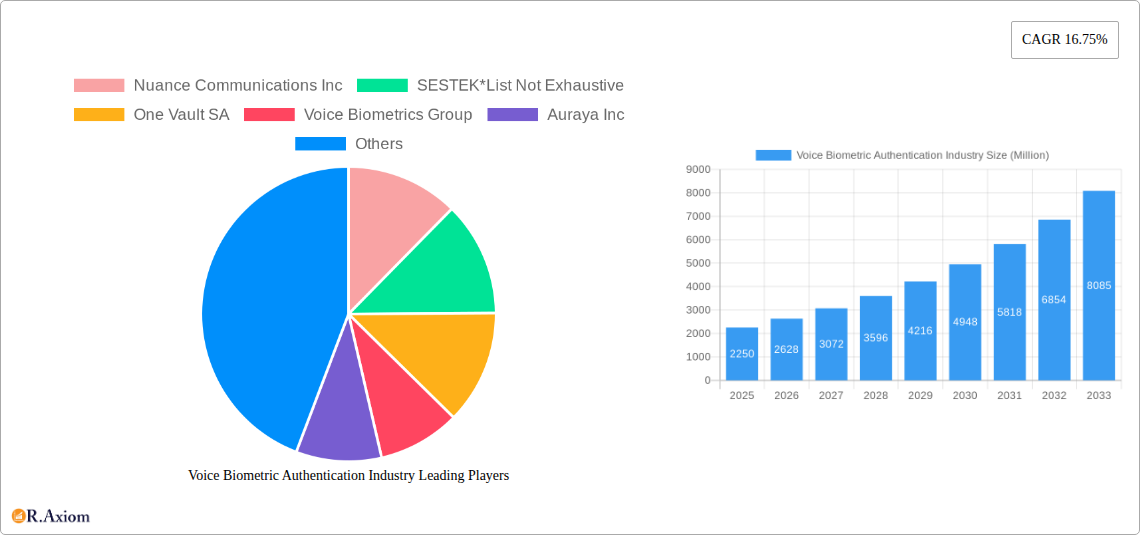
The voice biometric authentication market is experiencing robust growth, projected to reach \$2.25 billion in 2025 and maintain a Compound Annual Growth Rate (CAGR) of 16.75% from 2025 to 2033. This expansion is driven by several key factors. The increasing adoption of cloud-based solutions offers scalability and cost-effectiveness for businesses of all sizes, fueling market penetration. Furthermore, rising concerns about data security and the need for strong authentication methods across various sectors, particularly banking, finance, and e-commerce, are significantly boosting demand. Government regulations mandating enhanced security measures further contribute to market growth. The shift towards passive biometrics, offering a more seamless user experience compared to active methods, also presents a significant growth opportunity. While challenges like accuracy limitations in noisy environments and potential vulnerabilities to spoofing remain, ongoing technological advancements are continuously addressing these concerns, fostering market expansion.
The market segmentation reveals a diverse landscape. Banking, financial services, and insurance (BFSI) currently dominate the vertical market, followed closely by retail and e-commerce, demonstrating the high value placed on secure transactions. The preference for cloud deployment models reflects the growing preference for flexible and scalable solutions. Large enterprises are currently leading adoption, but increasing awareness and cost-effectiveness of solutions are driving penetration among SMEs. Key players such as Nuance Communications, NICE Ltd, and Verint Systems are actively shaping the market with innovative solutions and strategic partnerships, contributing to the overall growth trajectory. The geographical distribution shows strong growth across North America and Europe, with the Asia-Pacific region emerging as a significant market with substantial growth potential due to increasing digitalization and smartphone penetration.
Voice Biometric Authentication Industry Market Report: 2019-2033
This comprehensive report provides a detailed analysis of the Voice Biometric Authentication industry, covering market size, growth drivers, challenges, and key players. The study period spans from 2019 to 2033, with 2025 serving as the base and estimated year. The report offers actionable insights for stakeholders, including vendors, investors, and industry analysts. The market is projected to reach xx Million by 2033, exhibiting a CAGR of xx% during the forecast period (2025-2033).
Voice Biometric Authentication Industry Market Concentration & Innovation
The voice biometric authentication market exhibits a moderately concentrated landscape, with a few major players holding significant market share. Nuance Communications Inc, before its acquisition by Microsoft, held a substantial share, while other key players such as Uniphore Software Systems Pvt Ltd, Pindrop Security Inc, and Verint Systems Inc, contributed significantly. The market share of these and other players, including SESTEK, One Vault SA, Voice Biometrics Group, Auraya Inc, NICE Ltd, LexisNexis Risk Solutions Inc, Lumen Vox LLC (Voice Trust GmBH), Phonexia SRO, Aculab Inc, VoicePIN com Sp z o o, and BioCatch Ltd, varies depending on the specific segment and region. However, an exact breakdown of market share is not available in this overview.
Innovation is a key driver, spurred by advancements in artificial intelligence (AI), machine learning (ML), and deep learning technologies. These advancements enhance accuracy, reduce error rates, and expand the applications of voice biometrics. Regulatory frameworks, such as GDPR and CCPA, influence market dynamics by dictating data privacy and security requirements. The increasing adoption of cloud-based solutions and the rise of passive biometric authentication are noteworthy trends. Product substitutes, such as traditional password-based authentication and other biometric modalities (fingerprint, facial recognition), present competitive challenges. However, the unique strengths of voice biometrics, particularly its convenience and ease of use, ensure its continued growth.
Mergers and acquisitions (M&A) have played a significant role in shaping the industry landscape. For example, Microsoft's acquisition of Nuance Communications in March 2022 significantly altered the competitive dynamics. While precise M&A deal values are not publicly disclosed for all transactions, the Uniphore funding round of USD 400 Million in March 2022 highlights substantial investment in the sector.
Voice Biometric Authentication Industry Industry Trends & Insights
The voice biometric authentication market is experiencing robust growth, driven by the increasing demand for secure and convenient authentication solutions across various industries. The rising adoption of mobile devices, the growth of online transactions, and the escalating concerns around data security are major contributing factors. The market's expansion is further fueled by technological advancements, leading to improved accuracy and reduced vulnerability to spoofing attacks. Consumer preference for frictionless authentication experiences is also a key driver.
The competitive landscape is dynamic, with both established players and new entrants vying for market share. The market is witnessing a shift toward cloud-based deployments, driven by scalability and cost-effectiveness. Passive biometrics is gaining traction due to its seamless integration into existing workflows. The market exhibits varied penetration rates across different verticals, with the BFSI sector showing particularly high adoption. The compound annual growth rate (CAGR) is estimated to be xx% during the forecast period, indicating strong market growth momentum.

Dominant Markets & Segments in Voice Biometric Authentication Industry
Leading Region/Country: North America currently holds the dominant position in the voice biometric authentication market, driven by the high adoption rate in the banking and financial services sector and the presence of several major technology companies. However, the Asia-Pacific region is poised for significant growth in the coming years due to increased digitalization and rising smartphone penetration.
Vertical Dominance: The Banking, Financial Services, and Insurance (BFSI) sector constitutes the largest segment, owing to the stringent security requirements and the need for robust customer authentication. Government and Defense are also high-growth sectors for this technology due to strong security demands.
Type Dominance: Active biometrics currently holds a larger market share, with its established reliability and widespread use. However, passive biometrics is gaining momentum as technology matures and user experience improves.
Deployment Model Dominance: The cloud deployment model is experiencing rapid growth, propelled by its scalability, cost-effectiveness, and ease of management. On-premises deployments still hold a significant share, particularly in organizations with stringent security policies.
Enterprise Size Dominance: Large enterprises are the primary adopters due to their higher budgets and complex security needs. However, Small and Medium Enterprises (SMEs) are increasingly adopting voice biometrics as cost-effective and user-friendly solutions become more accessible.
Key drivers for the dominance of these segments include supportive government policies, well-developed infrastructure, and increasing awareness of security threats in each sector.
Voice Biometric Authentication Industry Product Developments
Recent product innovations have focused on enhancing accuracy, security, and user experience. This includes the development of sophisticated anti-spoofing technologies, improved voice recognition algorithms, and the integration of voice biometrics with other authentication methods. Companies are also emphasizing seamless integration with existing systems and offering solutions tailored to specific vertical needs. The trend towards passive biometric authentication reflects a focus on frictionless user experiences. These developments drive adoption and enhance the overall competitive advantage.
Report Scope & Segmentation Analysis
This report segments the Voice Biometric Authentication market across various parameters:
Vertical: Banking, Financial Services, and Insurance; Retail and E-commerce; Telecommunications and IT; Government and Defense; Other Industry Verticals. Each segment shows varied growth projections, market sizes, and competitive dynamics based on specific sector needs.
Type: Active Biometrics and Passive Biometrics. Passive biometrics is expected to grow at a faster rate than active biometrics due to its enhanced user experience and ease of implementation.
Deployment Model: On-premises and Cloud. Cloud deployment is expected to dominate due to its cost-effectiveness and scalability.
Enterprise Size: Small and Medium Enterprises (SMEs) and Large Enterprises. Large Enterprises currently hold the majority of the market share, but SMEs are showing increased adoption.
Key Drivers of Voice Biometric Authentication Industry Growth
Several factors fuel the growth of the voice biometric authentication market: the increasing demand for secure authentication in various sectors, particularly BFSI and government; the advancements in AI and ML technologies, improving accuracy and security; the rising adoption of cloud-based solutions that enhance scalability and cost-effectiveness; and the growing consumer preference for frictionless authentication experiences. Furthermore, supportive government regulations and policies that emphasize data privacy and security are driving market growth.
Challenges in the Voice Biometric Authentication Industry Sector
The industry faces several challenges. These include concerns about accuracy, particularly in noisy environments, and vulnerabilities to sophisticated spoofing attacks. Regulatory compliance, including adherence to data privacy regulations like GDPR and CCPA, presents operational and legal complexities. Supply chain disruptions can impact the availability of components and affect production timelines. Intense competition among established players and new entrants also poses a significant challenge.
Emerging Opportunities in Voice Biometric Authentication Industry
The market presents several opportunities for growth. The expansion into new verticals, such as healthcare and the Internet of Things (IoT), offers significant potential. The development of more sophisticated anti-spoofing technologies and the integration of voice biometrics with other authentication methods will enhance security and user experience. The increasing demand for seamless and secure authentication across various devices and platforms will drive adoption.
Leading Players in the Voice Biometric Authentication Industry Market
- Nuance Communications Inc
- SESTEK
- One Vault SA
- Voice Biometrics Group
- Auraya Inc
- Uniphore Software Systems Pvt Ltd
- Pindrop Security Inc
- NICE Ltd
- Verint Systems Inc
- LexisNexis Risk Solutions Inc
- Lumen Vox LLC (Voice Trust GmBH)
- Phonexia SRO
- Aculab Inc
- VoicePIN com Sp z o o
- BioCatch Ltd
Key Developments in Voice Biometric Authentication Industry Industry
- March 2022: Uniphore raised USD 400 Million in a funding round led by NEA, demonstrating significant investor confidence in the voice biometrics market.
- March 2022: Microsoft acquired Nuance Communications, expanding its presence in the conversational AI and voice biometrics market. This acquisition reshaped the competitive landscape.
Strategic Outlook for Voice Biometric Authentication Industry Market
The voice biometric authentication market is poised for continued growth, driven by technological advancements, increasing security concerns, and the rising demand for seamless user experiences. New applications in emerging sectors, coupled with ongoing innovations in anti-spoofing and AI technologies, promise a significant expansion of the market in the coming years. The convergence of voice biometrics with other authentication methods and the development of more robust and secure solutions will further drive market expansion and present lucrative opportunities for market players.
Voice Biometric Authentication Industry Segmentation
-
1. Type
- 1.1. Active Biometrics
- 1.2. Passive Biometrics
-
2. Deployment Model
- 2.1. On-premises
- 2.2. Cloud
-
3. Enterprise Size
- 3.1. Small and Medium Enterprises
- 3.2. Large Enterprises
-
4. Vertical
- 4.1. Banking, Financial Services, and Insurance
- 4.2. Retail and E-commerce
- 4.3. Telecommunications and IT
- 4.4. Government and Defense
- 4.5. Other Industry Verticals
Voice Biometric Authentication Industry Segmentation By Geography
-
1. North America
- 1.1. United States
- 1.2. Canada
-
2. Europe
- 2.1. United Kingdom
- 2.2. Germany
- 2.3. France
- 2.4. Rest of Europe
-
3. Asia Pacific
- 3.1. China
- 3.2. Australia
- 3.3. India
- 3.4. Rest of Asia Pacific
-
4. Latin America
- 4.1. Brazil
- 4.2. Mexico
- 4.3. Rest of Latin America
- 5. Middle East and Africa

Voice Biometric Authentication Industry REPORT HIGHLIGHTS
| Aspects | Details |
|---|---|
| Study Period | 2019-2033 |
| Base Year | 2024 |
| Estimated Year | 2025 |
| Forecast Period | 2025-2033 |
| Historical Period | 2019-2024 |
| Growth Rate | CAGR of 16.75% from 2019-2033 |
| Segmentation |
|
Table of Contents
- 1. Introduction
- 1.1. Research Scope
- 1.2. Market Segmentation
- 1.3. Research Methodology
- 1.4. Definitions and Assumptions
- 2. Executive Summary
- 2.1. Introduction
- 3. Market Dynamics
- 3.1. Introduction
- 3.2. Market Drivers
- 3.2.1. Increased Sophistication of Security Threat; Large-scale Adoption of Technology by Governments to Secure Citizens
- 3.3. Market Restrains
- 3.3.1. High Initial Cost Involved
- 3.4. Market Trends
- 3.4.1 Banking
- 3.4.2 Financial Services
- 3.4.3 and Insurance have Emerged as the Leading Fields for Voice Biometric Applications
- 4. Market Factor Analysis
- 4.1. Porters Five Forces
- 4.2. Supply/Value Chain
- 4.3. PESTEL analysis
- 4.4. Market Entropy
- 4.5. Patent/Trademark Analysis
- 5. Global Voice Biometric Authentication Industry Analysis, Insights and Forecast, 2019-2031
- 5.1. Market Analysis, Insights and Forecast - by Type
- 5.1.1. Active Biometrics
- 5.1.2. Passive Biometrics
- 5.2. Market Analysis, Insights and Forecast - by Deployment Model
- 5.2.1. On-premises
- 5.2.2. Cloud
- 5.3. Market Analysis, Insights and Forecast - by Enterprise Size
- 5.3.1. Small and Medium Enterprises
- 5.3.2. Large Enterprises
- 5.4. Market Analysis, Insights and Forecast - by Vertical
- 5.4.1. Banking, Financial Services, and Insurance
- 5.4.2. Retail and E-commerce
- 5.4.3. Telecommunications and IT
- 5.4.4. Government and Defense
- 5.4.5. Other Industry Verticals
- 5.5. Market Analysis, Insights and Forecast - by Region
- 5.5.1. North America
- 5.5.2. Europe
- 5.5.3. Asia Pacific
- 5.5.4. Latin America
- 5.5.5. Middle East and Africa
- 5.1. Market Analysis, Insights and Forecast - by Type
- 6. North America Voice Biometric Authentication Industry Analysis, Insights and Forecast, 2019-2031
- 6.1. Market Analysis, Insights and Forecast - by Type
- 6.1.1. Active Biometrics
- 6.1.2. Passive Biometrics
- 6.2. Market Analysis, Insights and Forecast - by Deployment Model
- 6.2.1. On-premises
- 6.2.2. Cloud
- 6.3. Market Analysis, Insights and Forecast - by Enterprise Size
- 6.3.1. Small and Medium Enterprises
- 6.3.2. Large Enterprises
- 6.4. Market Analysis, Insights and Forecast - by Vertical
- 6.4.1. Banking, Financial Services, and Insurance
- 6.4.2. Retail and E-commerce
- 6.4.3. Telecommunications and IT
- 6.4.4. Government and Defense
- 6.4.5. Other Industry Verticals
- 6.1. Market Analysis, Insights and Forecast - by Type
- 7. Europe Voice Biometric Authentication Industry Analysis, Insights and Forecast, 2019-2031
- 7.1. Market Analysis, Insights and Forecast - by Type
- 7.1.1. Active Biometrics
- 7.1.2. Passive Biometrics
- 7.2. Market Analysis, Insights and Forecast - by Deployment Model
- 7.2.1. On-premises
- 7.2.2. Cloud
- 7.3. Market Analysis, Insights and Forecast - by Enterprise Size
- 7.3.1. Small and Medium Enterprises
- 7.3.2. Large Enterprises
- 7.4. Market Analysis, Insights and Forecast - by Vertical
- 7.4.1. Banking, Financial Services, and Insurance
- 7.4.2. Retail and E-commerce
- 7.4.3. Telecommunications and IT
- 7.4.4. Government and Defense
- 7.4.5. Other Industry Verticals
- 7.1. Market Analysis, Insights and Forecast - by Type
- 8. Asia Pacific Voice Biometric Authentication Industry Analysis, Insights and Forecast, 2019-2031
- 8.1. Market Analysis, Insights and Forecast - by Type
- 8.1.1. Active Biometrics
- 8.1.2. Passive Biometrics
- 8.2. Market Analysis, Insights and Forecast - by Deployment Model
- 8.2.1. On-premises
- 8.2.2. Cloud
- 8.3. Market Analysis, Insights and Forecast - by Enterprise Size
- 8.3.1. Small and Medium Enterprises
- 8.3.2. Large Enterprises
- 8.4. Market Analysis, Insights and Forecast - by Vertical
- 8.4.1. Banking, Financial Services, and Insurance
- 8.4.2. Retail and E-commerce
- 8.4.3. Telecommunications and IT
- 8.4.4. Government and Defense
- 8.4.5. Other Industry Verticals
- 8.1. Market Analysis, Insights and Forecast - by Type
- 9. Latin America Voice Biometric Authentication Industry Analysis, Insights and Forecast, 2019-2031
- 9.1. Market Analysis, Insights and Forecast - by Type
- 9.1.1. Active Biometrics
- 9.1.2. Passive Biometrics
- 9.2. Market Analysis, Insights and Forecast - by Deployment Model
- 9.2.1. On-premises
- 9.2.2. Cloud
- 9.3. Market Analysis, Insights and Forecast - by Enterprise Size
- 9.3.1. Small and Medium Enterprises
- 9.3.2. Large Enterprises
- 9.4. Market Analysis, Insights and Forecast - by Vertical
- 9.4.1. Banking, Financial Services, and Insurance
- 9.4.2. Retail and E-commerce
- 9.4.3. Telecommunications and IT
- 9.4.4. Government and Defense
- 9.4.5. Other Industry Verticals
- 9.1. Market Analysis, Insights and Forecast - by Type
- 10. Middle East and Africa Voice Biometric Authentication Industry Analysis, Insights and Forecast, 2019-2031
- 10.1. Market Analysis, Insights and Forecast - by Type
- 10.1.1. Active Biometrics
- 10.1.2. Passive Biometrics
- 10.2. Market Analysis, Insights and Forecast - by Deployment Model
- 10.2.1. On-premises
- 10.2.2. Cloud
- 10.3. Market Analysis, Insights and Forecast - by Enterprise Size
- 10.3.1. Small and Medium Enterprises
- 10.3.2. Large Enterprises
- 10.4. Market Analysis, Insights and Forecast - by Vertical
- 10.4.1. Banking, Financial Services, and Insurance
- 10.4.2. Retail and E-commerce
- 10.4.3. Telecommunications and IT
- 10.4.4. Government and Defense
- 10.4.5. Other Industry Verticals
- 10.1. Market Analysis, Insights and Forecast - by Type
- 11. North America Voice Biometric Authentication Industry Analysis, Insights and Forecast, 2019-2031
- 11.1. Market Analysis, Insights and Forecast - By Country/Sub-region
- 11.1.1 United States
- 11.1.2 Canada
- 12. Europe Voice Biometric Authentication Industry Analysis, Insights and Forecast, 2019-2031
- 12.1. Market Analysis, Insights and Forecast - By Country/Sub-region
- 12.1.1 United Kingdom
- 12.1.2 Germany
- 12.1.3 France
- 12.1.4 Rest of Europe
- 13. Asia Pacific Voice Biometric Authentication Industry Analysis, Insights and Forecast, 2019-2031
- 13.1. Market Analysis, Insights and Forecast - By Country/Sub-region
- 13.1.1 China
- 13.1.2 Australia
- 13.1.3 India
- 13.1.4 Rest of Asia Pacific
- 14. Latin America Voice Biometric Authentication Industry Analysis, Insights and Forecast, 2019-2031
- 14.1. Market Analysis, Insights and Forecast - By Country/Sub-region
- 14.1.1 Brazil
- 14.1.2 Mexico
- 14.1.3 Rest of Latin America
- 15. Middle East and Africa Voice Biometric Authentication Industry Analysis, Insights and Forecast, 2019-2031
- 15.1. Market Analysis, Insights and Forecast - By Country/Sub-region
- 15.1.1.
- 16. Competitive Analysis
- 16.1. Global Market Share Analysis 2024
- 16.2. Company Profiles
- 16.2.1 Nuance Communications Inc
- 16.2.1.1. Overview
- 16.2.1.2. Products
- 16.2.1.3. SWOT Analysis
- 16.2.1.4. Recent Developments
- 16.2.1.5. Financials (Based on Availability)
- 16.2.2 SESTEK*List Not Exhaustive
- 16.2.2.1. Overview
- 16.2.2.2. Products
- 16.2.2.3. SWOT Analysis
- 16.2.2.4. Recent Developments
- 16.2.2.5. Financials (Based on Availability)
- 16.2.3 One Vault SA
- 16.2.3.1. Overview
- 16.2.3.2. Products
- 16.2.3.3. SWOT Analysis
- 16.2.3.4. Recent Developments
- 16.2.3.5. Financials (Based on Availability)
- 16.2.4 Voice Biometrics Group
- 16.2.4.1. Overview
- 16.2.4.2. Products
- 16.2.4.3. SWOT Analysis
- 16.2.4.4. Recent Developments
- 16.2.4.5. Financials (Based on Availability)
- 16.2.5 Auraya Inc
- 16.2.5.1. Overview
- 16.2.5.2. Products
- 16.2.5.3. SWOT Analysis
- 16.2.5.4. Recent Developments
- 16.2.5.5. Financials (Based on Availability)
- 16.2.6 Uniphore Software Systems Pvt Ltd
- 16.2.6.1. Overview
- 16.2.6.2. Products
- 16.2.6.3. SWOT Analysis
- 16.2.6.4. Recent Developments
- 16.2.6.5. Financials (Based on Availability)
- 16.2.7 Pindrop Security Inc
- 16.2.7.1. Overview
- 16.2.7.2. Products
- 16.2.7.3. SWOT Analysis
- 16.2.7.4. Recent Developments
- 16.2.7.5. Financials (Based on Availability)
- 16.2.8 NICE Ltd
- 16.2.8.1. Overview
- 16.2.8.2. Products
- 16.2.8.3. SWOT Analysis
- 16.2.8.4. Recent Developments
- 16.2.8.5. Financials (Based on Availability)
- 16.2.9 Verint Systems Inc
- 16.2.9.1. Overview
- 16.2.9.2. Products
- 16.2.9.3. SWOT Analysis
- 16.2.9.4. Recent Developments
- 16.2.9.5. Financials (Based on Availability)
- 16.2.10 LexisNexis Risk Solutions Inc
- 16.2.10.1. Overview
- 16.2.10.2. Products
- 16.2.10.3. SWOT Analysis
- 16.2.10.4. Recent Developments
- 16.2.10.5. Financials (Based on Availability)
- 16.2.11 Lumen Vox LLC (Voice Trust GmBH)
- 16.2.11.1. Overview
- 16.2.11.2. Products
- 16.2.11.3. SWOT Analysis
- 16.2.11.4. Recent Developments
- 16.2.11.5. Financials (Based on Availability)
- 16.2.12 Phonexia SRO
- 16.2.12.1. Overview
- 16.2.12.2. Products
- 16.2.12.3. SWOT Analysis
- 16.2.12.4. Recent Developments
- 16.2.12.5. Financials (Based on Availability)
- 16.2.13 Aculab Inc
- 16.2.13.1. Overview
- 16.2.13.2. Products
- 16.2.13.3. SWOT Analysis
- 16.2.13.4. Recent Developments
- 16.2.13.5. Financials (Based on Availability)
- 16.2.14 VoicePIN com Sp z o o
- 16.2.14.1. Overview
- 16.2.14.2. Products
- 16.2.14.3. SWOT Analysis
- 16.2.14.4. Recent Developments
- 16.2.14.5. Financials (Based on Availability)
- 16.2.15 BioCatch Ltd
- 16.2.15.1. Overview
- 16.2.15.2. Products
- 16.2.15.3. SWOT Analysis
- 16.2.15.4. Recent Developments
- 16.2.15.5. Financials (Based on Availability)
- 16.2.1 Nuance Communications Inc
List of Figures
- Figure 1: Global Voice Biometric Authentication Industry Revenue Breakdown (Million, %) by Region 2024 & 2032
- Figure 2: North America Voice Biometric Authentication Industry Revenue (Million), by Country 2024 & 2032
- Figure 3: North America Voice Biometric Authentication Industry Revenue Share (%), by Country 2024 & 2032
- Figure 4: Europe Voice Biometric Authentication Industry Revenue (Million), by Country 2024 & 2032
- Figure 5: Europe Voice Biometric Authentication Industry Revenue Share (%), by Country 2024 & 2032
- Figure 6: Asia Pacific Voice Biometric Authentication Industry Revenue (Million), by Country 2024 & 2032
- Figure 7: Asia Pacific Voice Biometric Authentication Industry Revenue Share (%), by Country 2024 & 2032
- Figure 8: Latin America Voice Biometric Authentication Industry Revenue (Million), by Country 2024 & 2032
- Figure 9: Latin America Voice Biometric Authentication Industry Revenue Share (%), by Country 2024 & 2032
- Figure 10: Middle East and Africa Voice Biometric Authentication Industry Revenue (Million), by Country 2024 & 2032
- Figure 11: Middle East and Africa Voice Biometric Authentication Industry Revenue Share (%), by Country 2024 & 2032
- Figure 12: North America Voice Biometric Authentication Industry Revenue (Million), by Type 2024 & 2032
- Figure 13: North America Voice Biometric Authentication Industry Revenue Share (%), by Type 2024 & 2032
- Figure 14: North America Voice Biometric Authentication Industry Revenue (Million), by Deployment Model 2024 & 2032
- Figure 15: North America Voice Biometric Authentication Industry Revenue Share (%), by Deployment Model 2024 & 2032
- Figure 16: North America Voice Biometric Authentication Industry Revenue (Million), by Enterprise Size 2024 & 2032
- Figure 17: North America Voice Biometric Authentication Industry Revenue Share (%), by Enterprise Size 2024 & 2032
- Figure 18: North America Voice Biometric Authentication Industry Revenue (Million), by Vertical 2024 & 2032
- Figure 19: North America Voice Biometric Authentication Industry Revenue Share (%), by Vertical 2024 & 2032
- Figure 20: North America Voice Biometric Authentication Industry Revenue (Million), by Country 2024 & 2032
- Figure 21: North America Voice Biometric Authentication Industry Revenue Share (%), by Country 2024 & 2032
- Figure 22: Europe Voice Biometric Authentication Industry Revenue (Million), by Type 2024 & 2032
- Figure 23: Europe Voice Biometric Authentication Industry Revenue Share (%), by Type 2024 & 2032
- Figure 24: Europe Voice Biometric Authentication Industry Revenue (Million), by Deployment Model 2024 & 2032
- Figure 25: Europe Voice Biometric Authentication Industry Revenue Share (%), by Deployment Model 2024 & 2032
- Figure 26: Europe Voice Biometric Authentication Industry Revenue (Million), by Enterprise Size 2024 & 2032
- Figure 27: Europe Voice Biometric Authentication Industry Revenue Share (%), by Enterprise Size 2024 & 2032
- Figure 28: Europe Voice Biometric Authentication Industry Revenue (Million), by Vertical 2024 & 2032
- Figure 29: Europe Voice Biometric Authentication Industry Revenue Share (%), by Vertical 2024 & 2032
- Figure 30: Europe Voice Biometric Authentication Industry Revenue (Million), by Country 2024 & 2032
- Figure 31: Europe Voice Biometric Authentication Industry Revenue Share (%), by Country 2024 & 2032
- Figure 32: Asia Pacific Voice Biometric Authentication Industry Revenue (Million), by Type 2024 & 2032
- Figure 33: Asia Pacific Voice Biometric Authentication Industry Revenue Share (%), by Type 2024 & 2032
- Figure 34: Asia Pacific Voice Biometric Authentication Industry Revenue (Million), by Deployment Model 2024 & 2032
- Figure 35: Asia Pacific Voice Biometric Authentication Industry Revenue Share (%), by Deployment Model 2024 & 2032
- Figure 36: Asia Pacific Voice Biometric Authentication Industry Revenue (Million), by Enterprise Size 2024 & 2032
- Figure 37: Asia Pacific Voice Biometric Authentication Industry Revenue Share (%), by Enterprise Size 2024 & 2032
- Figure 38: Asia Pacific Voice Biometric Authentication Industry Revenue (Million), by Vertical 2024 & 2032
- Figure 39: Asia Pacific Voice Biometric Authentication Industry Revenue Share (%), by Vertical 2024 & 2032
- Figure 40: Asia Pacific Voice Biometric Authentication Industry Revenue (Million), by Country 2024 & 2032
- Figure 41: Asia Pacific Voice Biometric Authentication Industry Revenue Share (%), by Country 2024 & 2032
- Figure 42: Latin America Voice Biometric Authentication Industry Revenue (Million), by Type 2024 & 2032
- Figure 43: Latin America Voice Biometric Authentication Industry Revenue Share (%), by Type 2024 & 2032
- Figure 44: Latin America Voice Biometric Authentication Industry Revenue (Million), by Deployment Model 2024 & 2032
- Figure 45: Latin America Voice Biometric Authentication Industry Revenue Share (%), by Deployment Model 2024 & 2032
- Figure 46: Latin America Voice Biometric Authentication Industry Revenue (Million), by Enterprise Size 2024 & 2032
- Figure 47: Latin America Voice Biometric Authentication Industry Revenue Share (%), by Enterprise Size 2024 & 2032
- Figure 48: Latin America Voice Biometric Authentication Industry Revenue (Million), by Vertical 2024 & 2032
- Figure 49: Latin America Voice Biometric Authentication Industry Revenue Share (%), by Vertical 2024 & 2032
- Figure 50: Latin America Voice Biometric Authentication Industry Revenue (Million), by Country 2024 & 2032
- Figure 51: Latin America Voice Biometric Authentication Industry Revenue Share (%), by Country 2024 & 2032
- Figure 52: Middle East and Africa Voice Biometric Authentication Industry Revenue (Million), by Type 2024 & 2032
- Figure 53: Middle East and Africa Voice Biometric Authentication Industry Revenue Share (%), by Type 2024 & 2032
- Figure 54: Middle East and Africa Voice Biometric Authentication Industry Revenue (Million), by Deployment Model 2024 & 2032
- Figure 55: Middle East and Africa Voice Biometric Authentication Industry Revenue Share (%), by Deployment Model 2024 & 2032
- Figure 56: Middle East and Africa Voice Biometric Authentication Industry Revenue (Million), by Enterprise Size 2024 & 2032
- Figure 57: Middle East and Africa Voice Biometric Authentication Industry Revenue Share (%), by Enterprise Size 2024 & 2032
- Figure 58: Middle East and Africa Voice Biometric Authentication Industry Revenue (Million), by Vertical 2024 & 2032
- Figure 59: Middle East and Africa Voice Biometric Authentication Industry Revenue Share (%), by Vertical 2024 & 2032
- Figure 60: Middle East and Africa Voice Biometric Authentication Industry Revenue (Million), by Country 2024 & 2032
- Figure 61: Middle East and Africa Voice Biometric Authentication Industry Revenue Share (%), by Country 2024 & 2032
List of Tables
- Table 1: Global Voice Biometric Authentication Industry Revenue Million Forecast, by Region 2019 & 2032
- Table 2: Global Voice Biometric Authentication Industry Revenue Million Forecast, by Type 2019 & 2032
- Table 3: Global Voice Biometric Authentication Industry Revenue Million Forecast, by Deployment Model 2019 & 2032
- Table 4: Global Voice Biometric Authentication Industry Revenue Million Forecast, by Enterprise Size 2019 & 2032
- Table 5: Global Voice Biometric Authentication Industry Revenue Million Forecast, by Vertical 2019 & 2032
- Table 6: Global Voice Biometric Authentication Industry Revenue Million Forecast, by Region 2019 & 2032
- Table 7: Global Voice Biometric Authentication Industry Revenue Million Forecast, by Country 2019 & 2032
- Table 8: United States Voice Biometric Authentication Industry Revenue (Million) Forecast, by Application 2019 & 2032
- Table 9: Canada Voice Biometric Authentication Industry Revenue (Million) Forecast, by Application 2019 & 2032
- Table 10: Global Voice Biometric Authentication Industry Revenue Million Forecast, by Country 2019 & 2032
- Table 11: United Kingdom Voice Biometric Authentication Industry Revenue (Million) Forecast, by Application 2019 & 2032
- Table 12: Germany Voice Biometric Authentication Industry Revenue (Million) Forecast, by Application 2019 & 2032
- Table 13: France Voice Biometric Authentication Industry Revenue (Million) Forecast, by Application 2019 & 2032
- Table 14: Rest of Europe Voice Biometric Authentication Industry Revenue (Million) Forecast, by Application 2019 & 2032
- Table 15: Global Voice Biometric Authentication Industry Revenue Million Forecast, by Country 2019 & 2032
- Table 16: China Voice Biometric Authentication Industry Revenue (Million) Forecast, by Application 2019 & 2032
- Table 17: Australia Voice Biometric Authentication Industry Revenue (Million) Forecast, by Application 2019 & 2032
- Table 18: India Voice Biometric Authentication Industry Revenue (Million) Forecast, by Application 2019 & 2032
- Table 19: Rest of Asia Pacific Voice Biometric Authentication Industry Revenue (Million) Forecast, by Application 2019 & 2032
- Table 20: Global Voice Biometric Authentication Industry Revenue Million Forecast, by Country 2019 & 2032
- Table 21: Brazil Voice Biometric Authentication Industry Revenue (Million) Forecast, by Application 2019 & 2032
- Table 22: Mexico Voice Biometric Authentication Industry Revenue (Million) Forecast, by Application 2019 & 2032
- Table 23: Rest of Latin America Voice Biometric Authentication Industry Revenue (Million) Forecast, by Application 2019 & 2032
- Table 24: Global Voice Biometric Authentication Industry Revenue Million Forecast, by Country 2019 & 2032
- Table 25: Voice Biometric Authentication Industry Revenue (Million) Forecast, by Application 2019 & 2032
- Table 26: Global Voice Biometric Authentication Industry Revenue Million Forecast, by Type 2019 & 2032
- Table 27: Global Voice Biometric Authentication Industry Revenue Million Forecast, by Deployment Model 2019 & 2032
- Table 28: Global Voice Biometric Authentication Industry Revenue Million Forecast, by Enterprise Size 2019 & 2032
- Table 29: Global Voice Biometric Authentication Industry Revenue Million Forecast, by Vertical 2019 & 2032
- Table 30: Global Voice Biometric Authentication Industry Revenue Million Forecast, by Country 2019 & 2032
- Table 31: United States Voice Biometric Authentication Industry Revenue (Million) Forecast, by Application 2019 & 2032
- Table 32: Canada Voice Biometric Authentication Industry Revenue (Million) Forecast, by Application 2019 & 2032
- Table 33: Global Voice Biometric Authentication Industry Revenue Million Forecast, by Type 2019 & 2032
- Table 34: Global Voice Biometric Authentication Industry Revenue Million Forecast, by Deployment Model 2019 & 2032
- Table 35: Global Voice Biometric Authentication Industry Revenue Million Forecast, by Enterprise Size 2019 & 2032
- Table 36: Global Voice Biometric Authentication Industry Revenue Million Forecast, by Vertical 2019 & 2032
- Table 37: Global Voice Biometric Authentication Industry Revenue Million Forecast, by Country 2019 & 2032
- Table 38: United Kingdom Voice Biometric Authentication Industry Revenue (Million) Forecast, by Application 2019 & 2032
- Table 39: Germany Voice Biometric Authentication Industry Revenue (Million) Forecast, by Application 2019 & 2032
- Table 40: France Voice Biometric Authentication Industry Revenue (Million) Forecast, by Application 2019 & 2032
- Table 41: Rest of Europe Voice Biometric Authentication Industry Revenue (Million) Forecast, by Application 2019 & 2032
- Table 42: Global Voice Biometric Authentication Industry Revenue Million Forecast, by Type 2019 & 2032
- Table 43: Global Voice Biometric Authentication Industry Revenue Million Forecast, by Deployment Model 2019 & 2032
- Table 44: Global Voice Biometric Authentication Industry Revenue Million Forecast, by Enterprise Size 2019 & 2032
- Table 45: Global Voice Biometric Authentication Industry Revenue Million Forecast, by Vertical 2019 & 2032
- Table 46: Global Voice Biometric Authentication Industry Revenue Million Forecast, by Country 2019 & 2032
- Table 47: China Voice Biometric Authentication Industry Revenue (Million) Forecast, by Application 2019 & 2032
- Table 48: Australia Voice Biometric Authentication Industry Revenue (Million) Forecast, by Application 2019 & 2032
- Table 49: India Voice Biometric Authentication Industry Revenue (Million) Forecast, by Application 2019 & 2032
- Table 50: Rest of Asia Pacific Voice Biometric Authentication Industry Revenue (Million) Forecast, by Application 2019 & 2032
- Table 51: Global Voice Biometric Authentication Industry Revenue Million Forecast, by Type 2019 & 2032
- Table 52: Global Voice Biometric Authentication Industry Revenue Million Forecast, by Deployment Model 2019 & 2032
- Table 53: Global Voice Biometric Authentication Industry Revenue Million Forecast, by Enterprise Size 2019 & 2032
- Table 54: Global Voice Biometric Authentication Industry Revenue Million Forecast, by Vertical 2019 & 2032
- Table 55: Global Voice Biometric Authentication Industry Revenue Million Forecast, by Country 2019 & 2032
- Table 56: Brazil Voice Biometric Authentication Industry Revenue (Million) Forecast, by Application 2019 & 2032
- Table 57: Mexico Voice Biometric Authentication Industry Revenue (Million) Forecast, by Application 2019 & 2032
- Table 58: Rest of Latin America Voice Biometric Authentication Industry Revenue (Million) Forecast, by Application 2019 & 2032
- Table 59: Global Voice Biometric Authentication Industry Revenue Million Forecast, by Type 2019 & 2032
- Table 60: Global Voice Biometric Authentication Industry Revenue Million Forecast, by Deployment Model 2019 & 2032
- Table 61: Global Voice Biometric Authentication Industry Revenue Million Forecast, by Enterprise Size 2019 & 2032
- Table 62: Global Voice Biometric Authentication Industry Revenue Million Forecast, by Vertical 2019 & 2032
- Table 63: Global Voice Biometric Authentication Industry Revenue Million Forecast, by Country 2019 & 2032
Frequently Asked Questions
1. What is the projected Compound Annual Growth Rate (CAGR) of the Voice Biometric Authentication Industry?
The projected CAGR is approximately 16.75%.
2. Which companies are prominent players in the Voice Biometric Authentication Industry?
Key companies in the market include Nuance Communications Inc, SESTEK*List Not Exhaustive, One Vault SA, Voice Biometrics Group, Auraya Inc, Uniphore Software Systems Pvt Ltd, Pindrop Security Inc, NICE Ltd, Verint Systems Inc, LexisNexis Risk Solutions Inc, Lumen Vox LLC (Voice Trust GmBH), Phonexia SRO, Aculab Inc, VoicePIN com Sp z o o, BioCatch Ltd.
3. What are the main segments of the Voice Biometric Authentication Industry?
The market segments include Type, Deployment Model, Enterprise Size, Vertical.
4. Can you provide details about the market size?
The market size is estimated to be USD 2.25 Million as of 2022.
5. What are some drivers contributing to market growth?
Increased Sophistication of Security Threat; Large-scale Adoption of Technology by Governments to Secure Citizens.
6. What are the notable trends driving market growth?
Banking. Financial Services. and Insurance have Emerged as the Leading Fields for Voice Biometric Applications.
7. Are there any restraints impacting market growth?
High Initial Cost Involved.
8. Can you provide examples of recent developments in the market?
March 2022 - the US-based voice automation start-up Uniphore raised USD 400 million in its latest funding round. The latest funding round was led by the US-based venture capital fund NEA.
9. What pricing options are available for accessing the report?
Pricing options include single-user, multi-user, and enterprise licenses priced at USD 4750, USD 5250, and USD 8750 respectively.
10. Is the market size provided in terms of value or volume?
The market size is provided in terms of value, measured in Million.
11. Are there any specific market keywords associated with the report?
Yes, the market keyword associated with the report is "Voice Biometric Authentication Industry," which aids in identifying and referencing the specific market segment covered.
12. How do I determine which pricing option suits my needs best?
The pricing options vary based on user requirements and access needs. Individual users may opt for single-user licenses, while businesses requiring broader access may choose multi-user or enterprise licenses for cost-effective access to the report.
13. Are there any additional resources or data provided in the Voice Biometric Authentication Industry report?
While the report offers comprehensive insights, it's advisable to review the specific contents or supplementary materials provided to ascertain if additional resources or data are available.
14. How can I stay updated on further developments or reports in the Voice Biometric Authentication Industry?
To stay informed about further developments, trends, and reports in the Voice Biometric Authentication Industry, consider subscribing to industry newsletters, following relevant companies and organizations, or regularly checking reputable industry news sources and publications.
Methodology
Step 1 - Identification of Relevant Samples Size from Population Database


Step 2 - Approaches for Defining Global Market Size (Value, Volume* & Price*)

Note*: In applicable scenarios
Step 3 - Data Sources
Primary Research
- Web Analytics
- Survey Reports
- Research Institute
- Latest Research Reports
- Opinion Leaders
Secondary Research
- Annual Reports
- White Paper
- Latest Press Release
- Industry Association
- Paid Database
- Investor Presentations

Step 4 - Data Triangulation
Involves using different sources of information in order to increase the validity of a study
These sources are likely to be stakeholders in a program - participants, other researchers, program staff, other community members, and so on.
Then we put all data in single framework & apply various statistical tools to find out the dynamic on the market.
During the analysis stage, feedback from the stakeholder groups would be compared to determine areas of agreement as well as areas of divergence


