
Key Insights
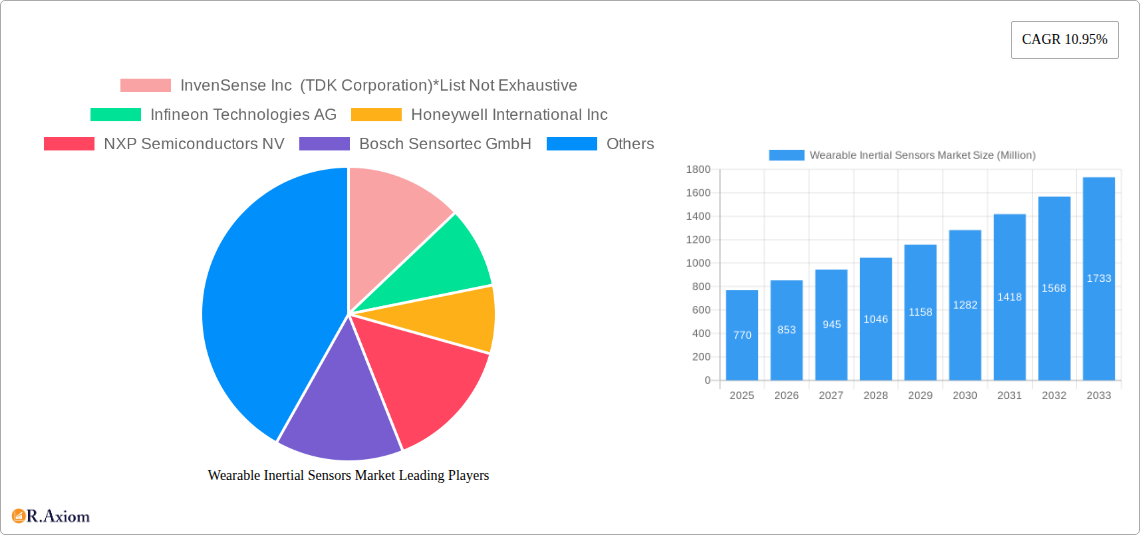
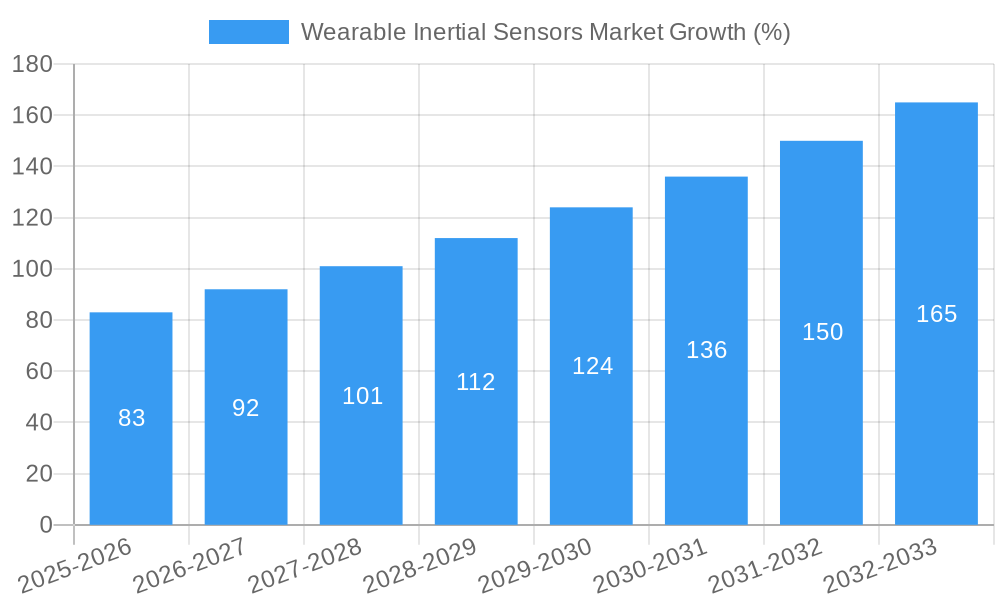
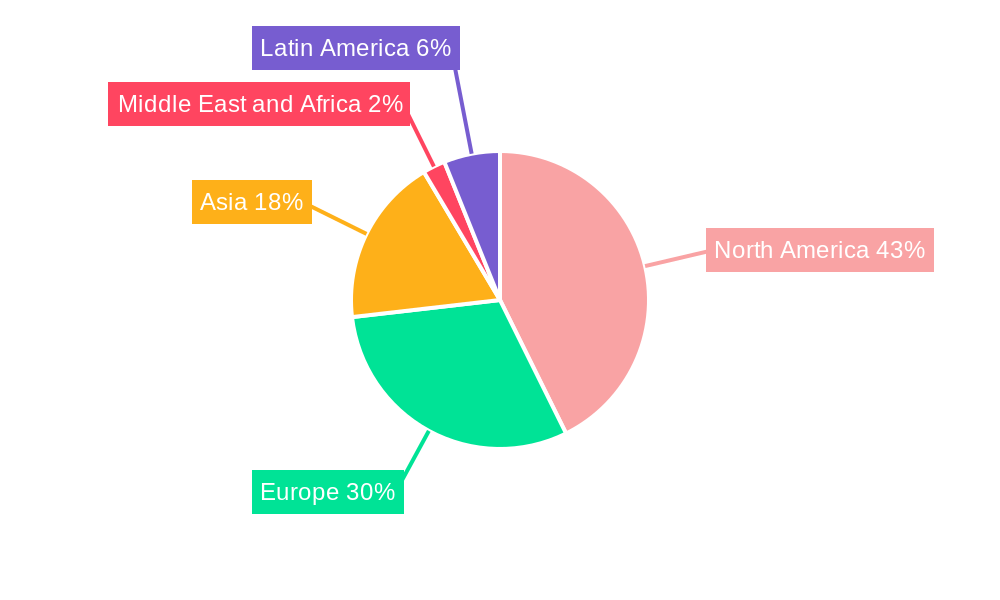
The Wearable Inertial Sensors market, valued at $0.77 billion in 2025, is projected to experience robust growth, driven by the increasing adoption of wearable technology across various sectors. A compound annual growth rate (CAGR) of 10.95% from 2025 to 2033 indicates significant market expansion. Key drivers include the rising demand for health and fitness tracking devices like smartwatches and fitness bands, the integration of inertial sensors into sophisticated sports gear for performance analysis, and the growing adoption of wearable technology in healthcare for patient monitoring and rehabilitation. The market is segmented by product type (smartwatches, fitness bands, smart clothing, sports gear, others) and end-user (healthcare, sports & fitness, consumer electronics, entertainment & media, government & public utilities). Technological advancements, miniaturization of sensors, and declining sensor costs further fuel market growth. However, factors like data privacy concerns and the potential for inaccurate sensor readings could act as restraints. The North American market currently holds a significant share, driven by high technological adoption and consumer spending. However, Asia-Pacific is expected to witness substantial growth due to increasing smartphone penetration and rising disposable incomes in emerging economies like India and China. Competition among key players like InvenSense (TDK Corporation), Infineon Technologies, Honeywell, and Bosch Sensortec, among others, drives innovation and market expansion.
The projected market size in 2033, considering the CAGR of 10.95%, can be estimated by extrapolating the 2025 value. This growth is expected to be influenced by several factors, including the continuous development of more accurate and energy-efficient sensors, advancements in machine learning algorithms for data analysis, and increasing integration of wearable sensors into Internet of Things (IoT) ecosystems. While the current market is dominated by established players, the entry of new players with innovative technologies and business models is anticipated, leading to increased competition and potential disruptions. Growth will also be influenced by government regulations concerning data privacy and the ongoing development of international standards for wearable sensor technologies.
Wearable Inertial Sensors Market: A Comprehensive Report (2019-2033)
This in-depth report provides a comprehensive analysis of the Wearable Inertial Sensors market, offering valuable insights for stakeholders across the value chain. The study period covers 2019-2033, with 2025 as the base and estimated year, and a forecast period of 2025-2033. The historical period analyzed is 2019-2024. The report leverages extensive primary and secondary research to deliver actionable intelligence on market size, segmentation, growth drivers, challenges, and opportunities. Key players such as InvenSense Inc (TDK Corporation), Infineon Technologies AG, Honeywell International Inc, and others are profiled, providing a competitive landscape analysis. The report also highlights significant industry developments shaping the market trajectory.
Wearable Inertial Sensors Market Concentration & Innovation
The Wearable Inertial Sensors market exhibits a moderately concentrated landscape, with a few major players holding significant market share. However, the presence of several smaller, specialized companies fosters innovation and competition. Market concentration is influenced by factors like technological advancements, economies of scale, and intellectual property rights. The market share of the top five players is estimated at xx%, indicating a relatively competitive environment. Mergers and acquisitions (M&A) play a significant role in shaping market dynamics. Recent M&A activity shows a focus on expanding product portfolios, geographic reach, and technological capabilities. The total value of M&A deals in the past five years is estimated at $xx Million. Regulatory frameworks governing data privacy and safety standards are crucial factors influencing innovation and market growth. The existence of product substitutes, such as other sensing technologies, poses a challenge to market expansion. End-user preferences and technological advancements shape market trends, with demand for miniaturization, improved accuracy, and lower power consumption driving innovation.
Wearable Inertial Sensors Market Industry Trends & Insights
The Wearable Inertial Sensors market is experiencing robust growth, driven by factors such as increasing demand for fitness trackers, smartwatches, and other wearable devices. The market is witnessing a surge in technological advancements, including the development of more accurate, energy-efficient, and miniaturized sensors. The rising adoption of IoT (Internet of Things) and the integration of AI (Artificial Intelligence) in wearable devices are significant catalysts for growth. Consumer preferences for personalized health and fitness tracking are driving the demand for advanced sensors, thereby influencing the market trajectory. The global wearable inertial sensors market is expected to grow at a CAGR of xx% during the forecast period (2025-2033), reaching a market size of $xx Million by 2033. Market penetration is increasing across various demographics and geographies, reflecting rising awareness of health and wellness. The competitive dynamics involve significant investments in R&D, strategic partnerships, and product differentiation strategies.
Dominant Markets & Segments in Wearable Inertial Sensors Market
The Smart Watches segment dominates the Wearable Inertial Sensors market by product type, driven by increasing consumer preference for smart features and functionalities. The Healthcare segment holds a significant share in the end-user landscape due to the growing adoption of wearable technology for health monitoring and disease management.
Key Drivers for Smart Watches:
- Rising disposable incomes and increasing consumer electronics adoption.
- Advancements in sensor technology, offering improved accuracy and functionality.
- Integration of health and fitness tracking features.
Key Drivers for Healthcare Segment:
- Growing prevalence of chronic diseases and the need for remote patient monitoring.
- Increasing demand for personalized healthcare solutions.
- Government initiatives promoting telehealth and remote diagnostics.
North America is expected to be the leading region in the market due to the high adoption of wearable devices and advanced healthcare infrastructure. This region’s dominance is primarily attributed to factors like strong consumer electronics adoption, high technological advancement, and a well-developed healthcare sector. However, other regions like Asia-Pacific are expected to demonstrate robust growth due to their large and growing populations and increased consumer spending.
Wearable Inertial Sensors Market Product Developments
Recent advancements focus on miniaturization, improved power efficiency, and enhanced accuracy of inertial sensors. New applications are emerging in areas such as augmented reality (AR), virtual reality (VR), and human-machine interfaces. Sensors with integrated processing capabilities are gaining popularity, simplifying system design and reducing power consumption. The emphasis is on integrating advanced functionalities, like AI-driven motion recognition, to improve user experience and create more sophisticated applications. This technological evolution allows manufacturers to develop innovative and competitive wearable products catering to diverse market demands.
Report Scope & Segmentation Analysis
This report segments the Wearable Inertial Sensors market by product type (Smart Watches, Fitness Bands/Activity Tracker, Smart Clothing, Sports Gear, Others) and end-user type (Healthcare, Sports and Fitness, Consumer electronics, Entertainment and Media, Government and Public Utilities, Others). Each segment is analyzed in detail, including growth projections, market size, and competitive landscape. For example, the Smart Watches segment is expected to witness a significant CAGR of xx% during the forecast period, driven by the increasing demand for feature-rich smartwatches. Similarly, the Healthcare segment demonstrates substantial growth potential due to the rising adoption of wearable technology in healthcare applications.
Key Drivers of Wearable Inertial Sensors Market Growth
Technological advancements, particularly in sensor miniaturization and power efficiency, are key drivers. The growing demand for fitness trackers and smartwatches fuels market expansion. Government initiatives promoting telehealth and remote patient monitoring create additional opportunities. The increasing affordability of wearable devices is also expanding market penetration. Rising consumer awareness of health and fitness, coupled with the convenience offered by wearable devices, further fuels growth.
Challenges in the Wearable Inertial Sensors Market Sector
Data privacy and security concerns pose significant challenges, particularly regarding the collection and storage of sensitive health data. Maintaining the accuracy and reliability of sensor data across various environmental conditions presents another challenge. The competitive landscape, characterized by intense rivalry among established players and emerging companies, creates pressure on pricing and margins. Supply chain disruptions can impact the availability of components and affect production timelines.
Emerging Opportunities in Wearable Inertial Sensors Market
The integration of AI and machine learning in wearable devices creates opportunities for advanced health monitoring and personalized insights. The growing demand for AR/VR applications opens up new markets for sophisticated motion tracking sensors. Expansion into emerging markets with growing populations and rising consumer spending offers significant growth potential. Development of sensors for niche applications, such as industrial safety and asset tracking, creates additional opportunities for specialized manufacturers.
Leading Players in the Wearable Inertial Sensors Market Market
- InvenSense Inc (TDK Corporation) TDK Corporation
- Infineon Technologies AG Infineon Technologies AG
- Honeywell International Inc Honeywell International Inc
- NXP Semiconductors NV NXP Semiconductors NV
- Bosch Sensortec GmbH Bosch Sensortec GmbH
- Knowles Electronics Knowles Electronics
- General Electric Co General Electric Co
- STMicroelectronics NV STMicroelectronics NV
- TE Connectivity Ltd TE Connectivity Ltd
- Texas Instruments Incorporated Texas Instruments Incorporated
- Analog Devices Inc Analog Devices Inc
- Panasonic Corporation Panasonic Corporation
- AMS osram AG AMS osram AG
Key Developments in Wearable Inertial Sensors Market Industry
- December 2022: Panasonic Industries launched the Grid-Eye 90° sensor, expanding its sensor family with a broader field of vision and improved tracking capabilities. This development enhances the performance of systems tracking movement and counting individuals, appealing to privacy-conscious designers.
- January 2023: Wearable Devices Ltd. partnered with a Fortune 500 communications equipment firm to integrate its Mudra Neural Input technology, a touchless input platform, into the partner's chipsets. This partnership significantly expands the reach of Mudra technology to a wider market of wearable manufacturers.
Strategic Outlook for Wearable Inertial Sensors Market Market
The Wearable Inertial Sensors market is poised for continued growth, driven by technological innovations, rising consumer demand, and expanding applications across various sectors. The integration of AI and advanced analytics promises to enhance the capabilities of wearable devices and unlock new opportunities for personalized health management and other applications. Further miniaturization and improved power efficiency will enable the development of even smaller and more versatile wearable sensors, expanding their potential applications significantly. The market's future potential is substantial, especially with the emergence of new technologies and the expansion into untapped markets.
Wearable Inertial Sensors Market Segmentation
-
1. Product Type
- 1.1. Smart Watches
- 1.2. Fitness Bands/Activity Tracker
- 1.3. Smart Clothing
- 1.4. Sports Gear
- 1.5. Others
-
2. End-user Type
- 2.1. Healthcare
- 2.2. Sports and Fitness
- 2.3. Consumer electronics
- 2.4. Entertainment and Media
- 2.5. Government and Public Utilities
- 2.6. Others
Wearable Inertial Sensors Market Segmentation By Geography
-
1. North America
- 1.1. United States
- 1.2. Canada
-
2. Europe
- 2.1. Germany
- 2.2. United Kingdom
- 2.3. France
-
3. Asia
- 3.1. China
- 3.2. India
- 3.3. Japan
- 3.4. South Korea
- 3.5. Australia and New Zealand
-
4. Middle East and Africa
- 4.1. United Arab Emirates
- 4.2. Saudi Arabia
- 4.3. Israel
-
5. Latin America
- 5.1. Brazil
- 5.2. Argentina
- 5.3. Mexico
Wearable Inertial Sensors Market REPORT HIGHLIGHTS
| Aspects | Details |
|---|---|
| Study Period | 2019-2033 |
| Base Year | 2024 |
| Estimated Year | 2025 |
| Forecast Period | 2025-2033 |
| Historical Period | 2019-2024 |
| Growth Rate | CAGR of 10.95% from 2019-2033 |
| Segmentation |
|
Table of Contents
- 1. Introduction
- 1.1. Research Scope
- 1.2. Market Segmentation
- 1.3. Research Methodology
- 1.4. Definitions and Assumptions
- 2. Executive Summary
- 2.1. Introduction
- 3. Market Dynamics
- 3.1. Introduction
- 3.2. Market Drivers
- 3.2.1. Increasing health awareness; Growing Demand for Wearable Fitness Monitors; Rapid Technology Advancements
- 3.3. Market Restrains
- 3.3.1. Security concerns; High cost of the devices
- 3.4. Market Trends
- 3.4.1. Consumer Electronics to Witness Significant Growth
- 4. Market Factor Analysis
- 4.1. Porters Five Forces
- 4.2. Supply/Value Chain
- 4.3. PESTEL analysis
- 4.4. Market Entropy
- 4.5. Patent/Trademark Analysis
- 5. Global Wearable Inertial Sensors Market Analysis, Insights and Forecast, 2019-2031
- 5.1. Market Analysis, Insights and Forecast - by Product Type
- 5.1.1. Smart Watches
- 5.1.2. Fitness Bands/Activity Tracker
- 5.1.3. Smart Clothing
- 5.1.4. Sports Gear
- 5.1.5. Others
- 5.2. Market Analysis, Insights and Forecast - by End-user Type
- 5.2.1. Healthcare
- 5.2.2. Sports and Fitness
- 5.2.3. Consumer electronics
- 5.2.4. Entertainment and Media
- 5.2.5. Government and Public Utilities
- 5.2.6. Others
- 5.3. Market Analysis, Insights and Forecast - by Region
- 5.3.1. North America
- 5.3.2. Europe
- 5.3.3. Asia
- 5.3.4. Middle East and Africa
- 5.3.5. Latin America
- 5.1. Market Analysis, Insights and Forecast - by Product Type
- 6. North America Wearable Inertial Sensors Market Analysis, Insights and Forecast, 2019-2031
- 6.1. Market Analysis, Insights and Forecast - by Product Type
- 6.1.1. Smart Watches
- 6.1.2. Fitness Bands/Activity Tracker
- 6.1.3. Smart Clothing
- 6.1.4. Sports Gear
- 6.1.5. Others
- 6.2. Market Analysis, Insights and Forecast - by End-user Type
- 6.2.1. Healthcare
- 6.2.2. Sports and Fitness
- 6.2.3. Consumer electronics
- 6.2.4. Entertainment and Media
- 6.2.5. Government and Public Utilities
- 6.2.6. Others
- 6.1. Market Analysis, Insights and Forecast - by Product Type
- 7. Europe Wearable Inertial Sensors Market Analysis, Insights and Forecast, 2019-2031
- 7.1. Market Analysis, Insights and Forecast - by Product Type
- 7.1.1. Smart Watches
- 7.1.2. Fitness Bands/Activity Tracker
- 7.1.3. Smart Clothing
- 7.1.4. Sports Gear
- 7.1.5. Others
- 7.2. Market Analysis, Insights and Forecast - by End-user Type
- 7.2.1. Healthcare
- 7.2.2. Sports and Fitness
- 7.2.3. Consumer electronics
- 7.2.4. Entertainment and Media
- 7.2.5. Government and Public Utilities
- 7.2.6. Others
- 7.1. Market Analysis, Insights and Forecast - by Product Type
- 8. Asia Wearable Inertial Sensors Market Analysis, Insights and Forecast, 2019-2031
- 8.1. Market Analysis, Insights and Forecast - by Product Type
- 8.1.1. Smart Watches
- 8.1.2. Fitness Bands/Activity Tracker
- 8.1.3. Smart Clothing
- 8.1.4. Sports Gear
- 8.1.5. Others
- 8.2. Market Analysis, Insights and Forecast - by End-user Type
- 8.2.1. Healthcare
- 8.2.2. Sports and Fitness
- 8.2.3. Consumer electronics
- 8.2.4. Entertainment and Media
- 8.2.5. Government and Public Utilities
- 8.2.6. Others
- 8.1. Market Analysis, Insights and Forecast - by Product Type
- 9. Middle East and Africa Wearable Inertial Sensors Market Analysis, Insights and Forecast, 2019-2031
- 9.1. Market Analysis, Insights and Forecast - by Product Type
- 9.1.1. Smart Watches
- 9.1.2. Fitness Bands/Activity Tracker
- 9.1.3. Smart Clothing
- 9.1.4. Sports Gear
- 9.1.5. Others
- 9.2. Market Analysis, Insights and Forecast - by End-user Type
- 9.2.1. Healthcare
- 9.2.2. Sports and Fitness
- 9.2.3. Consumer electronics
- 9.2.4. Entertainment and Media
- 9.2.5. Government and Public Utilities
- 9.2.6. Others
- 9.1. Market Analysis, Insights and Forecast - by Product Type
- 10. Latin America Wearable Inertial Sensors Market Analysis, Insights and Forecast, 2019-2031
- 10.1. Market Analysis, Insights and Forecast - by Product Type
- 10.1.1. Smart Watches
- 10.1.2. Fitness Bands/Activity Tracker
- 10.1.3. Smart Clothing
- 10.1.4. Sports Gear
- 10.1.5. Others
- 10.2. Market Analysis, Insights and Forecast - by End-user Type
- 10.2.1. Healthcare
- 10.2.2. Sports and Fitness
- 10.2.3. Consumer electronics
- 10.2.4. Entertainment and Media
- 10.2.5. Government and Public Utilities
- 10.2.6. Others
- 10.1. Market Analysis, Insights and Forecast - by Product Type
- 11. North America Wearable Inertial Sensors Market Analysis, Insights and Forecast, 2019-2031
- 11.1. Market Analysis, Insights and Forecast - By Country/Sub-region
- 11.1.1 United States
- 11.1.2 Canada
- 12. Europe Wearable Inertial Sensors Market Analysis, Insights and Forecast, 2019-2031
- 12.1. Market Analysis, Insights and Forecast - By Country/Sub-region
- 12.1.1 Germany
- 12.1.2 United Kingdom
- 12.1.3 France
- 13. Asia Wearable Inertial Sensors Market Analysis, Insights and Forecast, 2019-2031
- 13.1. Market Analysis, Insights and Forecast - By Country/Sub-region
- 13.1.1 China
- 13.1.2 India
- 13.1.3 Japan
- 13.1.4 South Korea
- 13.1.5 Australia and New Zealand
- 14. Middle East and Africa Wearable Inertial Sensors Market Analysis, Insights and Forecast, 2019-2031
- 14.1. Market Analysis, Insights and Forecast - By Country/Sub-region
- 14.1.1 United Arab Emirates
- 14.1.2 Saudi Arabia
- 14.1.3 Israel
- 15. Latin America Wearable Inertial Sensors Market Analysis, Insights and Forecast, 2019-2031
- 15.1. Market Analysis, Insights and Forecast - By Country/Sub-region
- 15.1.1 Brazil
- 15.1.2 Argentina
- 15.1.3 Mexico
- 16. Competitive Analysis
- 16.1. Global Market Share Analysis 2024
- 16.2. Company Profiles
- 16.2.1 InvenSense Inc (TDK Corporation)*List Not Exhaustive
- 16.2.1.1. Overview
- 16.2.1.2. Products
- 16.2.1.3. SWOT Analysis
- 16.2.1.4. Recent Developments
- 16.2.1.5. Financials (Based on Availability)
- 16.2.2 Infineon Technologies AG
- 16.2.2.1. Overview
- 16.2.2.2. Products
- 16.2.2.3. SWOT Analysis
- 16.2.2.4. Recent Developments
- 16.2.2.5. Financials (Based on Availability)
- 16.2.3 Honeywell International Inc
- 16.2.3.1. Overview
- 16.2.3.2. Products
- 16.2.3.3. SWOT Analysis
- 16.2.3.4. Recent Developments
- 16.2.3.5. Financials (Based on Availability)
- 16.2.4 NXP Semiconductors NV
- 16.2.4.1. Overview
- 16.2.4.2. Products
- 16.2.4.3. SWOT Analysis
- 16.2.4.4. Recent Developments
- 16.2.4.5. Financials (Based on Availability)
- 16.2.5 Bosch Sensortec GmbH
- 16.2.5.1. Overview
- 16.2.5.2. Products
- 16.2.5.3. SWOT Analysis
- 16.2.5.4. Recent Developments
- 16.2.5.5. Financials (Based on Availability)
- 16.2.6 Knowles Electronics
- 16.2.6.1. Overview
- 16.2.6.2. Products
- 16.2.6.3. SWOT Analysis
- 16.2.6.4. Recent Developments
- 16.2.6.5. Financials (Based on Availability)
- 16.2.7 General Electric Co
- 16.2.7.1. Overview
- 16.2.7.2. Products
- 16.2.7.3. SWOT Analysis
- 16.2.7.4. Recent Developments
- 16.2.7.5. Financials (Based on Availability)
- 16.2.8 STMicroelectronics NV
- 16.2.8.1. Overview
- 16.2.8.2. Products
- 16.2.8.3. SWOT Analysis
- 16.2.8.4. Recent Developments
- 16.2.8.5. Financials (Based on Availability)
- 16.2.9 TE Connectivity Ltd
- 16.2.9.1. Overview
- 16.2.9.2. Products
- 16.2.9.3. SWOT Analysis
- 16.2.9.4. Recent Developments
- 16.2.9.5. Financials (Based on Availability)
- 16.2.10 Texas Instruments Incorporated
- 16.2.10.1. Overview
- 16.2.10.2. Products
- 16.2.10.3. SWOT Analysis
- 16.2.10.4. Recent Developments
- 16.2.10.5. Financials (Based on Availability)
- 16.2.11 Analog Devices Inc
- 16.2.11.1. Overview
- 16.2.11.2. Products
- 16.2.11.3. SWOT Analysis
- 16.2.11.4. Recent Developments
- 16.2.11.5. Financials (Based on Availability)
- 16.2.12 Panasonic Corporation
- 16.2.12.1. Overview
- 16.2.12.2. Products
- 16.2.12.3. SWOT Analysis
- 16.2.12.4. Recent Developments
- 16.2.12.5. Financials (Based on Availability)
- 16.2.13 AMS osram AG
- 16.2.13.1. Overview
- 16.2.13.2. Products
- 16.2.13.3. SWOT Analysis
- 16.2.13.4. Recent Developments
- 16.2.13.5. Financials (Based on Availability)
- 16.2.1 InvenSense Inc (TDK Corporation)*List Not Exhaustive
List of Figures
- Figure 1: Global Wearable Inertial Sensors Market Revenue Breakdown (Million, %) by Region 2024 & 2032
- Figure 2: North America Wearable Inertial Sensors Market Revenue (Million), by Country 2024 & 2032
- Figure 3: North America Wearable Inertial Sensors Market Revenue Share (%), by Country 2024 & 2032
- Figure 4: Europe Wearable Inertial Sensors Market Revenue (Million), by Country 2024 & 2032
- Figure 5: Europe Wearable Inertial Sensors Market Revenue Share (%), by Country 2024 & 2032
- Figure 6: Asia Wearable Inertial Sensors Market Revenue (Million), by Country 2024 & 2032
- Figure 7: Asia Wearable Inertial Sensors Market Revenue Share (%), by Country 2024 & 2032
- Figure 8: Middle East and Africa Wearable Inertial Sensors Market Revenue (Million), by Country 2024 & 2032
- Figure 9: Middle East and Africa Wearable Inertial Sensors Market Revenue Share (%), by Country 2024 & 2032
- Figure 10: Latin America Wearable Inertial Sensors Market Revenue (Million), by Country 2024 & 2032
- Figure 11: Latin America Wearable Inertial Sensors Market Revenue Share (%), by Country 2024 & 2032
- Figure 12: North America Wearable Inertial Sensors Market Revenue (Million), by Product Type 2024 & 2032
- Figure 13: North America Wearable Inertial Sensors Market Revenue Share (%), by Product Type 2024 & 2032
- Figure 14: North America Wearable Inertial Sensors Market Revenue (Million), by End-user Type 2024 & 2032
- Figure 15: North America Wearable Inertial Sensors Market Revenue Share (%), by End-user Type 2024 & 2032
- Figure 16: North America Wearable Inertial Sensors Market Revenue (Million), by Country 2024 & 2032
- Figure 17: North America Wearable Inertial Sensors Market Revenue Share (%), by Country 2024 & 2032
- Figure 18: Europe Wearable Inertial Sensors Market Revenue (Million), by Product Type 2024 & 2032
- Figure 19: Europe Wearable Inertial Sensors Market Revenue Share (%), by Product Type 2024 & 2032
- Figure 20: Europe Wearable Inertial Sensors Market Revenue (Million), by End-user Type 2024 & 2032
- Figure 21: Europe Wearable Inertial Sensors Market Revenue Share (%), by End-user Type 2024 & 2032
- Figure 22: Europe Wearable Inertial Sensors Market Revenue (Million), by Country 2024 & 2032
- Figure 23: Europe Wearable Inertial Sensors Market Revenue Share (%), by Country 2024 & 2032
- Figure 24: Asia Wearable Inertial Sensors Market Revenue (Million), by Product Type 2024 & 2032
- Figure 25: Asia Wearable Inertial Sensors Market Revenue Share (%), by Product Type 2024 & 2032
- Figure 26: Asia Wearable Inertial Sensors Market Revenue (Million), by End-user Type 2024 & 2032
- Figure 27: Asia Wearable Inertial Sensors Market Revenue Share (%), by End-user Type 2024 & 2032
- Figure 28: Asia Wearable Inertial Sensors Market Revenue (Million), by Country 2024 & 2032
- Figure 29: Asia Wearable Inertial Sensors Market Revenue Share (%), by Country 2024 & 2032
- Figure 30: Middle East and Africa Wearable Inertial Sensors Market Revenue (Million), by Product Type 2024 & 2032
- Figure 31: Middle East and Africa Wearable Inertial Sensors Market Revenue Share (%), by Product Type 2024 & 2032
- Figure 32: Middle East and Africa Wearable Inertial Sensors Market Revenue (Million), by End-user Type 2024 & 2032
- Figure 33: Middle East and Africa Wearable Inertial Sensors Market Revenue Share (%), by End-user Type 2024 & 2032
- Figure 34: Middle East and Africa Wearable Inertial Sensors Market Revenue (Million), by Country 2024 & 2032
- Figure 35: Middle East and Africa Wearable Inertial Sensors Market Revenue Share (%), by Country 2024 & 2032
- Figure 36: Latin America Wearable Inertial Sensors Market Revenue (Million), by Product Type 2024 & 2032
- Figure 37: Latin America Wearable Inertial Sensors Market Revenue Share (%), by Product Type 2024 & 2032
- Figure 38: Latin America Wearable Inertial Sensors Market Revenue (Million), by End-user Type 2024 & 2032
- Figure 39: Latin America Wearable Inertial Sensors Market Revenue Share (%), by End-user Type 2024 & 2032
- Figure 40: Latin America Wearable Inertial Sensors Market Revenue (Million), by Country 2024 & 2032
- Figure 41: Latin America Wearable Inertial Sensors Market Revenue Share (%), by Country 2024 & 2032
List of Tables
- Table 1: Global Wearable Inertial Sensors Market Revenue Million Forecast, by Region 2019 & 2032
- Table 2: Global Wearable Inertial Sensors Market Revenue Million Forecast, by Product Type 2019 & 2032
- Table 3: Global Wearable Inertial Sensors Market Revenue Million Forecast, by End-user Type 2019 & 2032
- Table 4: Global Wearable Inertial Sensors Market Revenue Million Forecast, by Region 2019 & 2032
- Table 5: Global Wearable Inertial Sensors Market Revenue Million Forecast, by Country 2019 & 2032
- Table 6: United States Wearable Inertial Sensors Market Revenue (Million) Forecast, by Application 2019 & 2032
- Table 7: Canada Wearable Inertial Sensors Market Revenue (Million) Forecast, by Application 2019 & 2032
- Table 8: Global Wearable Inertial Sensors Market Revenue Million Forecast, by Country 2019 & 2032
- Table 9: Germany Wearable Inertial Sensors Market Revenue (Million) Forecast, by Application 2019 & 2032
- Table 10: United Kingdom Wearable Inertial Sensors Market Revenue (Million) Forecast, by Application 2019 & 2032
- Table 11: France Wearable Inertial Sensors Market Revenue (Million) Forecast, by Application 2019 & 2032
- Table 12: Global Wearable Inertial Sensors Market Revenue Million Forecast, by Country 2019 & 2032
- Table 13: China Wearable Inertial Sensors Market Revenue (Million) Forecast, by Application 2019 & 2032
- Table 14: India Wearable Inertial Sensors Market Revenue (Million) Forecast, by Application 2019 & 2032
- Table 15: Japan Wearable Inertial Sensors Market Revenue (Million) Forecast, by Application 2019 & 2032
- Table 16: South Korea Wearable Inertial Sensors Market Revenue (Million) Forecast, by Application 2019 & 2032
- Table 17: Australia and New Zealand Wearable Inertial Sensors Market Revenue (Million) Forecast, by Application 2019 & 2032
- Table 18: Global Wearable Inertial Sensors Market Revenue Million Forecast, by Country 2019 & 2032
- Table 19: United Arab Emirates Wearable Inertial Sensors Market Revenue (Million) Forecast, by Application 2019 & 2032
- Table 20: Saudi Arabia Wearable Inertial Sensors Market Revenue (Million) Forecast, by Application 2019 & 2032
- Table 21: Israel Wearable Inertial Sensors Market Revenue (Million) Forecast, by Application 2019 & 2032
- Table 22: Global Wearable Inertial Sensors Market Revenue Million Forecast, by Country 2019 & 2032
- Table 23: Brazil Wearable Inertial Sensors Market Revenue (Million) Forecast, by Application 2019 & 2032
- Table 24: Argentina Wearable Inertial Sensors Market Revenue (Million) Forecast, by Application 2019 & 2032
- Table 25: Mexico Wearable Inertial Sensors Market Revenue (Million) Forecast, by Application 2019 & 2032
- Table 26: Global Wearable Inertial Sensors Market Revenue Million Forecast, by Product Type 2019 & 2032
- Table 27: Global Wearable Inertial Sensors Market Revenue Million Forecast, by End-user Type 2019 & 2032
- Table 28: Global Wearable Inertial Sensors Market Revenue Million Forecast, by Country 2019 & 2032
- Table 29: United States Wearable Inertial Sensors Market Revenue (Million) Forecast, by Application 2019 & 2032
- Table 30: Canada Wearable Inertial Sensors Market Revenue (Million) Forecast, by Application 2019 & 2032
- Table 31: Global Wearable Inertial Sensors Market Revenue Million Forecast, by Product Type 2019 & 2032
- Table 32: Global Wearable Inertial Sensors Market Revenue Million Forecast, by End-user Type 2019 & 2032
- Table 33: Global Wearable Inertial Sensors Market Revenue Million Forecast, by Country 2019 & 2032
- Table 34: Germany Wearable Inertial Sensors Market Revenue (Million) Forecast, by Application 2019 & 2032
- Table 35: United Kingdom Wearable Inertial Sensors Market Revenue (Million) Forecast, by Application 2019 & 2032
- Table 36: France Wearable Inertial Sensors Market Revenue (Million) Forecast, by Application 2019 & 2032
- Table 37: Global Wearable Inertial Sensors Market Revenue Million Forecast, by Product Type 2019 & 2032
- Table 38: Global Wearable Inertial Sensors Market Revenue Million Forecast, by End-user Type 2019 & 2032
- Table 39: Global Wearable Inertial Sensors Market Revenue Million Forecast, by Country 2019 & 2032
- Table 40: China Wearable Inertial Sensors Market Revenue (Million) Forecast, by Application 2019 & 2032
- Table 41: India Wearable Inertial Sensors Market Revenue (Million) Forecast, by Application 2019 & 2032
- Table 42: Japan Wearable Inertial Sensors Market Revenue (Million) Forecast, by Application 2019 & 2032
- Table 43: South Korea Wearable Inertial Sensors Market Revenue (Million) Forecast, by Application 2019 & 2032
- Table 44: Australia and New Zealand Wearable Inertial Sensors Market Revenue (Million) Forecast, by Application 2019 & 2032
- Table 45: Global Wearable Inertial Sensors Market Revenue Million Forecast, by Product Type 2019 & 2032
- Table 46: Global Wearable Inertial Sensors Market Revenue Million Forecast, by End-user Type 2019 & 2032
- Table 47: Global Wearable Inertial Sensors Market Revenue Million Forecast, by Country 2019 & 2032
- Table 48: United Arab Emirates Wearable Inertial Sensors Market Revenue (Million) Forecast, by Application 2019 & 2032
- Table 49: Saudi Arabia Wearable Inertial Sensors Market Revenue (Million) Forecast, by Application 2019 & 2032
- Table 50: Israel Wearable Inertial Sensors Market Revenue (Million) Forecast, by Application 2019 & 2032
- Table 51: Global Wearable Inertial Sensors Market Revenue Million Forecast, by Product Type 2019 & 2032
- Table 52: Global Wearable Inertial Sensors Market Revenue Million Forecast, by End-user Type 2019 & 2032
- Table 53: Global Wearable Inertial Sensors Market Revenue Million Forecast, by Country 2019 & 2032
- Table 54: Brazil Wearable Inertial Sensors Market Revenue (Million) Forecast, by Application 2019 & 2032
- Table 55: Argentina Wearable Inertial Sensors Market Revenue (Million) Forecast, by Application 2019 & 2032
- Table 56: Mexico Wearable Inertial Sensors Market Revenue (Million) Forecast, by Application 2019 & 2032
Frequently Asked Questions
1. What is the projected Compound Annual Growth Rate (CAGR) of the Wearable Inertial Sensors Market?
The projected CAGR is approximately 10.95%.
2. Which companies are prominent players in the Wearable Inertial Sensors Market?
Key companies in the market include InvenSense Inc (TDK Corporation)*List Not Exhaustive, Infineon Technologies AG, Honeywell International Inc, NXP Semiconductors NV, Bosch Sensortec GmbH, Knowles Electronics, General Electric Co, STMicroelectronics NV, TE Connectivity Ltd, Texas Instruments Incorporated, Analog Devices Inc, Panasonic Corporation, AMS osram AG.
3. What are the main segments of the Wearable Inertial Sensors Market?
The market segments include Product Type, End-user Type.
4. Can you provide details about the market size?
The market size is estimated to be USD 0.77 Million as of 2022.
5. What are some drivers contributing to market growth?
Increasing health awareness; Growing Demand for Wearable Fitness Monitors; Rapid Technology Advancements.
6. What are the notable trends driving market growth?
Consumer Electronics to Witness Significant Growth.
7. Are there any restraints impacting market growth?
Security concerns; High cost of the devices.
8. Can you provide examples of recent developments in the market?
January 2023 - Wearable Devices Ltd. established a partnership with a Fortune 500 communications equipment firm (the partner) as an Independent Software Vendor ("ISV"). The partnership will make it easier for the partner's chipset to include the Mudra Neural Input technology. All of the partner's clients that manufacture wearables will be able to use a touchless input platform that is ready to deploy due to Mudra technology which combines its sensors and artificial intelligence (AI).
9. What pricing options are available for accessing the report?
Pricing options include single-user, multi-user, and enterprise licenses priced at USD 4750, USD 5250, and USD 8750 respectively.
10. Is the market size provided in terms of value or volume?
The market size is provided in terms of value, measured in Million.
11. Are there any specific market keywords associated with the report?
Yes, the market keyword associated with the report is "Wearable Inertial Sensors Market," which aids in identifying and referencing the specific market segment covered.
12. How do I determine which pricing option suits my needs best?
The pricing options vary based on user requirements and access needs. Individual users may opt for single-user licenses, while businesses requiring broader access may choose multi-user or enterprise licenses for cost-effective access to the report.
13. Are there any additional resources or data provided in the Wearable Inertial Sensors Market report?
While the report offers comprehensive insights, it's advisable to review the specific contents or supplementary materials provided to ascertain if additional resources or data are available.
14. How can I stay updated on further developments or reports in the Wearable Inertial Sensors Market?
To stay informed about further developments, trends, and reports in the Wearable Inertial Sensors Market, consider subscribing to industry newsletters, following relevant companies and organizations, or regularly checking reputable industry news sources and publications.
Methodology
Step 1 - Identification of Relevant Samples Size from Population Database


Step 2 - Approaches for Defining Global Market Size (Value, Volume* & Price*)

Note*: In applicable scenarios
Step 3 - Data Sources
Primary Research
- Web Analytics
- Survey Reports
- Research Institute
- Latest Research Reports
- Opinion Leaders
Secondary Research
- Annual Reports
- White Paper
- Latest Press Release
- Industry Association
- Paid Database
- Investor Presentations

Step 4 - Data Triangulation
Involves using different sources of information in order to increase the validity of a study
These sources are likely to be stakeholders in a program - participants, other researchers, program staff, other community members, and so on.
Then we put all data in single framework & apply various statistical tools to find out the dynamic on the market.
During the analysis stage, feedback from the stakeholder groups would be compared to determine areas of agreement as well as areas of divergence


