
Key Insights
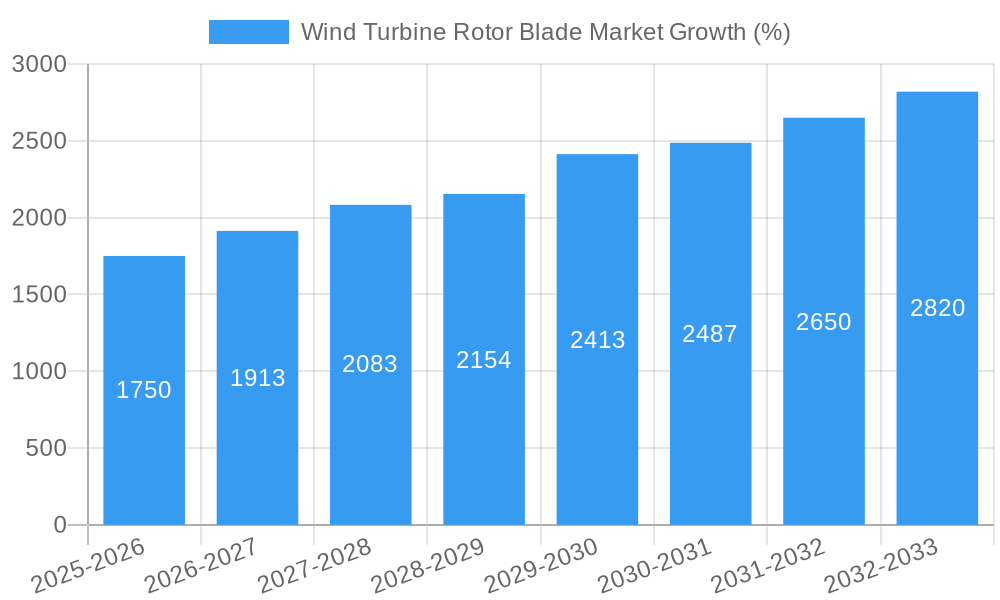
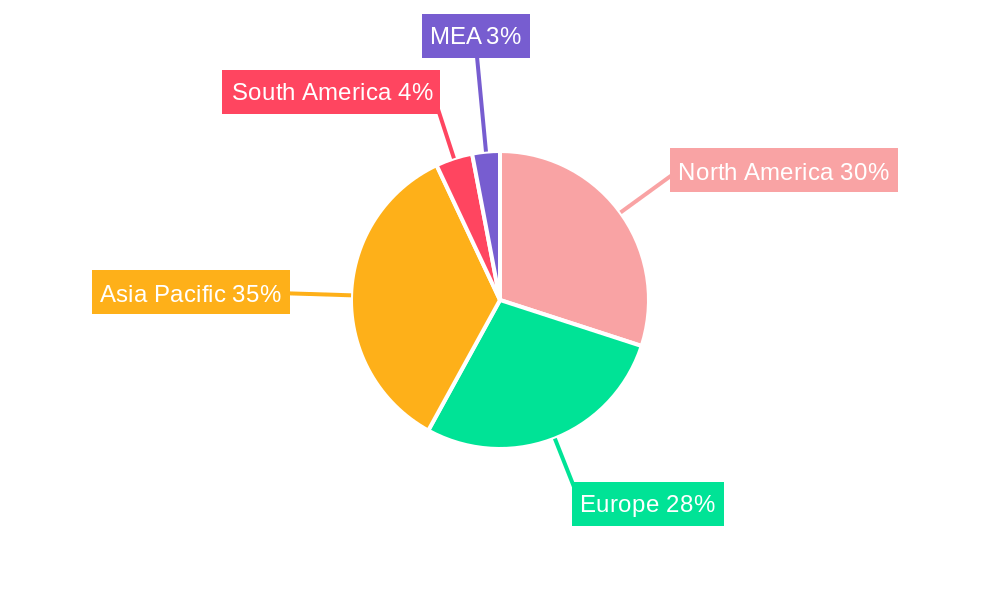
The global wind turbine rotor blade market is experiencing robust growth, driven by the increasing demand for renewable energy sources and supportive government policies aimed at mitigating climate change. The market's Compound Annual Growth Rate (CAGR) exceeding 7.00% signifies a significant expansion projected through 2033. This growth is fueled by several key factors: the rising adoption of wind energy across various regions, technological advancements leading to larger and more efficient blades (particularly those utilizing carbon fiber for enhanced durability and performance), and the continuous expansion of offshore wind farms, which necessitate specialized blade designs. The market segmentation reveals a strong preference for carbon fiber blades due to their superior strength-to-weight ratio, contributing to higher energy capture and reduced maintenance costs. Geographically, North America and Europe currently hold significant market share, but the Asia-Pacific region, particularly China and India, is expected to witness substantial growth in the coming years due to massive investments in wind energy infrastructure. While challenges like high initial investment costs and potential supply chain disruptions exist, the long-term prospects for the wind turbine rotor blade market remain exceptionally positive, supported by the global commitment to transitioning towards a cleaner energy future.
The competitive landscape is characterized by a mix of established players like Vestas, Siemens Gamesa, and GE Renewable Energy, and specialized manufacturers such as TPI Composites and LM Wind Power. These companies are constantly innovating to improve blade design, materials, and manufacturing processes to enhance efficiency and reduce costs. The market is likely to see further consolidation as companies strive for economies of scale and technological leadership. The ongoing research and development efforts focusing on blade durability, lifespan extension, and the exploration of new materials promise to further drive market growth and improve the overall efficiency of wind energy generation. The strategic partnerships between blade manufacturers and wind turbine OEMs play a crucial role in driving market penetration and ensuring the seamless integration of advanced blades into new wind farm projects. Successful navigation of logistical and regulatory hurdles in different regions will be vital for sustained market expansion.
Wind Turbine Rotor Blade Market: A Comprehensive Report (2019-2033)
This in-depth report provides a comprehensive analysis of the Wind Turbine Rotor Blade market, offering valuable insights into market dynamics, competitive landscape, and future growth prospects. Covering the period 2019-2033, with a focus on 2025, this report is an essential resource for industry stakeholders, investors, and strategic decision-makers.
Wind Turbine Rotor Blade Market Market Concentration & Innovation
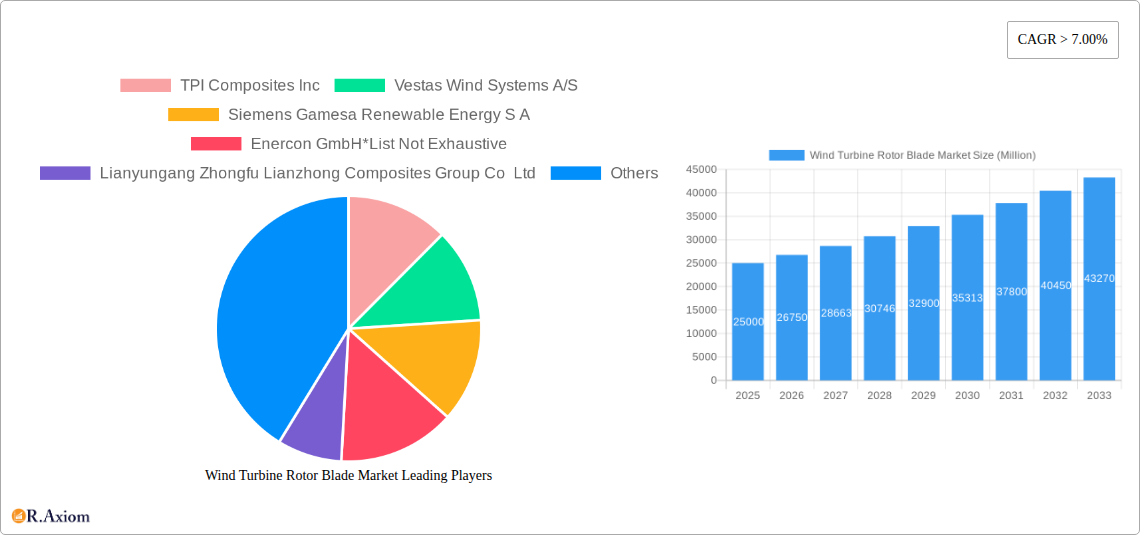
The wind turbine rotor blade market exhibits a moderately concentrated landscape, with a few major players holding significant market share. Key players such as TPI Composites Inc, Vestas Wind Systems A/S, Siemens Gamesa Renewable Energy S.A, and Enercon GmbH (List Not Exhaustive), along with Lianyungang Zhongfu Lianzhong Composites Group Co Ltd, MFG Wind, LM Wind Power (a GE Renewable Energy business), Sinoma wind power blade Co Ltd, Suzlon Energy Limited, Nordex SE, and Aeris Energy, compete fiercely for market dominance. Market share fluctuations are influenced by factors like technological advancements, production capacity, and strategic partnerships. M&A activity has played a significant role in shaping the market structure, with deal values ranging from xx Million to xx Million in recent years. Innovation is a key driver, with companies investing heavily in R&D to develop lighter, more efficient, and durable blades. Regulatory frameworks, particularly those focused on renewable energy targets and environmental sustainability, significantly influence market growth. The emergence of recyclable blade materials is a significant innovation, challenging the dominance of traditional materials. End-user trends toward larger turbines and offshore deployments also shape market demand.
- Market Concentration: Moderately concentrated, with top players holding xx% market share in 2024.
- Innovation Drivers: Lightweight materials, improved aerodynamics, recyclability, automation in manufacturing.
- M&A Activity: xx deals valued at approximately xx Million in the last 5 years.
- Regulatory Frameworks: Stringent environmental regulations and renewable energy mandates drive market growth.
- Product Substitutes: Limited direct substitutes, but advancements in other renewable energy technologies pose indirect competition.
- End-User Trends: Increasing demand for larger turbines for both onshore and offshore projects.
Wind Turbine Rotor Blade Market Industry Trends & Insights
The wind turbine rotor blade market is experiencing robust growth, driven by the global transition towards renewable energy sources. The compound annual growth rate (CAGR) is projected to be xx% from 2025 to 2033, reaching a market size of xx Million by 2033. This growth is fueled by several key factors, including increasing government incentives for renewable energy projects, falling turbine costs, technological advancements in blade design and materials, and a growing awareness of climate change. Technological disruptions, such as the development of recyclable blades and advanced manufacturing techniques, are further accelerating market expansion. Consumer preferences for sustainable energy solutions are also contributing to the market's positive trajectory. The competitive landscape is highly dynamic, with companies constantly striving to improve efficiency, reduce costs, and offer innovative solutions. Market penetration of advanced blade materials like carbon fiber is gradually increasing, although glass fiber remains dominant due to its cost-effectiveness.
Dominant Markets & Segments in Wind Turbine Rotor Blade Market
The onshore segment currently dominates the wind turbine rotor blade market, accounting for xx% of the total market share in 2024. However, the offshore segment is expected to witness significant growth due to the abundance of wind resources in coastal areas and government support for offshore wind farm projects. In terms of blade materials, glass fiber remains the dominant material owing to its cost-effectiveness, though the market share of carbon fiber is steadily increasing due to its superior performance characteristics. Geographically, Asia-Pacific is projected to be the largest market for wind turbine rotor blades in 2024, driven by substantial investments in renewable energy infrastructure and supportive government policies. Europe is also a significant market player.
Onshore Segment Drivers:
- Lower installation costs compared to offshore.
- Easier access to land and infrastructure.
- Higher market maturity.
Offshore Segment Drivers:
- High wind speeds and consistent wind resources in offshore areas.
- Increasing government support and investments.
- Technological advancements making offshore installations more efficient and cost-effective.
Carbon Fiber Blade Drivers:
- High strength-to-weight ratio, resulting in longer blades and improved energy capture.
- Greater durability and resistance to fatigue.
Glass Fiber Blade Drivers:
- Lower cost compared to carbon fiber.
- Established manufacturing infrastructure.
Wind Turbine Rotor Blade Market Product Developments
Recent innovations in wind turbine rotor blades focus on enhancing efficiency, durability, and sustainability. This includes the development of lightweight composite materials, advanced blade designs with improved aerodynamics, and the incorporation of recyclable materials such as thermoplastic resins. These advancements are aimed at reducing the levelized cost of energy (LCOE) and improving the overall lifespan of wind turbines. The integration of smart sensors and digital technologies enables predictive maintenance and optimizes turbine performance, increasing operational efficiency.
Report Scope & Segmentation Analysis
This report segments the wind turbine rotor blade market by location of deployment (onshore and offshore) and blade material (carbon fiber, glass fiber, and other materials). Each segment's growth projections, market size, and competitive dynamics are analyzed in detail. The onshore segment is expected to witness steady growth, driven by large-scale wind farm deployments. The offshore segment presents significant growth opportunities due to its higher wind resource potential. Glass fiber currently holds the largest market share in terms of blade material, due to its lower cost, while carbon fiber is gaining traction owing to its improved performance characteristics. Other materials are gaining traction as sustainable and economical solutions are developed.
Key Drivers of Wind Turbine Rotor Blade Market Growth
Several factors drive growth in the wind turbine rotor blade market. These include increasing government support for renewable energy, falling costs of wind turbine technologies, growing demand for clean energy, advancements in blade materials and designs, and stringent environmental regulations promoting renewable energy adoption. The continuous development of larger and more efficient wind turbines further supports market expansion.
Challenges in the Wind Turbine Rotor Blade Market Sector
Challenges in this market include supply chain constraints for raw materials, high manufacturing costs, especially for advanced materials like carbon fiber, and the logistical complexities of transporting and installing large blades. Regulatory hurdles and permitting processes can also delay project development. Furthermore, intense competition among manufacturers puts pressure on profit margins. The impact of these challenges on market growth is estimated to be approximately xx% reduction in the overall market size by 2033.
Emerging Opportunities in Wind Turbine Rotor Blade Market
Emerging opportunities exist in the development of recyclable and sustainable blade materials, the integration of smart technologies for improved performance and maintenance, and the expansion into new markets, particularly in developing economies with significant wind energy potential. Advances in blade design, particularly for floating offshore wind turbines, also create significant opportunities.
Leading Players in the Wind Turbine Rotor Blade Market Market
- TPI Composites Inc
- Vestas Wind Systems A/S
- Siemens Gamesa Renewable Energy S.A
- Enercon GmbH
- Lianyungang Zhongfu Lianzhong Composites Group Co Ltd
- MFG Wind
- LM Wind Power (a GE Renewable Energy business)
- Sinoma wind power blade Co Ltd
- Suzlon Energy Limited
- Nordex SE
- Aeris Energy
Key Developments in Wind Turbine Rotor Blade Market Industry
- March 2022: The ZEBRA (Zero Waste Blade Research) consortium launched a 100% recyclable wind turbine prototype blade, signifying a major step towards a circular economy in the wind energy sector.
- March 2022: Hitachi Power Solutions introduced "Blade Total Service," leveraging AI and drone technology for advanced maintenance and risk mitigation of wind turbine blades.
Strategic Outlook for Wind Turbine Rotor Blade Market Market
The wind turbine rotor blade market is poised for continued strong growth over the forecast period, driven by the global push towards renewable energy and the ongoing technological advancements in blade design and materials. The market will likely see increased consolidation, with larger players acquiring smaller companies to expand their market share and technological capabilities. Focus on sustainability and recyclability will be crucial for long-term market success. The growing demand for larger and more efficient turbines for both onshore and offshore wind farms will further contribute to market expansion, presenting opportunities for innovative companies.
Wind Turbine Rotor Blade Market Segmentation
-
1. Location of Deployment
- 1.1. Onshore
- 1.2. Offshore
-
2. Blade Material
- 2.1. Carbon Fiber
- 2.2. Glass Fiber
- 2.3. Other Blade Materials
Wind Turbine Rotor Blade Market Segmentation By Geography
- 1. North America
- 2. Europe
- 3. Asia Pacific
- 4. South America
- 5. Middle East and Africa
Wind Turbine Rotor Blade Market REPORT HIGHLIGHTS
| Aspects | Details |
|---|---|
| Study Period | 2019-2033 |
| Base Year | 2024 |
| Estimated Year | 2025 |
| Forecast Period | 2025-2033 |
| Historical Period | 2019-2024 |
| Growth Rate | CAGR of > 7.00% from 2019-2033 |
| Segmentation |
|
Table of Contents
- 1. Introduction
- 1.1. Research Scope
- 1.2. Market Segmentation
- 1.3. Research Methodology
- 1.4. Definitions and Assumptions
- 2. Executive Summary
- 2.1. Introduction
- 3. Market Dynamics
- 3.1. Introduction
- 3.2. Market Drivers
- 3.2.1. 4.; Declining Cost Of Lithium-ion Batteries4.; Increasing Adoption of Electric Vehicles
- 3.3. Market Restrains
- 3.3.1. 4.; Demand and Supply of Raw Materials for Battery Manufacturing
- 3.4. Market Trends
- 3.4.1. Onshore Segment to Dominate the Market
- 4. Market Factor Analysis
- 4.1. Porters Five Forces
- 4.2. Supply/Value Chain
- 4.3. PESTEL analysis
- 4.4. Market Entropy
- 4.5. Patent/Trademark Analysis
- 5. Global Wind Turbine Rotor Blade Market Analysis, Insights and Forecast, 2019-2031
- 5.1. Market Analysis, Insights and Forecast - by Location of Deployment
- 5.1.1. Onshore
- 5.1.2. Offshore
- 5.2. Market Analysis, Insights and Forecast - by Blade Material
- 5.2.1. Carbon Fiber
- 5.2.2. Glass Fiber
- 5.2.3. Other Blade Materials
- 5.3. Market Analysis, Insights and Forecast - by Region
- 5.3.1. North America
- 5.3.2. Europe
- 5.3.3. Asia Pacific
- 5.3.4. South America
- 5.3.5. Middle East and Africa
- 5.1. Market Analysis, Insights and Forecast - by Location of Deployment
- 6. North America Wind Turbine Rotor Blade Market Analysis, Insights and Forecast, 2019-2031
- 6.1. Market Analysis, Insights and Forecast - by Location of Deployment
- 6.1.1. Onshore
- 6.1.2. Offshore
- 6.2. Market Analysis, Insights and Forecast - by Blade Material
- 6.2.1. Carbon Fiber
- 6.2.2. Glass Fiber
- 6.2.3. Other Blade Materials
- 6.1. Market Analysis, Insights and Forecast - by Location of Deployment
- 7. Europe Wind Turbine Rotor Blade Market Analysis, Insights and Forecast, 2019-2031
- 7.1. Market Analysis, Insights and Forecast - by Location of Deployment
- 7.1.1. Onshore
- 7.1.2. Offshore
- 7.2. Market Analysis, Insights and Forecast - by Blade Material
- 7.2.1. Carbon Fiber
- 7.2.2. Glass Fiber
- 7.2.3. Other Blade Materials
- 7.1. Market Analysis, Insights and Forecast - by Location of Deployment
- 8. Asia Pacific Wind Turbine Rotor Blade Market Analysis, Insights and Forecast, 2019-2031
- 8.1. Market Analysis, Insights and Forecast - by Location of Deployment
- 8.1.1. Onshore
- 8.1.2. Offshore
- 8.2. Market Analysis, Insights and Forecast - by Blade Material
- 8.2.1. Carbon Fiber
- 8.2.2. Glass Fiber
- 8.2.3. Other Blade Materials
- 8.1. Market Analysis, Insights and Forecast - by Location of Deployment
- 9. South America Wind Turbine Rotor Blade Market Analysis, Insights and Forecast, 2019-2031
- 9.1. Market Analysis, Insights and Forecast - by Location of Deployment
- 9.1.1. Onshore
- 9.1.2. Offshore
- 9.2. Market Analysis, Insights and Forecast - by Blade Material
- 9.2.1. Carbon Fiber
- 9.2.2. Glass Fiber
- 9.2.3. Other Blade Materials
- 9.1. Market Analysis, Insights and Forecast - by Location of Deployment
- 10. Middle East and Africa Wind Turbine Rotor Blade Market Analysis, Insights and Forecast, 2019-2031
- 10.1. Market Analysis, Insights and Forecast - by Location of Deployment
- 10.1.1. Onshore
- 10.1.2. Offshore
- 10.2. Market Analysis, Insights and Forecast - by Blade Material
- 10.2.1. Carbon Fiber
- 10.2.2. Glass Fiber
- 10.2.3. Other Blade Materials
- 10.1. Market Analysis, Insights and Forecast - by Location of Deployment
- 11. North America Wind Turbine Rotor Blade Market Analysis, Insights and Forecast, 2019-2031
- 11.1. Market Analysis, Insights and Forecast - By Country/Sub-region
- 11.1.1 United States
- 11.1.2 Canada
- 11.1.3 Mexico
- 12. Europe Wind Turbine Rotor Blade Market Analysis, Insights and Forecast, 2019-2031
- 12.1. Market Analysis, Insights and Forecast - By Country/Sub-region
- 12.1.1 Germany
- 12.1.2 United Kingdom
- 12.1.3 France
- 12.1.4 Spain
- 12.1.5 Italy
- 12.1.6 Spain
- 12.1.7 Belgium
- 12.1.8 Netherland
- 12.1.9 Nordics
- 12.1.10 Rest of Europe
- 13. Asia Pacific Wind Turbine Rotor Blade Market Analysis, Insights and Forecast, 2019-2031
- 13.1. Market Analysis, Insights and Forecast - By Country/Sub-region
- 13.1.1 China
- 13.1.2 Japan
- 13.1.3 India
- 13.1.4 South Korea
- 13.1.5 Southeast Asia
- 13.1.6 Australia
- 13.1.7 Indonesia
- 13.1.8 Phillipes
- 13.1.9 Singapore
- 13.1.10 Thailandc
- 13.1.11 Rest of Asia Pacific
- 14. South America Wind Turbine Rotor Blade Market Analysis, Insights and Forecast, 2019-2031
- 14.1. Market Analysis, Insights and Forecast - By Country/Sub-region
- 14.1.1 Brazil
- 14.1.2 Argentina
- 14.1.3 Peru
- 14.1.4 Chile
- 14.1.5 Colombia
- 14.1.6 Ecuador
- 14.1.7 Venezuela
- 14.1.8 Rest of South America
- 15. North America Wind Turbine Rotor Blade Market Analysis, Insights and Forecast, 2019-2031
- 15.1. Market Analysis, Insights and Forecast - By Country/Sub-region
- 15.1.1 United States
- 15.1.2 Canada
- 15.1.3 Mexico
- 16. MEA Wind Turbine Rotor Blade Market Analysis, Insights and Forecast, 2019-2031
- 16.1. Market Analysis, Insights and Forecast - By Country/Sub-region
- 16.1.1 United Arab Emirates
- 16.1.2 Saudi Arabia
- 16.1.3 South Africa
- 16.1.4 Rest of Middle East and Africa
- 17. Competitive Analysis
- 17.1. Global Market Share Analysis 2024
- 17.2. Company Profiles
- 17.2.1 TPI Composites Inc
- 17.2.1.1. Overview
- 17.2.1.2. Products
- 17.2.1.3. SWOT Analysis
- 17.2.1.4. Recent Developments
- 17.2.1.5. Financials (Based on Availability)
- 17.2.2 Vestas Wind Systems A/S
- 17.2.2.1. Overview
- 17.2.2.2. Products
- 17.2.2.3. SWOT Analysis
- 17.2.2.4. Recent Developments
- 17.2.2.5. Financials (Based on Availability)
- 17.2.3 Siemens Gamesa Renewable Energy S A
- 17.2.3.1. Overview
- 17.2.3.2. Products
- 17.2.3.3. SWOT Analysis
- 17.2.3.4. Recent Developments
- 17.2.3.5. Financials (Based on Availability)
- 17.2.4 Enercon GmbH*List Not Exhaustive
- 17.2.4.1. Overview
- 17.2.4.2. Products
- 17.2.4.3. SWOT Analysis
- 17.2.4.4. Recent Developments
- 17.2.4.5. Financials (Based on Availability)
- 17.2.5 Lianyungang Zhongfu Lianzhong Composites Group Co Ltd
- 17.2.5.1. Overview
- 17.2.5.2. Products
- 17.2.5.3. SWOT Analysis
- 17.2.5.4. Recent Developments
- 17.2.5.5. Financials (Based on Availability)
- 17.2.6 MFG Wind
- 17.2.6.1. Overview
- 17.2.6.2. Products
- 17.2.6.3. SWOT Analysis
- 17.2.6.4. Recent Developments
- 17.2.6.5. Financials (Based on Availability)
- 17.2.7 LM Wind Power (a GE Renewable Energy business)
- 17.2.7.1. Overview
- 17.2.7.2. Products
- 17.2.7.3. SWOT Analysis
- 17.2.7.4. Recent Developments
- 17.2.7.5. Financials (Based on Availability)
- 17.2.8 Sinoma wind power blade Co Ltd
- 17.2.8.1. Overview
- 17.2.8.2. Products
- 17.2.8.3. SWOT Analysis
- 17.2.8.4. Recent Developments
- 17.2.8.5. Financials (Based on Availability)
- 17.2.9 Suzlon Energy Limited
- 17.2.9.1. Overview
- 17.2.9.2. Products
- 17.2.9.3. SWOT Analysis
- 17.2.9.4. Recent Developments
- 17.2.9.5. Financials (Based on Availability)
- 17.2.10 Nordex SE
- 17.2.10.1. Overview
- 17.2.10.2. Products
- 17.2.10.3. SWOT Analysis
- 17.2.10.4. Recent Developments
- 17.2.10.5. Financials (Based on Availability)
- 17.2.11 Aeris Energy
- 17.2.11.1. Overview
- 17.2.11.2. Products
- 17.2.11.3. SWOT Analysis
- 17.2.11.4. Recent Developments
- 17.2.11.5. Financials (Based on Availability)
- 17.2.1 TPI Composites Inc
List of Figures
- Figure 1: Global Wind Turbine Rotor Blade Market Revenue Breakdown (Million, %) by Region 2024 & 2032
- Figure 2: Global Wind Turbine Rotor Blade Market Volume Breakdown (K Units, %) by Region 2024 & 2032
- Figure 3: North America Wind Turbine Rotor Blade Market Revenue (Million), by Country 2024 & 2032
- Figure 4: North America Wind Turbine Rotor Blade Market Volume (K Units), by Country 2024 & 2032
- Figure 5: North America Wind Turbine Rotor Blade Market Revenue Share (%), by Country 2024 & 2032
- Figure 6: North America Wind Turbine Rotor Blade Market Volume Share (%), by Country 2024 & 2032
- Figure 7: Europe Wind Turbine Rotor Blade Market Revenue (Million), by Country 2024 & 2032
- Figure 8: Europe Wind Turbine Rotor Blade Market Volume (K Units), by Country 2024 & 2032
- Figure 9: Europe Wind Turbine Rotor Blade Market Revenue Share (%), by Country 2024 & 2032
- Figure 10: Europe Wind Turbine Rotor Blade Market Volume Share (%), by Country 2024 & 2032
- Figure 11: Asia Pacific Wind Turbine Rotor Blade Market Revenue (Million), by Country 2024 & 2032
- Figure 12: Asia Pacific Wind Turbine Rotor Blade Market Volume (K Units), by Country 2024 & 2032
- Figure 13: Asia Pacific Wind Turbine Rotor Blade Market Revenue Share (%), by Country 2024 & 2032
- Figure 14: Asia Pacific Wind Turbine Rotor Blade Market Volume Share (%), by Country 2024 & 2032
- Figure 15: South America Wind Turbine Rotor Blade Market Revenue (Million), by Country 2024 & 2032
- Figure 16: South America Wind Turbine Rotor Blade Market Volume (K Units), by Country 2024 & 2032
- Figure 17: South America Wind Turbine Rotor Blade Market Revenue Share (%), by Country 2024 & 2032
- Figure 18: South America Wind Turbine Rotor Blade Market Volume Share (%), by Country 2024 & 2032
- Figure 19: North America Wind Turbine Rotor Blade Market Revenue (Million), by Country 2024 & 2032
- Figure 20: North America Wind Turbine Rotor Blade Market Volume (K Units), by Country 2024 & 2032
- Figure 21: North America Wind Turbine Rotor Blade Market Revenue Share (%), by Country 2024 & 2032
- Figure 22: North America Wind Turbine Rotor Blade Market Volume Share (%), by Country 2024 & 2032
- Figure 23: MEA Wind Turbine Rotor Blade Market Revenue (Million), by Country 2024 & 2032
- Figure 24: MEA Wind Turbine Rotor Blade Market Volume (K Units), by Country 2024 & 2032
- Figure 25: MEA Wind Turbine Rotor Blade Market Revenue Share (%), by Country 2024 & 2032
- Figure 26: MEA Wind Turbine Rotor Blade Market Volume Share (%), by Country 2024 & 2032
- Figure 27: North America Wind Turbine Rotor Blade Market Revenue (Million), by Location of Deployment 2024 & 2032
- Figure 28: North America Wind Turbine Rotor Blade Market Volume (K Units), by Location of Deployment 2024 & 2032
- Figure 29: North America Wind Turbine Rotor Blade Market Revenue Share (%), by Location of Deployment 2024 & 2032
- Figure 30: North America Wind Turbine Rotor Blade Market Volume Share (%), by Location of Deployment 2024 & 2032
- Figure 31: North America Wind Turbine Rotor Blade Market Revenue (Million), by Blade Material 2024 & 2032
- Figure 32: North America Wind Turbine Rotor Blade Market Volume (K Units), by Blade Material 2024 & 2032
- Figure 33: North America Wind Turbine Rotor Blade Market Revenue Share (%), by Blade Material 2024 & 2032
- Figure 34: North America Wind Turbine Rotor Blade Market Volume Share (%), by Blade Material 2024 & 2032
- Figure 35: North America Wind Turbine Rotor Blade Market Revenue (Million), by Country 2024 & 2032
- Figure 36: North America Wind Turbine Rotor Blade Market Volume (K Units), by Country 2024 & 2032
- Figure 37: North America Wind Turbine Rotor Blade Market Revenue Share (%), by Country 2024 & 2032
- Figure 38: North America Wind Turbine Rotor Blade Market Volume Share (%), by Country 2024 & 2032
- Figure 39: Europe Wind Turbine Rotor Blade Market Revenue (Million), by Location of Deployment 2024 & 2032
- Figure 40: Europe Wind Turbine Rotor Blade Market Volume (K Units), by Location of Deployment 2024 & 2032
- Figure 41: Europe Wind Turbine Rotor Blade Market Revenue Share (%), by Location of Deployment 2024 & 2032
- Figure 42: Europe Wind Turbine Rotor Blade Market Volume Share (%), by Location of Deployment 2024 & 2032
- Figure 43: Europe Wind Turbine Rotor Blade Market Revenue (Million), by Blade Material 2024 & 2032
- Figure 44: Europe Wind Turbine Rotor Blade Market Volume (K Units), by Blade Material 2024 & 2032
- Figure 45: Europe Wind Turbine Rotor Blade Market Revenue Share (%), by Blade Material 2024 & 2032
- Figure 46: Europe Wind Turbine Rotor Blade Market Volume Share (%), by Blade Material 2024 & 2032
- Figure 47: Europe Wind Turbine Rotor Blade Market Revenue (Million), by Country 2024 & 2032
- Figure 48: Europe Wind Turbine Rotor Blade Market Volume (K Units), by Country 2024 & 2032
- Figure 49: Europe Wind Turbine Rotor Blade Market Revenue Share (%), by Country 2024 & 2032
- Figure 50: Europe Wind Turbine Rotor Blade Market Volume Share (%), by Country 2024 & 2032
- Figure 51: Asia Pacific Wind Turbine Rotor Blade Market Revenue (Million), by Location of Deployment 2024 & 2032
- Figure 52: Asia Pacific Wind Turbine Rotor Blade Market Volume (K Units), by Location of Deployment 2024 & 2032
- Figure 53: Asia Pacific Wind Turbine Rotor Blade Market Revenue Share (%), by Location of Deployment 2024 & 2032
- Figure 54: Asia Pacific Wind Turbine Rotor Blade Market Volume Share (%), by Location of Deployment 2024 & 2032
- Figure 55: Asia Pacific Wind Turbine Rotor Blade Market Revenue (Million), by Blade Material 2024 & 2032
- Figure 56: Asia Pacific Wind Turbine Rotor Blade Market Volume (K Units), by Blade Material 2024 & 2032
- Figure 57: Asia Pacific Wind Turbine Rotor Blade Market Revenue Share (%), by Blade Material 2024 & 2032
- Figure 58: Asia Pacific Wind Turbine Rotor Blade Market Volume Share (%), by Blade Material 2024 & 2032
- Figure 59: Asia Pacific Wind Turbine Rotor Blade Market Revenue (Million), by Country 2024 & 2032
- Figure 60: Asia Pacific Wind Turbine Rotor Blade Market Volume (K Units), by Country 2024 & 2032
- Figure 61: Asia Pacific Wind Turbine Rotor Blade Market Revenue Share (%), by Country 2024 & 2032
- Figure 62: Asia Pacific Wind Turbine Rotor Blade Market Volume Share (%), by Country 2024 & 2032
- Figure 63: South America Wind Turbine Rotor Blade Market Revenue (Million), by Location of Deployment 2024 & 2032
- Figure 64: South America Wind Turbine Rotor Blade Market Volume (K Units), by Location of Deployment 2024 & 2032
- Figure 65: South America Wind Turbine Rotor Blade Market Revenue Share (%), by Location of Deployment 2024 & 2032
- Figure 66: South America Wind Turbine Rotor Blade Market Volume Share (%), by Location of Deployment 2024 & 2032
- Figure 67: South America Wind Turbine Rotor Blade Market Revenue (Million), by Blade Material 2024 & 2032
- Figure 68: South America Wind Turbine Rotor Blade Market Volume (K Units), by Blade Material 2024 & 2032
- Figure 69: South America Wind Turbine Rotor Blade Market Revenue Share (%), by Blade Material 2024 & 2032
- Figure 70: South America Wind Turbine Rotor Blade Market Volume Share (%), by Blade Material 2024 & 2032
- Figure 71: South America Wind Turbine Rotor Blade Market Revenue (Million), by Country 2024 & 2032
- Figure 72: South America Wind Turbine Rotor Blade Market Volume (K Units), by Country 2024 & 2032
- Figure 73: South America Wind Turbine Rotor Blade Market Revenue Share (%), by Country 2024 & 2032
- Figure 74: South America Wind Turbine Rotor Blade Market Volume Share (%), by Country 2024 & 2032
- Figure 75: Middle East and Africa Wind Turbine Rotor Blade Market Revenue (Million), by Location of Deployment 2024 & 2032
- Figure 76: Middle East and Africa Wind Turbine Rotor Blade Market Volume (K Units), by Location of Deployment 2024 & 2032
- Figure 77: Middle East and Africa Wind Turbine Rotor Blade Market Revenue Share (%), by Location of Deployment 2024 & 2032
- Figure 78: Middle East and Africa Wind Turbine Rotor Blade Market Volume Share (%), by Location of Deployment 2024 & 2032
- Figure 79: Middle East and Africa Wind Turbine Rotor Blade Market Revenue (Million), by Blade Material 2024 & 2032
- Figure 80: Middle East and Africa Wind Turbine Rotor Blade Market Volume (K Units), by Blade Material 2024 & 2032
- Figure 81: Middle East and Africa Wind Turbine Rotor Blade Market Revenue Share (%), by Blade Material 2024 & 2032
- Figure 82: Middle East and Africa Wind Turbine Rotor Blade Market Volume Share (%), by Blade Material 2024 & 2032
- Figure 83: Middle East and Africa Wind Turbine Rotor Blade Market Revenue (Million), by Country 2024 & 2032
- Figure 84: Middle East and Africa Wind Turbine Rotor Blade Market Volume (K Units), by Country 2024 & 2032
- Figure 85: Middle East and Africa Wind Turbine Rotor Blade Market Revenue Share (%), by Country 2024 & 2032
- Figure 86: Middle East and Africa Wind Turbine Rotor Blade Market Volume Share (%), by Country 2024 & 2032
List of Tables
- Table 1: Global Wind Turbine Rotor Blade Market Revenue Million Forecast, by Region 2019 & 2032
- Table 2: Global Wind Turbine Rotor Blade Market Volume K Units Forecast, by Region 2019 & 2032
- Table 3: Global Wind Turbine Rotor Blade Market Revenue Million Forecast, by Location of Deployment 2019 & 2032
- Table 4: Global Wind Turbine Rotor Blade Market Volume K Units Forecast, by Location of Deployment 2019 & 2032
- Table 5: Global Wind Turbine Rotor Blade Market Revenue Million Forecast, by Blade Material 2019 & 2032
- Table 6: Global Wind Turbine Rotor Blade Market Volume K Units Forecast, by Blade Material 2019 & 2032
- Table 7: Global Wind Turbine Rotor Blade Market Revenue Million Forecast, by Region 2019 & 2032
- Table 8: Global Wind Turbine Rotor Blade Market Volume K Units Forecast, by Region 2019 & 2032
- Table 9: Global Wind Turbine Rotor Blade Market Revenue Million Forecast, by Country 2019 & 2032
- Table 10: Global Wind Turbine Rotor Blade Market Volume K Units Forecast, by Country 2019 & 2032
- Table 11: United States Wind Turbine Rotor Blade Market Revenue (Million) Forecast, by Application 2019 & 2032
- Table 12: United States Wind Turbine Rotor Blade Market Volume (K Units) Forecast, by Application 2019 & 2032
- Table 13: Canada Wind Turbine Rotor Blade Market Revenue (Million) Forecast, by Application 2019 & 2032
- Table 14: Canada Wind Turbine Rotor Blade Market Volume (K Units) Forecast, by Application 2019 & 2032
- Table 15: Mexico Wind Turbine Rotor Blade Market Revenue (Million) Forecast, by Application 2019 & 2032
- Table 16: Mexico Wind Turbine Rotor Blade Market Volume (K Units) Forecast, by Application 2019 & 2032
- Table 17: Global Wind Turbine Rotor Blade Market Revenue Million Forecast, by Country 2019 & 2032
- Table 18: Global Wind Turbine Rotor Blade Market Volume K Units Forecast, by Country 2019 & 2032
- Table 19: Germany Wind Turbine Rotor Blade Market Revenue (Million) Forecast, by Application 2019 & 2032
- Table 20: Germany Wind Turbine Rotor Blade Market Volume (K Units) Forecast, by Application 2019 & 2032
- Table 21: United Kingdom Wind Turbine Rotor Blade Market Revenue (Million) Forecast, by Application 2019 & 2032
- Table 22: United Kingdom Wind Turbine Rotor Blade Market Volume (K Units) Forecast, by Application 2019 & 2032
- Table 23: France Wind Turbine Rotor Blade Market Revenue (Million) Forecast, by Application 2019 & 2032
- Table 24: France Wind Turbine Rotor Blade Market Volume (K Units) Forecast, by Application 2019 & 2032
- Table 25: Spain Wind Turbine Rotor Blade Market Revenue (Million) Forecast, by Application 2019 & 2032
- Table 26: Spain Wind Turbine Rotor Blade Market Volume (K Units) Forecast, by Application 2019 & 2032
- Table 27: Italy Wind Turbine Rotor Blade Market Revenue (Million) Forecast, by Application 2019 & 2032
- Table 28: Italy Wind Turbine Rotor Blade Market Volume (K Units) Forecast, by Application 2019 & 2032
- Table 29: Spain Wind Turbine Rotor Blade Market Revenue (Million) Forecast, by Application 2019 & 2032
- Table 30: Spain Wind Turbine Rotor Blade Market Volume (K Units) Forecast, by Application 2019 & 2032
- Table 31: Belgium Wind Turbine Rotor Blade Market Revenue (Million) Forecast, by Application 2019 & 2032
- Table 32: Belgium Wind Turbine Rotor Blade Market Volume (K Units) Forecast, by Application 2019 & 2032
- Table 33: Netherland Wind Turbine Rotor Blade Market Revenue (Million) Forecast, by Application 2019 & 2032
- Table 34: Netherland Wind Turbine Rotor Blade Market Volume (K Units) Forecast, by Application 2019 & 2032
- Table 35: Nordics Wind Turbine Rotor Blade Market Revenue (Million) Forecast, by Application 2019 & 2032
- Table 36: Nordics Wind Turbine Rotor Blade Market Volume (K Units) Forecast, by Application 2019 & 2032
- Table 37: Rest of Europe Wind Turbine Rotor Blade Market Revenue (Million) Forecast, by Application 2019 & 2032
- Table 38: Rest of Europe Wind Turbine Rotor Blade Market Volume (K Units) Forecast, by Application 2019 & 2032
- Table 39: Global Wind Turbine Rotor Blade Market Revenue Million Forecast, by Country 2019 & 2032
- Table 40: Global Wind Turbine Rotor Blade Market Volume K Units Forecast, by Country 2019 & 2032
- Table 41: China Wind Turbine Rotor Blade Market Revenue (Million) Forecast, by Application 2019 & 2032
- Table 42: China Wind Turbine Rotor Blade Market Volume (K Units) Forecast, by Application 2019 & 2032
- Table 43: Japan Wind Turbine Rotor Blade Market Revenue (Million) Forecast, by Application 2019 & 2032
- Table 44: Japan Wind Turbine Rotor Blade Market Volume (K Units) Forecast, by Application 2019 & 2032
- Table 45: India Wind Turbine Rotor Blade Market Revenue (Million) Forecast, by Application 2019 & 2032
- Table 46: India Wind Turbine Rotor Blade Market Volume (K Units) Forecast, by Application 2019 & 2032
- Table 47: South Korea Wind Turbine Rotor Blade Market Revenue (Million) Forecast, by Application 2019 & 2032
- Table 48: South Korea Wind Turbine Rotor Blade Market Volume (K Units) Forecast, by Application 2019 & 2032
- Table 49: Southeast Asia Wind Turbine Rotor Blade Market Revenue (Million) Forecast, by Application 2019 & 2032
- Table 50: Southeast Asia Wind Turbine Rotor Blade Market Volume (K Units) Forecast, by Application 2019 & 2032
- Table 51: Australia Wind Turbine Rotor Blade Market Revenue (Million) Forecast, by Application 2019 & 2032
- Table 52: Australia Wind Turbine Rotor Blade Market Volume (K Units) Forecast, by Application 2019 & 2032
- Table 53: Indonesia Wind Turbine Rotor Blade Market Revenue (Million) Forecast, by Application 2019 & 2032
- Table 54: Indonesia Wind Turbine Rotor Blade Market Volume (K Units) Forecast, by Application 2019 & 2032
- Table 55: Phillipes Wind Turbine Rotor Blade Market Revenue (Million) Forecast, by Application 2019 & 2032
- Table 56: Phillipes Wind Turbine Rotor Blade Market Volume (K Units) Forecast, by Application 2019 & 2032
- Table 57: Singapore Wind Turbine Rotor Blade Market Revenue (Million) Forecast, by Application 2019 & 2032
- Table 58: Singapore Wind Turbine Rotor Blade Market Volume (K Units) Forecast, by Application 2019 & 2032
- Table 59: Thailandc Wind Turbine Rotor Blade Market Revenue (Million) Forecast, by Application 2019 & 2032
- Table 60: Thailandc Wind Turbine Rotor Blade Market Volume (K Units) Forecast, by Application 2019 & 2032
- Table 61: Rest of Asia Pacific Wind Turbine Rotor Blade Market Revenue (Million) Forecast, by Application 2019 & 2032
- Table 62: Rest of Asia Pacific Wind Turbine Rotor Blade Market Volume (K Units) Forecast, by Application 2019 & 2032
- Table 63: Global Wind Turbine Rotor Blade Market Revenue Million Forecast, by Country 2019 & 2032
- Table 64: Global Wind Turbine Rotor Blade Market Volume K Units Forecast, by Country 2019 & 2032
- Table 65: Brazil Wind Turbine Rotor Blade Market Revenue (Million) Forecast, by Application 2019 & 2032
- Table 66: Brazil Wind Turbine Rotor Blade Market Volume (K Units) Forecast, by Application 2019 & 2032
- Table 67: Argentina Wind Turbine Rotor Blade Market Revenue (Million) Forecast, by Application 2019 & 2032
- Table 68: Argentina Wind Turbine Rotor Blade Market Volume (K Units) Forecast, by Application 2019 & 2032
- Table 69: Peru Wind Turbine Rotor Blade Market Revenue (Million) Forecast, by Application 2019 & 2032
- Table 70: Peru Wind Turbine Rotor Blade Market Volume (K Units) Forecast, by Application 2019 & 2032
- Table 71: Chile Wind Turbine Rotor Blade Market Revenue (Million) Forecast, by Application 2019 & 2032
- Table 72: Chile Wind Turbine Rotor Blade Market Volume (K Units) Forecast, by Application 2019 & 2032
- Table 73: Colombia Wind Turbine Rotor Blade Market Revenue (Million) Forecast, by Application 2019 & 2032
- Table 74: Colombia Wind Turbine Rotor Blade Market Volume (K Units) Forecast, by Application 2019 & 2032
- Table 75: Ecuador Wind Turbine Rotor Blade Market Revenue (Million) Forecast, by Application 2019 & 2032
- Table 76: Ecuador Wind Turbine Rotor Blade Market Volume (K Units) Forecast, by Application 2019 & 2032
- Table 77: Venezuela Wind Turbine Rotor Blade Market Revenue (Million) Forecast, by Application 2019 & 2032
- Table 78: Venezuela Wind Turbine Rotor Blade Market Volume (K Units) Forecast, by Application 2019 & 2032
- Table 79: Rest of South America Wind Turbine Rotor Blade Market Revenue (Million) Forecast, by Application 2019 & 2032
- Table 80: Rest of South America Wind Turbine Rotor Blade Market Volume (K Units) Forecast, by Application 2019 & 2032
- Table 81: Global Wind Turbine Rotor Blade Market Revenue Million Forecast, by Country 2019 & 2032
- Table 82: Global Wind Turbine Rotor Blade Market Volume K Units Forecast, by Country 2019 & 2032
- Table 83: United States Wind Turbine Rotor Blade Market Revenue (Million) Forecast, by Application 2019 & 2032
- Table 84: United States Wind Turbine Rotor Blade Market Volume (K Units) Forecast, by Application 2019 & 2032
- Table 85: Canada Wind Turbine Rotor Blade Market Revenue (Million) Forecast, by Application 2019 & 2032
- Table 86: Canada Wind Turbine Rotor Blade Market Volume (K Units) Forecast, by Application 2019 & 2032
- Table 87: Mexico Wind Turbine Rotor Blade Market Revenue (Million) Forecast, by Application 2019 & 2032
- Table 88: Mexico Wind Turbine Rotor Blade Market Volume (K Units) Forecast, by Application 2019 & 2032
- Table 89: Global Wind Turbine Rotor Blade Market Revenue Million Forecast, by Country 2019 & 2032
- Table 90: Global Wind Turbine Rotor Blade Market Volume K Units Forecast, by Country 2019 & 2032
- Table 91: United Arab Emirates Wind Turbine Rotor Blade Market Revenue (Million) Forecast, by Application 2019 & 2032
- Table 92: United Arab Emirates Wind Turbine Rotor Blade Market Volume (K Units) Forecast, by Application 2019 & 2032
- Table 93: Saudi Arabia Wind Turbine Rotor Blade Market Revenue (Million) Forecast, by Application 2019 & 2032
- Table 94: Saudi Arabia Wind Turbine Rotor Blade Market Volume (K Units) Forecast, by Application 2019 & 2032
- Table 95: South Africa Wind Turbine Rotor Blade Market Revenue (Million) Forecast, by Application 2019 & 2032
- Table 96: South Africa Wind Turbine Rotor Blade Market Volume (K Units) Forecast, by Application 2019 & 2032
- Table 97: Rest of Middle East and Africa Wind Turbine Rotor Blade Market Revenue (Million) Forecast, by Application 2019 & 2032
- Table 98: Rest of Middle East and Africa Wind Turbine Rotor Blade Market Volume (K Units) Forecast, by Application 2019 & 2032
- Table 99: Global Wind Turbine Rotor Blade Market Revenue Million Forecast, by Location of Deployment 2019 & 2032
- Table 100: Global Wind Turbine Rotor Blade Market Volume K Units Forecast, by Location of Deployment 2019 & 2032
- Table 101: Global Wind Turbine Rotor Blade Market Revenue Million Forecast, by Blade Material 2019 & 2032
- Table 102: Global Wind Turbine Rotor Blade Market Volume K Units Forecast, by Blade Material 2019 & 2032
- Table 103: Global Wind Turbine Rotor Blade Market Revenue Million Forecast, by Country 2019 & 2032
- Table 104: Global Wind Turbine Rotor Blade Market Volume K Units Forecast, by Country 2019 & 2032
- Table 105: Global Wind Turbine Rotor Blade Market Revenue Million Forecast, by Location of Deployment 2019 & 2032
- Table 106: Global Wind Turbine Rotor Blade Market Volume K Units Forecast, by Location of Deployment 2019 & 2032
- Table 107: Global Wind Turbine Rotor Blade Market Revenue Million Forecast, by Blade Material 2019 & 2032
- Table 108: Global Wind Turbine Rotor Blade Market Volume K Units Forecast, by Blade Material 2019 & 2032
- Table 109: Global Wind Turbine Rotor Blade Market Revenue Million Forecast, by Country 2019 & 2032
- Table 110: Global Wind Turbine Rotor Blade Market Volume K Units Forecast, by Country 2019 & 2032
- Table 111: Global Wind Turbine Rotor Blade Market Revenue Million Forecast, by Location of Deployment 2019 & 2032
- Table 112: Global Wind Turbine Rotor Blade Market Volume K Units Forecast, by Location of Deployment 2019 & 2032
- Table 113: Global Wind Turbine Rotor Blade Market Revenue Million Forecast, by Blade Material 2019 & 2032
- Table 114: Global Wind Turbine Rotor Blade Market Volume K Units Forecast, by Blade Material 2019 & 2032
- Table 115: Global Wind Turbine Rotor Blade Market Revenue Million Forecast, by Country 2019 & 2032
- Table 116: Global Wind Turbine Rotor Blade Market Volume K Units Forecast, by Country 2019 & 2032
- Table 117: Global Wind Turbine Rotor Blade Market Revenue Million Forecast, by Location of Deployment 2019 & 2032
- Table 118: Global Wind Turbine Rotor Blade Market Volume K Units Forecast, by Location of Deployment 2019 & 2032
- Table 119: Global Wind Turbine Rotor Blade Market Revenue Million Forecast, by Blade Material 2019 & 2032
- Table 120: Global Wind Turbine Rotor Blade Market Volume K Units Forecast, by Blade Material 2019 & 2032
- Table 121: Global Wind Turbine Rotor Blade Market Revenue Million Forecast, by Country 2019 & 2032
- Table 122: Global Wind Turbine Rotor Blade Market Volume K Units Forecast, by Country 2019 & 2032
- Table 123: Global Wind Turbine Rotor Blade Market Revenue Million Forecast, by Location of Deployment 2019 & 2032
- Table 124: Global Wind Turbine Rotor Blade Market Volume K Units Forecast, by Location of Deployment 2019 & 2032
- Table 125: Global Wind Turbine Rotor Blade Market Revenue Million Forecast, by Blade Material 2019 & 2032
- Table 126: Global Wind Turbine Rotor Blade Market Volume K Units Forecast, by Blade Material 2019 & 2032
- Table 127: Global Wind Turbine Rotor Blade Market Revenue Million Forecast, by Country 2019 & 2032
- Table 128: Global Wind Turbine Rotor Blade Market Volume K Units Forecast, by Country 2019 & 2032
Frequently Asked Questions
1. What is the projected Compound Annual Growth Rate (CAGR) of the Wind Turbine Rotor Blade Market?
The projected CAGR is approximately > 7.00%.
2. Which companies are prominent players in the Wind Turbine Rotor Blade Market?
Key companies in the market include TPI Composites Inc, Vestas Wind Systems A/S, Siemens Gamesa Renewable Energy S A, Enercon GmbH*List Not Exhaustive, Lianyungang Zhongfu Lianzhong Composites Group Co Ltd, MFG Wind, LM Wind Power (a GE Renewable Energy business), Sinoma wind power blade Co Ltd, Suzlon Energy Limited, Nordex SE, Aeris Energy.
3. What are the main segments of the Wind Turbine Rotor Blade Market?
The market segments include Location of Deployment, Blade Material.
4. Can you provide details about the market size?
The market size is estimated to be USD XX Million as of 2022.
5. What are some drivers contributing to market growth?
4.; Declining Cost Of Lithium-ion Batteries4.; Increasing Adoption of Electric Vehicles.
6. What are the notable trends driving market growth?
Onshore Segment to Dominate the Market.
7. Are there any restraints impacting market growth?
4.; Demand and Supply of Raw Materials for Battery Manufacturing.
8. Can you provide examples of recent developments in the market?
March 2022: The ZEBRA (Zero Waste Blade Research) consortium is a new step in the wind energy industry's transition to a circular economy with the production of its 100% recyclable wind turbine prototype blade. The 62-meter blade was made using Arkema's Elium resin, a thermoplastic resin well known for its recyclable properties, and the new high-performance Glass Fabrics from Owens Corning.
9. What pricing options are available for accessing the report?
Pricing options include single-user, multi-user, and enterprise licenses priced at USD 4750, USD 5250, and USD 8750 respectively.
10. Is the market size provided in terms of value or volume?
The market size is provided in terms of value, measured in Million and volume, measured in K Units.
11. Are there any specific market keywords associated with the report?
Yes, the market keyword associated with the report is "Wind Turbine Rotor Blade Market," which aids in identifying and referencing the specific market segment covered.
12. How do I determine which pricing option suits my needs best?
The pricing options vary based on user requirements and access needs. Individual users may opt for single-user licenses, while businesses requiring broader access may choose multi-user or enterprise licenses for cost-effective access to the report.
13. Are there any additional resources or data provided in the Wind Turbine Rotor Blade Market report?
While the report offers comprehensive insights, it's advisable to review the specific contents or supplementary materials provided to ascertain if additional resources or data are available.
14. How can I stay updated on further developments or reports in the Wind Turbine Rotor Blade Market?
To stay informed about further developments, trends, and reports in the Wind Turbine Rotor Blade Market, consider subscribing to industry newsletters, following relevant companies and organizations, or regularly checking reputable industry news sources and publications.
Methodology
Step 1 - Identification of Relevant Samples Size from Population Database


Step 2 - Approaches for Defining Global Market Size (Value, Volume* & Price*)

Note*: In applicable scenarios
Step 3 - Data Sources
Primary Research
- Web Analytics
- Survey Reports
- Research Institute
- Latest Research Reports
- Opinion Leaders
Secondary Research
- Annual Reports
- White Paper
- Latest Press Release
- Industry Association
- Paid Database
- Investor Presentations

Step 4 - Data Triangulation
Involves using different sources of information in order to increase the validity of a study
These sources are likely to be stakeholders in a program - participants, other researchers, program staff, other community members, and so on.
Then we put all data in single framework & apply various statistical tools to find out the dynamic on the market.
During the analysis stage, feedback from the stakeholder groups would be compared to determine areas of agreement as well as areas of divergence


