
Key Insights
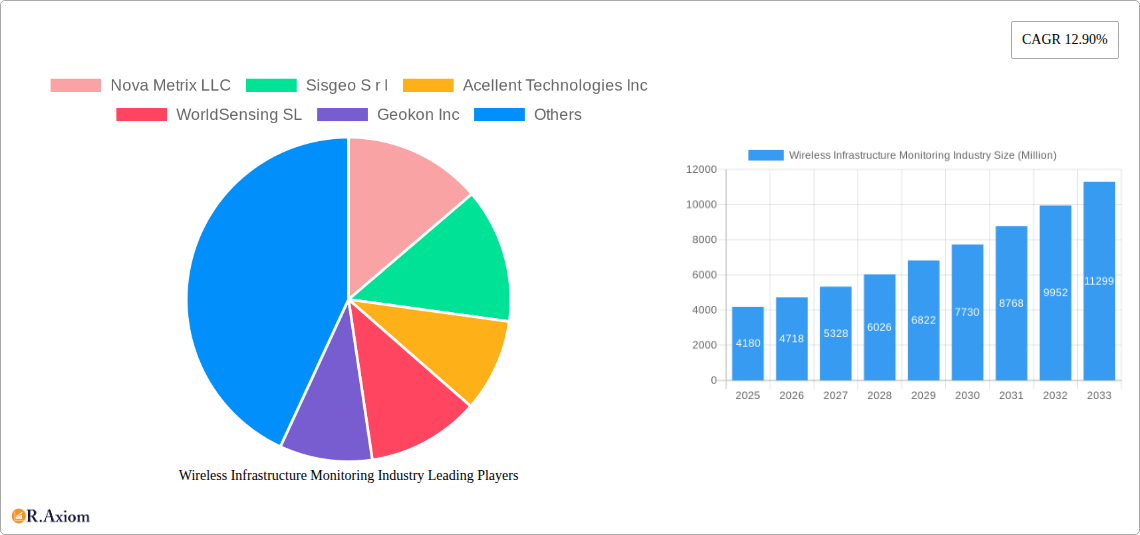
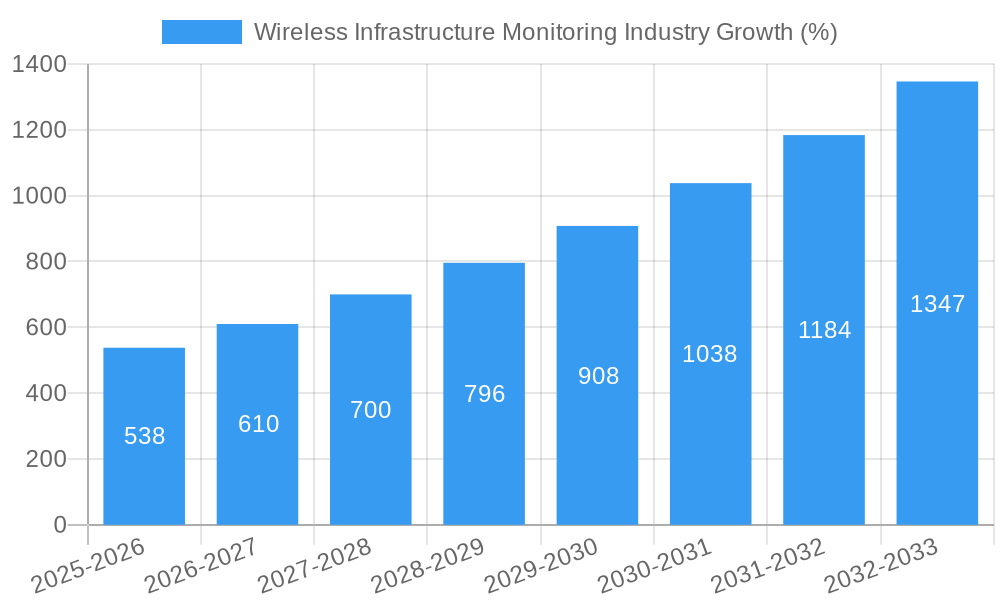
The wireless infrastructure monitoring market, valued at $4.18 billion in 2025, is experiencing robust growth, projected to expand at a Compound Annual Growth Rate (CAGR) of 12.90% from 2025 to 2033. This significant expansion is driven by several key factors. Increasing urbanization and the consequent need for robust and reliable infrastructure necessitate advanced monitoring systems to ensure safety, efficiency, and longevity. The rising adoption of smart cities initiatives further fuels market growth, as these projects heavily rely on real-time data acquired through wireless monitoring technologies. Furthermore, the growing awareness of potential risks associated with infrastructure failure, coupled with stringent government regulations promoting proactive maintenance, is accelerating market adoption. The diverse applications across civil infrastructure, oil and gas refineries, transportation, and mining sectors contribute significantly to market expansion. Advancements in sensor technology, providing more accurate and timely data, along with the development of sophisticated analytics platforms for data interpretation, are also significant drivers.
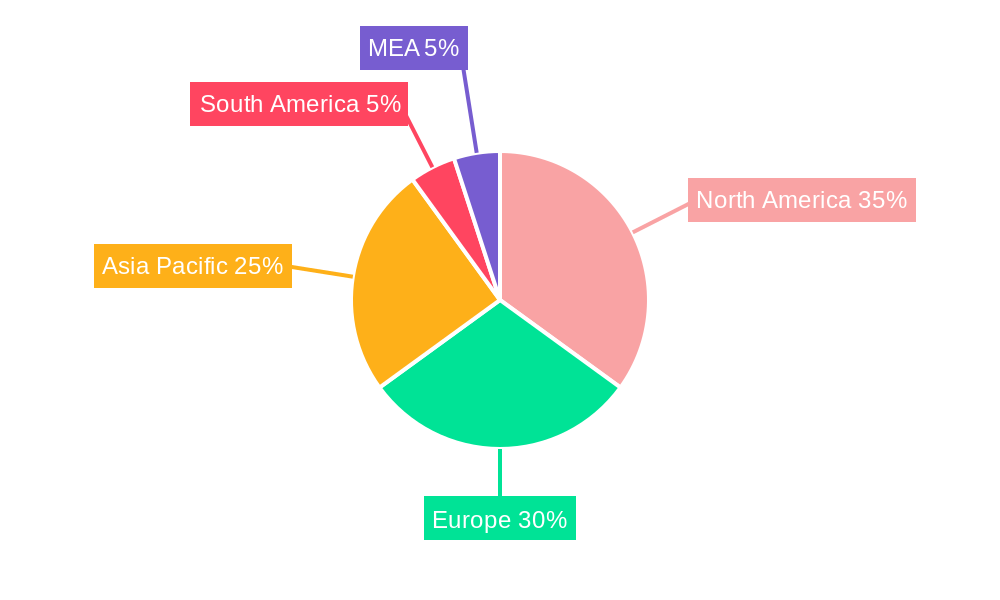
Market segmentation reveals a strong demand across various applications. Geotechnical monitoring, ensuring the stability of soil and underground structures, holds a substantial share, followed by structural monitoring for buildings and bridges. Environmental monitoring, addressing factors like pollution and climate change impacts on infrastructure, also contributes significantly. The hardware segment, encompassing sensors, data loggers, and communication devices, currently dominates the market, but the software and services segment, encompassing data analytics and remote monitoring platforms, is experiencing the fastest growth rate, reflecting the increasing need for data-driven insights and proactive maintenance strategies. Geographically, North America and Europe currently hold the largest market shares due to early adoption and advanced infrastructure, but the Asia-Pacific region is projected to witness the fastest growth in the coming years due to rapid infrastructure development and urbanization. Competitive forces are dynamic, with established players and emerging technology providers competing, fostering innovation and driving market expansion. This competitive landscape ensures continuous improvements in technology and cost efficiency, further enhancing the market's appeal.
Wireless Infrastructure Monitoring Industry: A Comprehensive Market Report (2019-2033)
This in-depth report provides a comprehensive analysis of the Wireless Infrastructure Monitoring industry, covering market size, growth projections, key segments, leading players, and emerging trends from 2019 to 2033. The report leverages extensive primary and secondary research to deliver actionable insights for industry stakeholders, investors, and businesses seeking to understand and capitalize on the opportunities within this dynamic market. The estimated market size in 2025 is valued at xx Million, with a projected CAGR of xx% during the forecast period (2025-2033).
Wireless Infrastructure Monitoring Industry Market Concentration & Innovation
The Wireless Infrastructure Monitoring market exhibits a moderately concentrated landscape, with several key players holding significant market share. Nova Metrix LLC, Sisgeo S.r.l, Acellent Technologies Inc., and WorldSensing SL are among the prominent companies shaping industry dynamics. Market share analysis reveals that the top 5 players collectively account for approximately xx% of the global market in 2025. Innovation is driven by advancements in sensor technology, IoT integration, and data analytics capabilities. Regulatory frameworks, particularly those concerning data security and environmental compliance, play a crucial role in shaping industry practices. Product substitutes, such as traditional wired monitoring systems, pose a competitive threat, albeit a diminishing one given the advantages of wireless solutions. End-user trends towards automation and real-time data accessibility are significant growth drivers. M&A activity has been relatively moderate in recent years, with deal values averaging approximately xx Million per transaction. Notable acquisitions include the acquisition of RST Instruments Ltd by Vance Street Capital. Further analysis reveals:
- Market Share Concentration: Top 5 players hold approximately xx% of the market.
- M&A Activity: Average deal value of xx Million, with a total of xx deals recorded between 2019 and 2024.
- Key Innovation Drivers: IoT integration, advanced sensor technology, AI-powered analytics.
- Regulatory Landscape: Compliance with data privacy regulations and environmental standards.
Wireless Infrastructure Monitoring Industry Industry Trends & Insights
The Wireless Infrastructure Monitoring industry is experiencing robust growth, fueled by several key trends. The increasing adoption of smart infrastructure initiatives globally is a primary growth driver, leading to greater demand for real-time monitoring solutions. Technological disruptions, such as the development of low-power wide-area networks (LPWAN) and advancements in cloud-based data management, are significantly improving the scalability and cost-effectiveness of wireless monitoring systems. Consumer preferences are shifting towards solutions that offer enhanced data visualization, predictive analytics, and seamless integration with existing infrastructure management platforms. Competitive dynamics are characterized by intense innovation, strategic partnerships, and a focus on providing comprehensive service offerings. Market penetration is highest in developed economies but is rapidly expanding in developing nations due to increasing infrastructure development projects. The market is projected to reach xx Million by 2033.
- CAGR (2025-2033): xx%
- Market Penetration (2025): xx% in developed economies; xx% in developing economies.
- Key Growth Drivers: Smart infrastructure development, technological advancements, increasing demand for real-time data.
- Competitive Dynamics: Focus on innovation, service offerings, and strategic alliances.
Dominant Markets & Segments in Wireless Infrastructure Monitoring Industry
The North American region currently holds the largest market share in the Wireless Infrastructure Monitoring industry, driven by significant investments in infrastructure modernization and strong adoption of advanced monitoring technologies. Within the segments:
- By Type: The hardware segment holds the largest market share, followed by software and services. Growth in software and services is expected to be faster.
- By Application: Geotechnical monitoring currently dominates, followed by structural and environmental monitoring. Other applications, including spatial monitoring and traffic flow monitoring, are showing significant growth potential.
- By End-user Industry: The civil infrastructure sector is the primary end-user, followed by transportation and oil and gas. Mining and other industries are also contributing significantly to market growth.
Key Drivers:
- Civil Infrastructure: Government investments in infrastructure development and maintenance.
- Transportation: Growing demand for efficient and safe transportation systems.
- Oil & Refineries: Need for enhanced safety and operational efficiency.
The dominance of North America is attributed to robust infrastructure spending and early adoption of wireless technologies. Europe and Asia-Pacific are also key markets, experiencing rapid growth due to increasing urbanization and industrialization.
Wireless Infrastructure Monitoring Industry Product Developments
Recent product innovations focus on miniaturization, enhanced sensor capabilities, improved data security features, and the integration of AI and machine learning for predictive analytics. The development of long-range, low-power wireless communication technologies is expanding the range and applicability of monitoring systems. These advancements are providing competitive advantages by offering more efficient, reliable, and cost-effective solutions to infrastructure monitoring challenges. The key focus is on delivering comprehensive, user-friendly solutions.
Report Scope & Segmentation Analysis
This report provides a detailed segmentation analysis across various parameters:
By Type: Hardware (sensors, data loggers, communication modules), Software (data acquisition, analysis, visualization), Services (installation, maintenance, support). The hardware segment is projected to grow at xx% CAGR while software and services will grow at xx% and xx% CAGR respectively.
By Application: Geotechnical Monitoring (slope stability, ground deformation), Structural Monitoring (bridges, buildings, dams), Environmental Monitoring (water quality, air pollution), Other Applications (spatial monitoring, traffic flow monitoring). Geotechnical monitoring is expected to maintain its dominant position.
By End-user Industry: Civil Infrastructure, Oil & Refineries, Transportation, Mining, Others. The Civil infrastructure segment is expected to have the largest market share.
Key Drivers of Wireless Infrastructure Monitoring Industry Growth
Several factors contribute to the industry's growth: increasing government investments in infrastructure development, the rising adoption of smart city initiatives, the need for enhanced safety and operational efficiency across various industries, and advancements in sensor and communication technologies enabling real-time data acquisition and analysis. The growing demand for predictive maintenance and the need to minimize downtime also fuel market growth.
Challenges in the Wireless Infrastructure Monitoring Industry Sector
Challenges include the high initial investment costs associated with deploying wireless monitoring systems, concerns about data security and cyber threats, the need for reliable power sources in remote locations, and the potential for interference from other wireless networks. Competition from established players and the emergence of new technologies also present significant challenges. The cost of maintenance and potential regulatory hurdles further impact market growth.
Emerging Opportunities in Wireless Infrastructure Monitoring Industry
Emerging opportunities include the integration of wireless monitoring systems with other IoT devices, the development of more energy-efficient sensors, and the application of advanced analytics techniques for predictive maintenance. Expanding into new markets, like smart agriculture and environmental monitoring, presents further opportunities. The adoption of 5G and other advanced communication technologies will further drive market expansion.
Leading Players in the Wireless Infrastructure Monitoring Industry Market
- Nova Metrix LLC
- Sisgeo S.r.l
- Acellent Technologies Inc.
- WorldSensing SL
- Geokon Inc
- COWI A/S
- RST Instruments Ltd (Vance Street Capital)
- Ackcio Pte Ltd
- Geocomp Corporation
- Campbell Scientific Inc
Key Developments in Wireless Infrastructure Monitoring Industry Industry
- 2022 Q4: Nova Metrix LLC launched a new generation of sensors with enhanced data accuracy.
- 2023 Q1: Acellent Technologies Inc. partnered with a major telecommunications company to expand its market reach.
- 2023 Q2: WorldSensing SL secured a significant contract for a large-scale infrastructure monitoring project.
- (Further developments can be added as needed)
Strategic Outlook for Wireless Infrastructure Monitoring Industry Market
The Wireless Infrastructure Monitoring market is poised for continued growth, driven by technological advancements, increasing infrastructure spending, and growing demand for real-time data and predictive analytics. The focus on developing energy-efficient, secure, and easily deployable solutions will be crucial for success. Expanding into new applications and markets, leveraging strategic partnerships, and investing in R&D will be key strategic initiatives for market players. The market is expected to witness significant growth in the coming years, driven by the confluence of technological advancements and the rising need for improved infrastructure management across diverse sectors.
Wireless Infrastructure Monitoring Industry Segmentation
-
1. Type
- 1.1. Hardware
- 1.2. Software and Services
-
2. Application
- 2.1. Geotechnical Monitoring
- 2.2. Structural Monitoring
- 2.3. Environmental Monitoring
- 2.4. Other Ap
-
3. End-user Industry
- 3.1. Civil Infrastructure
- 3.2. Oil and Refineries
- 3.3. Transportation
- 3.4. Mining
- 3.5. Others
Wireless Infrastructure Monitoring Industry Segmentation By Geography
- 1. North America
- 2. Europe
- 3. Asia Pacific
- 4. Rest of the World
Wireless Infrastructure Monitoring Industry REPORT HIGHLIGHTS
| Aspects | Details |
|---|---|
| Study Period | 2019-2033 |
| Base Year | 2024 |
| Estimated Year | 2025 |
| Forecast Period | 2025-2033 |
| Historical Period | 2019-2024 |
| Growth Rate | CAGR of 12.90% from 2019-2033 |
| Segmentation |
|
Table of Contents
- 1. Introduction
- 1.1. Research Scope
- 1.2. Market Segmentation
- 1.3. Research Methodology
- 1.4. Definitions and Assumptions
- 2. Executive Summary
- 2.1. Introduction
- 3. Market Dynamics
- 3.1. Introduction
- 3.2. Market Drivers
- 3.2.1. ; Stringent Government Regulations Pertaining to Sustainability of Structures; Cost-effective and Flexible Nature for Information Acquisition and Improving Maintenance Efficiency and Safety
- 3.3. Market Restrains
- 3.3.1. Lack of Good Infrastructure for the Efficient Functioning of Irrigation Automation Systems; High Costs Associated with the Installation and Lack of Technical Knowledge
- 3.4. Market Trends
- 3.4.1. Structural Monitoring Segment is Expected To Grow Significantly
- 4. Market Factor Analysis
- 4.1. Porters Five Forces
- 4.2. Supply/Value Chain
- 4.3. PESTEL analysis
- 4.4. Market Entropy
- 4.5. Patent/Trademark Analysis
- 5. Global Wireless Infrastructure Monitoring Industry Analysis, Insights and Forecast, 2019-2031
- 5.1. Market Analysis, Insights and Forecast - by Type
- 5.1.1. Hardware
- 5.1.2. Software and Services
- 5.2. Market Analysis, Insights and Forecast - by Application
- 5.2.1. Geotechnical Monitoring
- 5.2.2. Structural Monitoring
- 5.2.3. Environmental Monitoring
- 5.2.4. Other Ap
- 5.3. Market Analysis, Insights and Forecast - by End-user Industry
- 5.3.1. Civil Infrastructure
- 5.3.2. Oil and Refineries
- 5.3.3. Transportation
- 5.3.4. Mining
- 5.3.5. Others
- 5.4. Market Analysis, Insights and Forecast - by Region
- 5.4.1. North America
- 5.4.2. Europe
- 5.4.3. Asia Pacific
- 5.4.4. Rest of the World
- 5.1. Market Analysis, Insights and Forecast - by Type
- 6. North America Wireless Infrastructure Monitoring Industry Analysis, Insights and Forecast, 2019-2031
- 6.1. Market Analysis, Insights and Forecast - by Type
- 6.1.1. Hardware
- 6.1.2. Software and Services
- 6.2. Market Analysis, Insights and Forecast - by Application
- 6.2.1. Geotechnical Monitoring
- 6.2.2. Structural Monitoring
- 6.2.3. Environmental Monitoring
- 6.2.4. Other Ap
- 6.3. Market Analysis, Insights and Forecast - by End-user Industry
- 6.3.1. Civil Infrastructure
- 6.3.2. Oil and Refineries
- 6.3.3. Transportation
- 6.3.4. Mining
- 6.3.5. Others
- 6.1. Market Analysis, Insights and Forecast - by Type
- 7. Europe Wireless Infrastructure Monitoring Industry Analysis, Insights and Forecast, 2019-2031
- 7.1. Market Analysis, Insights and Forecast - by Type
- 7.1.1. Hardware
- 7.1.2. Software and Services
- 7.2. Market Analysis, Insights and Forecast - by Application
- 7.2.1. Geotechnical Monitoring
- 7.2.2. Structural Monitoring
- 7.2.3. Environmental Monitoring
- 7.2.4. Other Ap
- 7.3. Market Analysis, Insights and Forecast - by End-user Industry
- 7.3.1. Civil Infrastructure
- 7.3.2. Oil and Refineries
- 7.3.3. Transportation
- 7.3.4. Mining
- 7.3.5. Others
- 7.1. Market Analysis, Insights and Forecast - by Type
- 8. Asia Pacific Wireless Infrastructure Monitoring Industry Analysis, Insights and Forecast, 2019-2031
- 8.1. Market Analysis, Insights and Forecast - by Type
- 8.1.1. Hardware
- 8.1.2. Software and Services
- 8.2. Market Analysis, Insights and Forecast - by Application
- 8.2.1. Geotechnical Monitoring
- 8.2.2. Structural Monitoring
- 8.2.3. Environmental Monitoring
- 8.2.4. Other Ap
- 8.3. Market Analysis, Insights and Forecast - by End-user Industry
- 8.3.1. Civil Infrastructure
- 8.3.2. Oil and Refineries
- 8.3.3. Transportation
- 8.3.4. Mining
- 8.3.5. Others
- 8.1. Market Analysis, Insights and Forecast - by Type
- 9. Rest of the World Wireless Infrastructure Monitoring Industry Analysis, Insights and Forecast, 2019-2031
- 9.1. Market Analysis, Insights and Forecast - by Type
- 9.1.1. Hardware
- 9.1.2. Software and Services
- 9.2. Market Analysis, Insights and Forecast - by Application
- 9.2.1. Geotechnical Monitoring
- 9.2.2. Structural Monitoring
- 9.2.3. Environmental Monitoring
- 9.2.4. Other Ap
- 9.3. Market Analysis, Insights and Forecast - by End-user Industry
- 9.3.1. Civil Infrastructure
- 9.3.2. Oil and Refineries
- 9.3.3. Transportation
- 9.3.4. Mining
- 9.3.5. Others
- 9.1. Market Analysis, Insights and Forecast - by Type
- 10. North America Wireless Infrastructure Monitoring Industry Analysis, Insights and Forecast, 2019-2031
- 10.1. Market Analysis, Insights and Forecast - By Country/Sub-region
- 10.1.1 United States
- 10.1.2 Canada
- 10.1.3 Mexico
- 11. Europe Wireless Infrastructure Monitoring Industry Analysis, Insights and Forecast, 2019-2031
- 11.1. Market Analysis, Insights and Forecast - By Country/Sub-region
- 11.1.1 Germany
- 11.1.2 United Kingdom
- 11.1.3 France
- 11.1.4 Spain
- 11.1.5 Italy
- 11.1.6 Spain
- 11.1.7 Belgium
- 11.1.8 Netherland
- 11.1.9 Nordics
- 11.1.10 Rest of Europe
- 12. Asia Pacific Wireless Infrastructure Monitoring Industry Analysis, Insights and Forecast, 2019-2031
- 12.1. Market Analysis, Insights and Forecast - By Country/Sub-region
- 12.1.1 China
- 12.1.2 Japan
- 12.1.3 India
- 12.1.4 South Korea
- 12.1.5 Southeast Asia
- 12.1.6 Australia
- 12.1.7 Indonesia
- 12.1.8 Phillipes
- 12.1.9 Singapore
- 12.1.10 Thailandc
- 12.1.11 Rest of Asia Pacific
- 13. South America Wireless Infrastructure Monitoring Industry Analysis, Insights and Forecast, 2019-2031
- 13.1. Market Analysis, Insights and Forecast - By Country/Sub-region
- 13.1.1 Brazil
- 13.1.2 Argentina
- 13.1.3 Peru
- 13.1.4 Chile
- 13.1.5 Colombia
- 13.1.6 Ecuador
- 13.1.7 Venezuela
- 13.1.8 Rest of South America
- 14. North America Wireless Infrastructure Monitoring Industry Analysis, Insights and Forecast, 2019-2031
- 14.1. Market Analysis, Insights and Forecast - By Country/Sub-region
- 14.1.1 United States
- 14.1.2 Canada
- 14.1.3 Mexico
- 15. MEA Wireless Infrastructure Monitoring Industry Analysis, Insights and Forecast, 2019-2031
- 15.1. Market Analysis, Insights and Forecast - By Country/Sub-region
- 15.1.1 United Arab Emirates
- 15.1.2 Saudi Arabia
- 15.1.3 South Africa
- 15.1.4 Rest of Middle East and Africa
- 16. Competitive Analysis
- 16.1. Global Market Share Analysis 2024
- 16.2. Company Profiles
- 16.2.1 Nova Metrix LLC
- 16.2.1.1. Overview
- 16.2.1.2. Products
- 16.2.1.3. SWOT Analysis
- 16.2.1.4. Recent Developments
- 16.2.1.5. Financials (Based on Availability)
- 16.2.2 Sisgeo S r l
- 16.2.2.1. Overview
- 16.2.2.2. Products
- 16.2.2.3. SWOT Analysis
- 16.2.2.4. Recent Developments
- 16.2.2.5. Financials (Based on Availability)
- 16.2.3 Acellent Technologies Inc
- 16.2.3.1. Overview
- 16.2.3.2. Products
- 16.2.3.3. SWOT Analysis
- 16.2.3.4. Recent Developments
- 16.2.3.5. Financials (Based on Availability)
- 16.2.4 WorldSensing SL
- 16.2.4.1. Overview
- 16.2.4.2. Products
- 16.2.4.3. SWOT Analysis
- 16.2.4.4. Recent Developments
- 16.2.4.5. Financials (Based on Availability)
- 16.2.5 Geokon Inc
- 16.2.5.1. Overview
- 16.2.5.2. Products
- 16.2.5.3. SWOT Analysis
- 16.2.5.4. Recent Developments
- 16.2.5.5. Financials (Based on Availability)
- 16.2.6 COWI A/S
- 16.2.6.1. Overview
- 16.2.6.2. Products
- 16.2.6.3. SWOT Analysis
- 16.2.6.4. Recent Developments
- 16.2.6.5. Financials (Based on Availability)
- 16.2.7 RST Instruments Ltd (Vance Street Capital)
- 16.2.7.1. Overview
- 16.2.7.2. Products
- 16.2.7.3. SWOT Analysis
- 16.2.7.4. Recent Developments
- 16.2.7.5. Financials (Based on Availability)
- 16.2.8 Ackcio Pte Ltd
- 16.2.8.1. Overview
- 16.2.8.2. Products
- 16.2.8.3. SWOT Analysis
- 16.2.8.4. Recent Developments
- 16.2.8.5. Financials (Based on Availability)
- 16.2.9 Geocomp Corporation
- 16.2.9.1. Overview
- 16.2.9.2. Products
- 16.2.9.3. SWOT Analysis
- 16.2.9.4. Recent Developments
- 16.2.9.5. Financials (Based on Availability)
- 16.2.10 Campbell Scientific Inc
- 16.2.10.1. Overview
- 16.2.10.2. Products
- 16.2.10.3. SWOT Analysis
- 16.2.10.4. Recent Developments
- 16.2.10.5. Financials (Based on Availability)
- 16.2.1 Nova Metrix LLC
List of Figures
- Figure 1: Global Wireless Infrastructure Monitoring Industry Revenue Breakdown (Million, %) by Region 2024 & 2032
- Figure 2: Global Wireless Infrastructure Monitoring Industry Volume Breakdown (K Unit, %) by Region 2024 & 2032
- Figure 3: North America Wireless Infrastructure Monitoring Industry Revenue (Million), by Country 2024 & 2032
- Figure 4: North America Wireless Infrastructure Monitoring Industry Volume (K Unit), by Country 2024 & 2032
- Figure 5: North America Wireless Infrastructure Monitoring Industry Revenue Share (%), by Country 2024 & 2032
- Figure 6: North America Wireless Infrastructure Monitoring Industry Volume Share (%), by Country 2024 & 2032
- Figure 7: Europe Wireless Infrastructure Monitoring Industry Revenue (Million), by Country 2024 & 2032
- Figure 8: Europe Wireless Infrastructure Monitoring Industry Volume (K Unit), by Country 2024 & 2032
- Figure 9: Europe Wireless Infrastructure Monitoring Industry Revenue Share (%), by Country 2024 & 2032
- Figure 10: Europe Wireless Infrastructure Monitoring Industry Volume Share (%), by Country 2024 & 2032
- Figure 11: Asia Pacific Wireless Infrastructure Monitoring Industry Revenue (Million), by Country 2024 & 2032
- Figure 12: Asia Pacific Wireless Infrastructure Monitoring Industry Volume (K Unit), by Country 2024 & 2032
- Figure 13: Asia Pacific Wireless Infrastructure Monitoring Industry Revenue Share (%), by Country 2024 & 2032
- Figure 14: Asia Pacific Wireless Infrastructure Monitoring Industry Volume Share (%), by Country 2024 & 2032
- Figure 15: South America Wireless Infrastructure Monitoring Industry Revenue (Million), by Country 2024 & 2032
- Figure 16: South America Wireless Infrastructure Monitoring Industry Volume (K Unit), by Country 2024 & 2032
- Figure 17: South America Wireless Infrastructure Monitoring Industry Revenue Share (%), by Country 2024 & 2032
- Figure 18: South America Wireless Infrastructure Monitoring Industry Volume Share (%), by Country 2024 & 2032
- Figure 19: North America Wireless Infrastructure Monitoring Industry Revenue (Million), by Country 2024 & 2032
- Figure 20: North America Wireless Infrastructure Monitoring Industry Volume (K Unit), by Country 2024 & 2032
- Figure 21: North America Wireless Infrastructure Monitoring Industry Revenue Share (%), by Country 2024 & 2032
- Figure 22: North America Wireless Infrastructure Monitoring Industry Volume Share (%), by Country 2024 & 2032
- Figure 23: MEA Wireless Infrastructure Monitoring Industry Revenue (Million), by Country 2024 & 2032
- Figure 24: MEA Wireless Infrastructure Monitoring Industry Volume (K Unit), by Country 2024 & 2032
- Figure 25: MEA Wireless Infrastructure Monitoring Industry Revenue Share (%), by Country 2024 & 2032
- Figure 26: MEA Wireless Infrastructure Monitoring Industry Volume Share (%), by Country 2024 & 2032
- Figure 27: North America Wireless Infrastructure Monitoring Industry Revenue (Million), by Type 2024 & 2032
- Figure 28: North America Wireless Infrastructure Monitoring Industry Volume (K Unit), by Type 2024 & 2032
- Figure 29: North America Wireless Infrastructure Monitoring Industry Revenue Share (%), by Type 2024 & 2032
- Figure 30: North America Wireless Infrastructure Monitoring Industry Volume Share (%), by Type 2024 & 2032
- Figure 31: North America Wireless Infrastructure Monitoring Industry Revenue (Million), by Application 2024 & 2032
- Figure 32: North America Wireless Infrastructure Monitoring Industry Volume (K Unit), by Application 2024 & 2032
- Figure 33: North America Wireless Infrastructure Monitoring Industry Revenue Share (%), by Application 2024 & 2032
- Figure 34: North America Wireless Infrastructure Monitoring Industry Volume Share (%), by Application 2024 & 2032
- Figure 35: North America Wireless Infrastructure Monitoring Industry Revenue (Million), by End-user Industry 2024 & 2032
- Figure 36: North America Wireless Infrastructure Monitoring Industry Volume (K Unit), by End-user Industry 2024 & 2032
- Figure 37: North America Wireless Infrastructure Monitoring Industry Revenue Share (%), by End-user Industry 2024 & 2032
- Figure 38: North America Wireless Infrastructure Monitoring Industry Volume Share (%), by End-user Industry 2024 & 2032
- Figure 39: North America Wireless Infrastructure Monitoring Industry Revenue (Million), by Country 2024 & 2032
- Figure 40: North America Wireless Infrastructure Monitoring Industry Volume (K Unit), by Country 2024 & 2032
- Figure 41: North America Wireless Infrastructure Monitoring Industry Revenue Share (%), by Country 2024 & 2032
- Figure 42: North America Wireless Infrastructure Monitoring Industry Volume Share (%), by Country 2024 & 2032
- Figure 43: Europe Wireless Infrastructure Monitoring Industry Revenue (Million), by Type 2024 & 2032
- Figure 44: Europe Wireless Infrastructure Monitoring Industry Volume (K Unit), by Type 2024 & 2032
- Figure 45: Europe Wireless Infrastructure Monitoring Industry Revenue Share (%), by Type 2024 & 2032
- Figure 46: Europe Wireless Infrastructure Monitoring Industry Volume Share (%), by Type 2024 & 2032
- Figure 47: Europe Wireless Infrastructure Monitoring Industry Revenue (Million), by Application 2024 & 2032
- Figure 48: Europe Wireless Infrastructure Monitoring Industry Volume (K Unit), by Application 2024 & 2032
- Figure 49: Europe Wireless Infrastructure Monitoring Industry Revenue Share (%), by Application 2024 & 2032
- Figure 50: Europe Wireless Infrastructure Monitoring Industry Volume Share (%), by Application 2024 & 2032
- Figure 51: Europe Wireless Infrastructure Monitoring Industry Revenue (Million), by End-user Industry 2024 & 2032
- Figure 52: Europe Wireless Infrastructure Monitoring Industry Volume (K Unit), by End-user Industry 2024 & 2032
- Figure 53: Europe Wireless Infrastructure Monitoring Industry Revenue Share (%), by End-user Industry 2024 & 2032
- Figure 54: Europe Wireless Infrastructure Monitoring Industry Volume Share (%), by End-user Industry 2024 & 2032
- Figure 55: Europe Wireless Infrastructure Monitoring Industry Revenue (Million), by Country 2024 & 2032
- Figure 56: Europe Wireless Infrastructure Monitoring Industry Volume (K Unit), by Country 2024 & 2032
- Figure 57: Europe Wireless Infrastructure Monitoring Industry Revenue Share (%), by Country 2024 & 2032
- Figure 58: Europe Wireless Infrastructure Monitoring Industry Volume Share (%), by Country 2024 & 2032
- Figure 59: Asia Pacific Wireless Infrastructure Monitoring Industry Revenue (Million), by Type 2024 & 2032
- Figure 60: Asia Pacific Wireless Infrastructure Monitoring Industry Volume (K Unit), by Type 2024 & 2032
- Figure 61: Asia Pacific Wireless Infrastructure Monitoring Industry Revenue Share (%), by Type 2024 & 2032
- Figure 62: Asia Pacific Wireless Infrastructure Monitoring Industry Volume Share (%), by Type 2024 & 2032
- Figure 63: Asia Pacific Wireless Infrastructure Monitoring Industry Revenue (Million), by Application 2024 & 2032
- Figure 64: Asia Pacific Wireless Infrastructure Monitoring Industry Volume (K Unit), by Application 2024 & 2032
- Figure 65: Asia Pacific Wireless Infrastructure Monitoring Industry Revenue Share (%), by Application 2024 & 2032
- Figure 66: Asia Pacific Wireless Infrastructure Monitoring Industry Volume Share (%), by Application 2024 & 2032
- Figure 67: Asia Pacific Wireless Infrastructure Monitoring Industry Revenue (Million), by End-user Industry 2024 & 2032
- Figure 68: Asia Pacific Wireless Infrastructure Monitoring Industry Volume (K Unit), by End-user Industry 2024 & 2032
- Figure 69: Asia Pacific Wireless Infrastructure Monitoring Industry Revenue Share (%), by End-user Industry 2024 & 2032
- Figure 70: Asia Pacific Wireless Infrastructure Monitoring Industry Volume Share (%), by End-user Industry 2024 & 2032
- Figure 71: Asia Pacific Wireless Infrastructure Monitoring Industry Revenue (Million), by Country 2024 & 2032
- Figure 72: Asia Pacific Wireless Infrastructure Monitoring Industry Volume (K Unit), by Country 2024 & 2032
- Figure 73: Asia Pacific Wireless Infrastructure Monitoring Industry Revenue Share (%), by Country 2024 & 2032
- Figure 74: Asia Pacific Wireless Infrastructure Monitoring Industry Volume Share (%), by Country 2024 & 2032
- Figure 75: Rest of the World Wireless Infrastructure Monitoring Industry Revenue (Million), by Type 2024 & 2032
- Figure 76: Rest of the World Wireless Infrastructure Monitoring Industry Volume (K Unit), by Type 2024 & 2032
- Figure 77: Rest of the World Wireless Infrastructure Monitoring Industry Revenue Share (%), by Type 2024 & 2032
- Figure 78: Rest of the World Wireless Infrastructure Monitoring Industry Volume Share (%), by Type 2024 & 2032
- Figure 79: Rest of the World Wireless Infrastructure Monitoring Industry Revenue (Million), by Application 2024 & 2032
- Figure 80: Rest of the World Wireless Infrastructure Monitoring Industry Volume (K Unit), by Application 2024 & 2032
- Figure 81: Rest of the World Wireless Infrastructure Monitoring Industry Revenue Share (%), by Application 2024 & 2032
- Figure 82: Rest of the World Wireless Infrastructure Monitoring Industry Volume Share (%), by Application 2024 & 2032
- Figure 83: Rest of the World Wireless Infrastructure Monitoring Industry Revenue (Million), by End-user Industry 2024 & 2032
- Figure 84: Rest of the World Wireless Infrastructure Monitoring Industry Volume (K Unit), by End-user Industry 2024 & 2032
- Figure 85: Rest of the World Wireless Infrastructure Monitoring Industry Revenue Share (%), by End-user Industry 2024 & 2032
- Figure 86: Rest of the World Wireless Infrastructure Monitoring Industry Volume Share (%), by End-user Industry 2024 & 2032
- Figure 87: Rest of the World Wireless Infrastructure Monitoring Industry Revenue (Million), by Country 2024 & 2032
- Figure 88: Rest of the World Wireless Infrastructure Monitoring Industry Volume (K Unit), by Country 2024 & 2032
- Figure 89: Rest of the World Wireless Infrastructure Monitoring Industry Revenue Share (%), by Country 2024 & 2032
- Figure 90: Rest of the World Wireless Infrastructure Monitoring Industry Volume Share (%), by Country 2024 & 2032
List of Tables
- Table 1: Global Wireless Infrastructure Monitoring Industry Revenue Million Forecast, by Region 2019 & 2032
- Table 2: Global Wireless Infrastructure Monitoring Industry Volume K Unit Forecast, by Region 2019 & 2032
- Table 3: Global Wireless Infrastructure Monitoring Industry Revenue Million Forecast, by Type 2019 & 2032
- Table 4: Global Wireless Infrastructure Monitoring Industry Volume K Unit Forecast, by Type 2019 & 2032
- Table 5: Global Wireless Infrastructure Monitoring Industry Revenue Million Forecast, by Application 2019 & 2032
- Table 6: Global Wireless Infrastructure Monitoring Industry Volume K Unit Forecast, by Application 2019 & 2032
- Table 7: Global Wireless Infrastructure Monitoring Industry Revenue Million Forecast, by End-user Industry 2019 & 2032
- Table 8: Global Wireless Infrastructure Monitoring Industry Volume K Unit Forecast, by End-user Industry 2019 & 2032
- Table 9: Global Wireless Infrastructure Monitoring Industry Revenue Million Forecast, by Region 2019 & 2032
- Table 10: Global Wireless Infrastructure Monitoring Industry Volume K Unit Forecast, by Region 2019 & 2032
- Table 11: Global Wireless Infrastructure Monitoring Industry Revenue Million Forecast, by Country 2019 & 2032
- Table 12: Global Wireless Infrastructure Monitoring Industry Volume K Unit Forecast, by Country 2019 & 2032
- Table 13: United States Wireless Infrastructure Monitoring Industry Revenue (Million) Forecast, by Application 2019 & 2032
- Table 14: United States Wireless Infrastructure Monitoring Industry Volume (K Unit) Forecast, by Application 2019 & 2032
- Table 15: Canada Wireless Infrastructure Monitoring Industry Revenue (Million) Forecast, by Application 2019 & 2032
- Table 16: Canada Wireless Infrastructure Monitoring Industry Volume (K Unit) Forecast, by Application 2019 & 2032
- Table 17: Mexico Wireless Infrastructure Monitoring Industry Revenue (Million) Forecast, by Application 2019 & 2032
- Table 18: Mexico Wireless Infrastructure Monitoring Industry Volume (K Unit) Forecast, by Application 2019 & 2032
- Table 19: Global Wireless Infrastructure Monitoring Industry Revenue Million Forecast, by Country 2019 & 2032
- Table 20: Global Wireless Infrastructure Monitoring Industry Volume K Unit Forecast, by Country 2019 & 2032
- Table 21: Germany Wireless Infrastructure Monitoring Industry Revenue (Million) Forecast, by Application 2019 & 2032
- Table 22: Germany Wireless Infrastructure Monitoring Industry Volume (K Unit) Forecast, by Application 2019 & 2032
- Table 23: United Kingdom Wireless Infrastructure Monitoring Industry Revenue (Million) Forecast, by Application 2019 & 2032
- Table 24: United Kingdom Wireless Infrastructure Monitoring Industry Volume (K Unit) Forecast, by Application 2019 & 2032
- Table 25: France Wireless Infrastructure Monitoring Industry Revenue (Million) Forecast, by Application 2019 & 2032
- Table 26: France Wireless Infrastructure Monitoring Industry Volume (K Unit) Forecast, by Application 2019 & 2032
- Table 27: Spain Wireless Infrastructure Monitoring Industry Revenue (Million) Forecast, by Application 2019 & 2032
- Table 28: Spain Wireless Infrastructure Monitoring Industry Volume (K Unit) Forecast, by Application 2019 & 2032
- Table 29: Italy Wireless Infrastructure Monitoring Industry Revenue (Million) Forecast, by Application 2019 & 2032
- Table 30: Italy Wireless Infrastructure Monitoring Industry Volume (K Unit) Forecast, by Application 2019 & 2032
- Table 31: Spain Wireless Infrastructure Monitoring Industry Revenue (Million) Forecast, by Application 2019 & 2032
- Table 32: Spain Wireless Infrastructure Monitoring Industry Volume (K Unit) Forecast, by Application 2019 & 2032
- Table 33: Belgium Wireless Infrastructure Monitoring Industry Revenue (Million) Forecast, by Application 2019 & 2032
- Table 34: Belgium Wireless Infrastructure Monitoring Industry Volume (K Unit) Forecast, by Application 2019 & 2032
- Table 35: Netherland Wireless Infrastructure Monitoring Industry Revenue (Million) Forecast, by Application 2019 & 2032
- Table 36: Netherland Wireless Infrastructure Monitoring Industry Volume (K Unit) Forecast, by Application 2019 & 2032
- Table 37: Nordics Wireless Infrastructure Monitoring Industry Revenue (Million) Forecast, by Application 2019 & 2032
- Table 38: Nordics Wireless Infrastructure Monitoring Industry Volume (K Unit) Forecast, by Application 2019 & 2032
- Table 39: Rest of Europe Wireless Infrastructure Monitoring Industry Revenue (Million) Forecast, by Application 2019 & 2032
- Table 40: Rest of Europe Wireless Infrastructure Monitoring Industry Volume (K Unit) Forecast, by Application 2019 & 2032
- Table 41: Global Wireless Infrastructure Monitoring Industry Revenue Million Forecast, by Country 2019 & 2032
- Table 42: Global Wireless Infrastructure Monitoring Industry Volume K Unit Forecast, by Country 2019 & 2032
- Table 43: China Wireless Infrastructure Monitoring Industry Revenue (Million) Forecast, by Application 2019 & 2032
- Table 44: China Wireless Infrastructure Monitoring Industry Volume (K Unit) Forecast, by Application 2019 & 2032
- Table 45: Japan Wireless Infrastructure Monitoring Industry Revenue (Million) Forecast, by Application 2019 & 2032
- Table 46: Japan Wireless Infrastructure Monitoring Industry Volume (K Unit) Forecast, by Application 2019 & 2032
- Table 47: India Wireless Infrastructure Monitoring Industry Revenue (Million) Forecast, by Application 2019 & 2032
- Table 48: India Wireless Infrastructure Monitoring Industry Volume (K Unit) Forecast, by Application 2019 & 2032
- Table 49: South Korea Wireless Infrastructure Monitoring Industry Revenue (Million) Forecast, by Application 2019 & 2032
- Table 50: South Korea Wireless Infrastructure Monitoring Industry Volume (K Unit) Forecast, by Application 2019 & 2032
- Table 51: Southeast Asia Wireless Infrastructure Monitoring Industry Revenue (Million) Forecast, by Application 2019 & 2032
- Table 52: Southeast Asia Wireless Infrastructure Monitoring Industry Volume (K Unit) Forecast, by Application 2019 & 2032
- Table 53: Australia Wireless Infrastructure Monitoring Industry Revenue (Million) Forecast, by Application 2019 & 2032
- Table 54: Australia Wireless Infrastructure Monitoring Industry Volume (K Unit) Forecast, by Application 2019 & 2032
- Table 55: Indonesia Wireless Infrastructure Monitoring Industry Revenue (Million) Forecast, by Application 2019 & 2032
- Table 56: Indonesia Wireless Infrastructure Monitoring Industry Volume (K Unit) Forecast, by Application 2019 & 2032
- Table 57: Phillipes Wireless Infrastructure Monitoring Industry Revenue (Million) Forecast, by Application 2019 & 2032
- Table 58: Phillipes Wireless Infrastructure Monitoring Industry Volume (K Unit) Forecast, by Application 2019 & 2032
- Table 59: Singapore Wireless Infrastructure Monitoring Industry Revenue (Million) Forecast, by Application 2019 & 2032
- Table 60: Singapore Wireless Infrastructure Monitoring Industry Volume (K Unit) Forecast, by Application 2019 & 2032
- Table 61: Thailandc Wireless Infrastructure Monitoring Industry Revenue (Million) Forecast, by Application 2019 & 2032
- Table 62: Thailandc Wireless Infrastructure Monitoring Industry Volume (K Unit) Forecast, by Application 2019 & 2032
- Table 63: Rest of Asia Pacific Wireless Infrastructure Monitoring Industry Revenue (Million) Forecast, by Application 2019 & 2032
- Table 64: Rest of Asia Pacific Wireless Infrastructure Monitoring Industry Volume (K Unit) Forecast, by Application 2019 & 2032
- Table 65: Global Wireless Infrastructure Monitoring Industry Revenue Million Forecast, by Country 2019 & 2032
- Table 66: Global Wireless Infrastructure Monitoring Industry Volume K Unit Forecast, by Country 2019 & 2032
- Table 67: Brazil Wireless Infrastructure Monitoring Industry Revenue (Million) Forecast, by Application 2019 & 2032
- Table 68: Brazil Wireless Infrastructure Monitoring Industry Volume (K Unit) Forecast, by Application 2019 & 2032
- Table 69: Argentina Wireless Infrastructure Monitoring Industry Revenue (Million) Forecast, by Application 2019 & 2032
- Table 70: Argentina Wireless Infrastructure Monitoring Industry Volume (K Unit) Forecast, by Application 2019 & 2032
- Table 71: Peru Wireless Infrastructure Monitoring Industry Revenue (Million) Forecast, by Application 2019 & 2032
- Table 72: Peru Wireless Infrastructure Monitoring Industry Volume (K Unit) Forecast, by Application 2019 & 2032
- Table 73: Chile Wireless Infrastructure Monitoring Industry Revenue (Million) Forecast, by Application 2019 & 2032
- Table 74: Chile Wireless Infrastructure Monitoring Industry Volume (K Unit) Forecast, by Application 2019 & 2032
- Table 75: Colombia Wireless Infrastructure Monitoring Industry Revenue (Million) Forecast, by Application 2019 & 2032
- Table 76: Colombia Wireless Infrastructure Monitoring Industry Volume (K Unit) Forecast, by Application 2019 & 2032
- Table 77: Ecuador Wireless Infrastructure Monitoring Industry Revenue (Million) Forecast, by Application 2019 & 2032
- Table 78: Ecuador Wireless Infrastructure Monitoring Industry Volume (K Unit) Forecast, by Application 2019 & 2032
- Table 79: Venezuela Wireless Infrastructure Monitoring Industry Revenue (Million) Forecast, by Application 2019 & 2032
- Table 80: Venezuela Wireless Infrastructure Monitoring Industry Volume (K Unit) Forecast, by Application 2019 & 2032
- Table 81: Rest of South America Wireless Infrastructure Monitoring Industry Revenue (Million) Forecast, by Application 2019 & 2032
- Table 82: Rest of South America Wireless Infrastructure Monitoring Industry Volume (K Unit) Forecast, by Application 2019 & 2032
- Table 83: Global Wireless Infrastructure Monitoring Industry Revenue Million Forecast, by Country 2019 & 2032
- Table 84: Global Wireless Infrastructure Monitoring Industry Volume K Unit Forecast, by Country 2019 & 2032
- Table 85: United States Wireless Infrastructure Monitoring Industry Revenue (Million) Forecast, by Application 2019 & 2032
- Table 86: United States Wireless Infrastructure Monitoring Industry Volume (K Unit) Forecast, by Application 2019 & 2032
- Table 87: Canada Wireless Infrastructure Monitoring Industry Revenue (Million) Forecast, by Application 2019 & 2032
- Table 88: Canada Wireless Infrastructure Monitoring Industry Volume (K Unit) Forecast, by Application 2019 & 2032
- Table 89: Mexico Wireless Infrastructure Monitoring Industry Revenue (Million) Forecast, by Application 2019 & 2032
- Table 90: Mexico Wireless Infrastructure Monitoring Industry Volume (K Unit) Forecast, by Application 2019 & 2032
- Table 91: Global Wireless Infrastructure Monitoring Industry Revenue Million Forecast, by Country 2019 & 2032
- Table 92: Global Wireless Infrastructure Monitoring Industry Volume K Unit Forecast, by Country 2019 & 2032
- Table 93: United Arab Emirates Wireless Infrastructure Monitoring Industry Revenue (Million) Forecast, by Application 2019 & 2032
- Table 94: United Arab Emirates Wireless Infrastructure Monitoring Industry Volume (K Unit) Forecast, by Application 2019 & 2032
- Table 95: Saudi Arabia Wireless Infrastructure Monitoring Industry Revenue (Million) Forecast, by Application 2019 & 2032
- Table 96: Saudi Arabia Wireless Infrastructure Monitoring Industry Volume (K Unit) Forecast, by Application 2019 & 2032
- Table 97: South Africa Wireless Infrastructure Monitoring Industry Revenue (Million) Forecast, by Application 2019 & 2032
- Table 98: South Africa Wireless Infrastructure Monitoring Industry Volume (K Unit) Forecast, by Application 2019 & 2032
- Table 99: Rest of Middle East and Africa Wireless Infrastructure Monitoring Industry Revenue (Million) Forecast, by Application 2019 & 2032
- Table 100: Rest of Middle East and Africa Wireless Infrastructure Monitoring Industry Volume (K Unit) Forecast, by Application 2019 & 2032
- Table 101: Global Wireless Infrastructure Monitoring Industry Revenue Million Forecast, by Type 2019 & 2032
- Table 102: Global Wireless Infrastructure Monitoring Industry Volume K Unit Forecast, by Type 2019 & 2032
- Table 103: Global Wireless Infrastructure Monitoring Industry Revenue Million Forecast, by Application 2019 & 2032
- Table 104: Global Wireless Infrastructure Monitoring Industry Volume K Unit Forecast, by Application 2019 & 2032
- Table 105: Global Wireless Infrastructure Monitoring Industry Revenue Million Forecast, by End-user Industry 2019 & 2032
- Table 106: Global Wireless Infrastructure Monitoring Industry Volume K Unit Forecast, by End-user Industry 2019 & 2032
- Table 107: Global Wireless Infrastructure Monitoring Industry Revenue Million Forecast, by Country 2019 & 2032
- Table 108: Global Wireless Infrastructure Monitoring Industry Volume K Unit Forecast, by Country 2019 & 2032
- Table 109: Global Wireless Infrastructure Monitoring Industry Revenue Million Forecast, by Type 2019 & 2032
- Table 110: Global Wireless Infrastructure Monitoring Industry Volume K Unit Forecast, by Type 2019 & 2032
- Table 111: Global Wireless Infrastructure Monitoring Industry Revenue Million Forecast, by Application 2019 & 2032
- Table 112: Global Wireless Infrastructure Monitoring Industry Volume K Unit Forecast, by Application 2019 & 2032
- Table 113: Global Wireless Infrastructure Monitoring Industry Revenue Million Forecast, by End-user Industry 2019 & 2032
- Table 114: Global Wireless Infrastructure Monitoring Industry Volume K Unit Forecast, by End-user Industry 2019 & 2032
- Table 115: Global Wireless Infrastructure Monitoring Industry Revenue Million Forecast, by Country 2019 & 2032
- Table 116: Global Wireless Infrastructure Monitoring Industry Volume K Unit Forecast, by Country 2019 & 2032
- Table 117: Global Wireless Infrastructure Monitoring Industry Revenue Million Forecast, by Type 2019 & 2032
- Table 118: Global Wireless Infrastructure Monitoring Industry Volume K Unit Forecast, by Type 2019 & 2032
- Table 119: Global Wireless Infrastructure Monitoring Industry Revenue Million Forecast, by Application 2019 & 2032
- Table 120: Global Wireless Infrastructure Monitoring Industry Volume K Unit Forecast, by Application 2019 & 2032
- Table 121: Global Wireless Infrastructure Monitoring Industry Revenue Million Forecast, by End-user Industry 2019 & 2032
- Table 122: Global Wireless Infrastructure Monitoring Industry Volume K Unit Forecast, by End-user Industry 2019 & 2032
- Table 123: Global Wireless Infrastructure Monitoring Industry Revenue Million Forecast, by Country 2019 & 2032
- Table 124: Global Wireless Infrastructure Monitoring Industry Volume K Unit Forecast, by Country 2019 & 2032
- Table 125: Global Wireless Infrastructure Monitoring Industry Revenue Million Forecast, by Type 2019 & 2032
- Table 126: Global Wireless Infrastructure Monitoring Industry Volume K Unit Forecast, by Type 2019 & 2032
- Table 127: Global Wireless Infrastructure Monitoring Industry Revenue Million Forecast, by Application 2019 & 2032
- Table 128: Global Wireless Infrastructure Monitoring Industry Volume K Unit Forecast, by Application 2019 & 2032
- Table 129: Global Wireless Infrastructure Monitoring Industry Revenue Million Forecast, by End-user Industry 2019 & 2032
- Table 130: Global Wireless Infrastructure Monitoring Industry Volume K Unit Forecast, by End-user Industry 2019 & 2032
- Table 131: Global Wireless Infrastructure Monitoring Industry Revenue Million Forecast, by Country 2019 & 2032
- Table 132: Global Wireless Infrastructure Monitoring Industry Volume K Unit Forecast, by Country 2019 & 2032
Frequently Asked Questions
1. What is the projected Compound Annual Growth Rate (CAGR) of the Wireless Infrastructure Monitoring Industry?
The projected CAGR is approximately 12.90%.
2. Which companies are prominent players in the Wireless Infrastructure Monitoring Industry?
Key companies in the market include Nova Metrix LLC, Sisgeo S r l, Acellent Technologies Inc, WorldSensing SL, Geokon Inc, COWI A/S, RST Instruments Ltd (Vance Street Capital), Ackcio Pte Ltd, Geocomp Corporation, Campbell Scientific Inc.
3. What are the main segments of the Wireless Infrastructure Monitoring Industry?
The market segments include Type, Application, End-user Industry.
4. Can you provide details about the market size?
The market size is estimated to be USD 4.18 Million as of 2022.
5. What are some drivers contributing to market growth?
; Stringent Government Regulations Pertaining to Sustainability of Structures; Cost-effective and Flexible Nature for Information Acquisition and Improving Maintenance Efficiency and Safety.
6. What are the notable trends driving market growth?
Structural Monitoring Segment is Expected To Grow Significantly.
7. Are there any restraints impacting market growth?
Lack of Good Infrastructure for the Efficient Functioning of Irrigation Automation Systems; High Costs Associated with the Installation and Lack of Technical Knowledge.
8. Can you provide examples of recent developments in the market?
N/A
9. What pricing options are available for accessing the report?
Pricing options include single-user, multi-user, and enterprise licenses priced at USD 4750, USD 5250, and USD 8750 respectively.
10. Is the market size provided in terms of value or volume?
The market size is provided in terms of value, measured in Million and volume, measured in K Unit.
11. Are there any specific market keywords associated with the report?
Yes, the market keyword associated with the report is "Wireless Infrastructure Monitoring Industry," which aids in identifying and referencing the specific market segment covered.
12. How do I determine which pricing option suits my needs best?
The pricing options vary based on user requirements and access needs. Individual users may opt for single-user licenses, while businesses requiring broader access may choose multi-user or enterprise licenses for cost-effective access to the report.
13. Are there any additional resources or data provided in the Wireless Infrastructure Monitoring Industry report?
While the report offers comprehensive insights, it's advisable to review the specific contents or supplementary materials provided to ascertain if additional resources or data are available.
14. How can I stay updated on further developments or reports in the Wireless Infrastructure Monitoring Industry?
To stay informed about further developments, trends, and reports in the Wireless Infrastructure Monitoring Industry, consider subscribing to industry newsletters, following relevant companies and organizations, or regularly checking reputable industry news sources and publications.
Methodology
Step 1 - Identification of Relevant Samples Size from Population Database


Step 2 - Approaches for Defining Global Market Size (Value, Volume* & Price*)

Note*: In applicable scenarios
Step 3 - Data Sources
Primary Research
- Web Analytics
- Survey Reports
- Research Institute
- Latest Research Reports
- Opinion Leaders
Secondary Research
- Annual Reports
- White Paper
- Latest Press Release
- Industry Association
- Paid Database
- Investor Presentations

Step 4 - Data Triangulation
Involves using different sources of information in order to increase the validity of a study
These sources are likely to be stakeholders in a program - participants, other researchers, program staff, other community members, and so on.
Then we put all data in single framework & apply various statistical tools to find out the dynamic on the market.
During the analysis stage, feedback from the stakeholder groups would be compared to determine areas of agreement as well as areas of divergence


