
Key Insights
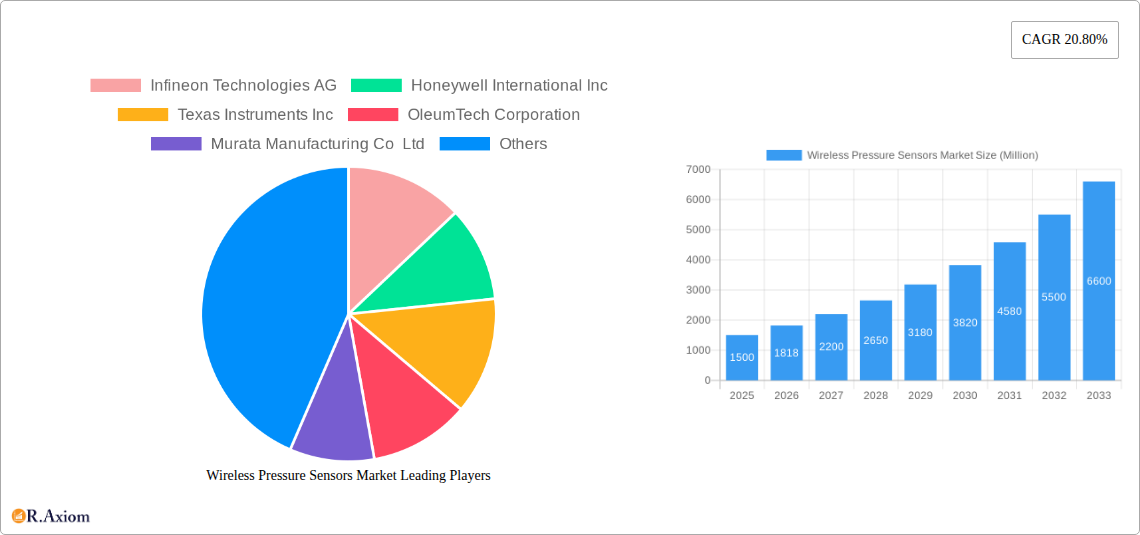
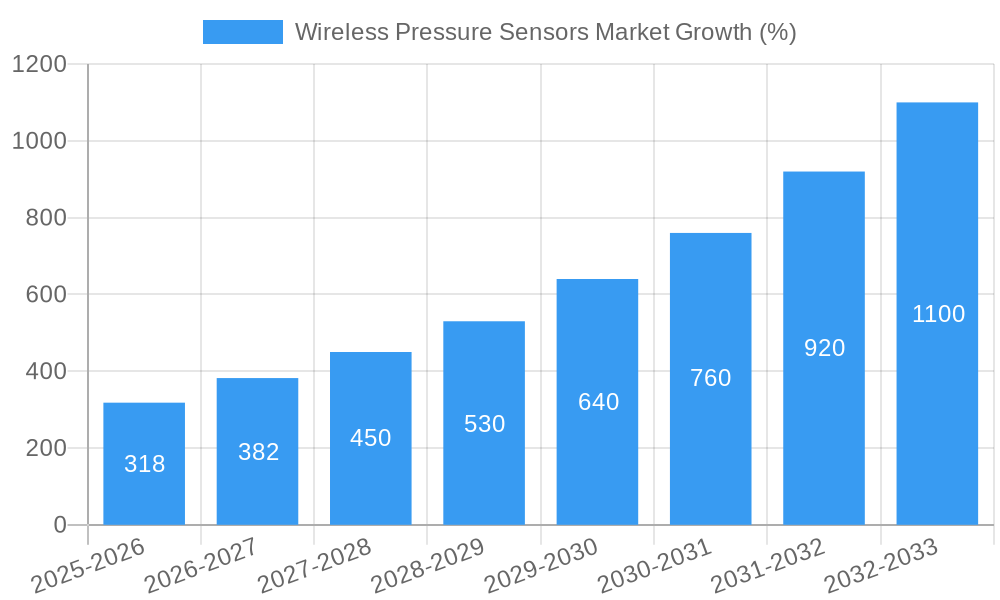
The wireless pressure sensor market is experiencing robust growth, driven by the increasing demand for automation, remote monitoring, and improved operational efficiency across diverse sectors. The market's 20.80% CAGR indicates a significant expansion, projected to reach substantial value by 2033. Key drivers include the rising adoption of Industry 4.0 and IoT technologies, particularly in sectors like oil & gas, automotive, and healthcare. The demand for real-time data acquisition and predictive maintenance solutions fuels this growth. Furthermore, advancements in sensor technology, such as the development of smaller, more energy-efficient, and higher-accuracy sensors (e.g., CMOS and capacitive sensors), are expanding applications and driving market expansion. Miniaturization facilitates integration into compact devices for diverse applications.
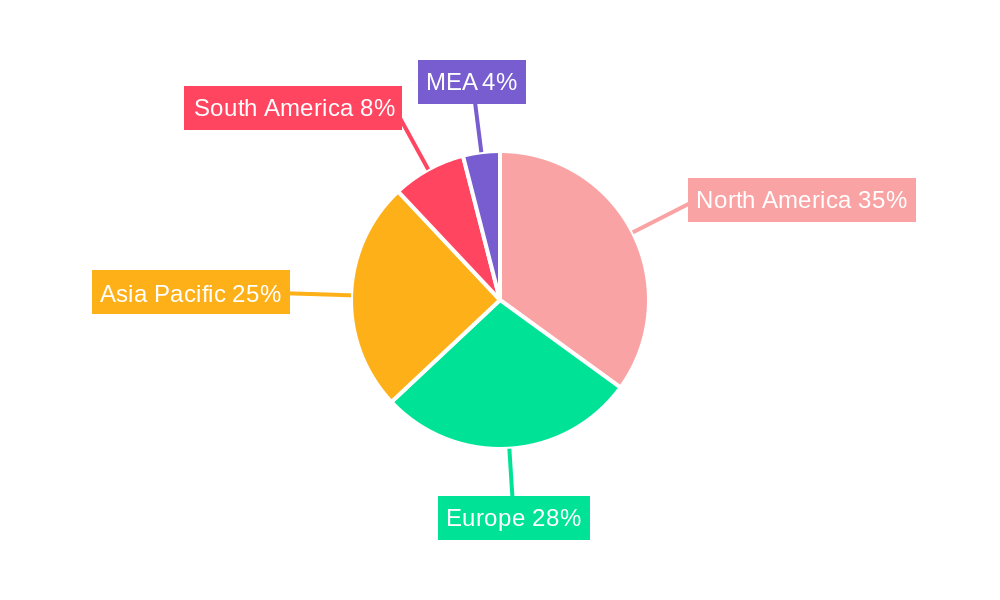
However, challenges such as the high initial investment costs associated with implementing wireless sensor networks and concerns regarding data security and reliability act as restraints. The market is segmented by technology (Piezoresistive, CMOS, Capacitive, Optical Sensing, Piezoelectric, Other Technologies) and end-user industry (Oil & Gas, Automotive, Healthcare, Consumer Electronics, IT and Telecom, Power & Energy, Entertainment & Media, Other End-user Industries). North America and Asia Pacific are currently leading market regions, driven by significant investments in technological advancements and infrastructure development. The competitive landscape is characterized by established players such as Infineon Technologies AG, Honeywell International Inc., and Texas Instruments Inc., alongside emerging companies specializing in niche applications. Ongoing research and development in sensor technologies, alongside the growing need for precise pressure measurement in various applications, point toward sustained market growth throughout the forecast period.
Wireless Pressure Sensors Market: A Comprehensive Report (2019-2033)
This in-depth report provides a comprehensive analysis of the Wireless Pressure Sensors market, covering market size, growth projections, competitive landscape, technological advancements, and key industry trends from 2019 to 2033. The study period spans 2019-2033, with 2025 serving as the base and estimated year. The forecast period covers 2025-2033, and the historical period is 2019-2024. This report is essential for industry stakeholders, investors, and market entrants seeking actionable insights to navigate this dynamic market.
Wireless Pressure Sensors Market Concentration & Innovation
This section analyzes the competitive landscape of the Wireless Pressure Sensors market, focusing on market concentration, innovation drivers, regulatory frameworks, product substitutes, end-user trends, and mergers and acquisitions (M&A) activities. The market is characterized by a moderately concentrated structure with key players such as Infineon Technologies AG, Honeywell International Inc, and Texas Instruments Inc holding significant market share. However, the presence of several smaller, specialized players introduces competitive dynamism.
- Market Concentration: The market concentration ratio (CR4) for the top four players is estimated at xx% in 2025, indicating a moderately concentrated market.
- Innovation Drivers: Miniaturization, enhanced accuracy, improved power efficiency, and the integration of advanced communication protocols are key innovation drivers. The increasing demand for wireless connectivity in various applications fuels innovation in sensor design and functionality.
- Regulatory Frameworks: Compliance with industry standards and regulations related to safety, reliability, and data security is crucial for market participants. Stringent regulatory frameworks in sectors like healthcare and automotive drive the adoption of certified and validated wireless pressure sensors.
- Product Substitutes: While wireless pressure sensors offer significant advantages over wired alternatives, certain applications might still utilize wired sensors due to concerns about reliability or power limitations. This pressure from substitutes is expected to moderate at xx% in the forecast period.
- End-User Trends: The growing demand for real-time monitoring and automation in various industries, such as Oil & Gas and Healthcare, is a major driver of market growth. The preference for wireless solutions is fueled by their ease of installation, reduced maintenance, and improved operational efficiency.
- M&A Activities: The market has witnessed several M&A activities in recent years, with deal values totaling approximately $xx Million in 2024. These activities aim to expand product portfolios, enhance technological capabilities, and consolidate market share.
Wireless Pressure Sensors Market Industry Trends & Insights
The Wireless Pressure Sensors market is experiencing robust growth, driven by several factors. The market is projected to witness a Compound Annual Growth Rate (CAGR) of xx% during the forecast period (2025-2033). This growth is fueled by the increasing adoption of wireless technologies across various industries, coupled with advancements in sensor technology and the rising demand for remote monitoring and automation solutions. Technological disruptions, including the development of miniaturized sensors with improved accuracy and power efficiency, are further contributing to market expansion. Consumer preferences are shifting toward wireless solutions due to their ease of use, flexibility, and cost-effectiveness. Competitive dynamics are marked by innovation, strategic partnerships, and ongoing efforts to enhance product features and performance. Market penetration is projected to reach xx% by 2033, driven by the increasing adoption in various end-use segments, particularly in automotive and industrial applications.
Dominant Markets & Segments in Wireless Pressure Sensors Market
The North American region currently dominates the Wireless Pressure Sensors market, driven by strong demand from the automotive, healthcare, and industrial sectors. This dominance is expected to continue through the forecast period, although growth in other regions, particularly Asia-Pacific, is also anticipated to be significant.
Key Drivers for Regional Dominance:
- North America: Strong technological advancements, robust infrastructure, high adoption of advanced technologies, and substantial investments in R&D.
- Europe: Stringent environmental regulations driving the adoption of efficient monitoring systems.
- Asia-Pacific: Rapid industrialization, rising disposable incomes, and growing investments in infrastructure projects.
Segment Dominance:
- Technology: Piezoresistive technology holds the largest market share, owing to its cost-effectiveness and mature technology. CMOS technology is gaining traction due to its potential for miniaturization and integration with other functionalities.
- End-user Industry: The automotive industry is a key driver of market growth, followed by healthcare and Oil & Gas. The rising demand for advanced driver-assistance systems (ADAS) and telematics solutions in the automotive sector is driving demand for wireless pressure sensors. In healthcare, the growth is driven by remote patient monitoring and the increasing adoption of minimally invasive surgical procedures.
Wireless Pressure Sensors Market Product Developments
Recent product innovations have focused on enhancing accuracy, miniaturization, power efficiency, and integration capabilities. New wireless pressure sensors incorporate advanced communication protocols, such as Bluetooth Low Energy (BLE) and Wi-Fi, enabling seamless integration with various monitoring systems. This has created competitive advantages for manufacturers by offering superior performance, reliability, and ease of use. These developments align with ongoing trends toward smaller, more efficient, and more versatile sensor solutions.
Report Scope & Segmentation Analysis
This report segments the Wireless Pressure Sensors market based on technology (Piezoresistive, CMOS, Capacitive, Optical Sensing, Piezoelectric, Other Technologies) and end-user industry (Oil & Gas, Automotive, Healthcare, Consumer Electronics, IT and Telecom, Power & Energy, Entertainment & Media, Other End-user Industries). Each segment's growth projections, market size, and competitive dynamics are analyzed in detail, providing a comprehensive understanding of market opportunities and challenges. For instance, the Piezoresistive technology segment is projected to maintain its dominance, with a market size of $xx Million in 2025, driven by cost-effectiveness. The Automotive end-user industry segment is expected to witness the highest growth rate, driven by the increasing adoption of ADAS and connected car technologies.
Key Drivers of Wireless Pressure Sensors Market Growth
Several factors drive the growth of the Wireless Pressure Sensors market. These include the rising demand for remote monitoring and automation across various industries, advancements in sensor technology resulting in miniaturization and improved accuracy, and increasing adoption of wireless communication protocols for seamless data transmission. Government regulations promoting safety and efficiency in various sectors also contribute. The growth of the Internet of Things (IoT) and the need for real-time data collection in diverse applications further fuels market expansion.
Challenges in the Wireless Pressure Sensors Market Sector
The Wireless Pressure Sensors market faces challenges such as stringent regulatory compliance requirements for specific applications, potential supply chain disruptions affecting raw material availability and manufacturing costs, and intense competition among established and emerging players. These factors can impact market growth and profitability for individual companies. Furthermore, ensuring data security and addressing concerns related to power consumption and battery life remain critical challenges.
Emerging Opportunities in Wireless Pressure Sensors Market
Emerging opportunities exist in the expansion into new applications like smart agriculture, environmental monitoring, and wearable technology. Advancements in low-power wide-area networks (LPWAN) offer extended range and improved battery life, opening up new possibilities for remote monitoring in diverse environments. The development of highly integrated and intelligent sensors that incorporate data processing and analysis capabilities will also drive market expansion.
Leading Players in the Wireless Pressure Sensors Market Market
- Infineon Technologies AG
- Honeywell International Inc
- Texas Instruments Inc
- OleumTech Corporation
- Murata Manufacturing Co Ltd
- ESI Inc
- Siemens AG
- ABB Group
- TE Connectivity Ltd
- Acuity Incorporated
- Rockwell Automation Inc
- Phoenix Sensors LLC
- Analog Devices Inc
- Emerson Electric Company
Key Developments in Wireless Pressure Sensors Market Industry
- January 2023: Honeywell International Inc. launched a new line of wireless pressure sensors with enhanced accuracy and extended battery life.
- March 2024: Texas Instruments Inc. announced a strategic partnership with a leading sensor manufacturer to expand its product portfolio.
- (Add more recent developments with specific dates)
Strategic Outlook for Wireless Pressure Sensors Market Market
The Wireless Pressure Sensors market is poised for significant growth driven by technological advancements, increasing adoption across various industries, and the growing demand for remote monitoring and automation. The focus on miniaturization, enhanced accuracy, and improved power efficiency will continue to shape the market. Strategic partnerships and acquisitions will play a key role in shaping the competitive landscape. The market presents significant opportunities for companies that can leverage technological innovation to deliver high-performance, cost-effective, and reliable solutions.
Wireless Pressure Sensors Market Segmentation
-
1. Technology
- 1.1. Piezoresistive
- 1.2. CMOS
- 1.3. Capacitive
- 1.4. Optical Sensing
- 1.5. Piezoelectric
- 1.6. Other Technologies
-
2. End-user Industry
- 2.1. Oil & Gas
- 2.2. Automotive
- 2.3. Healthcare
- 2.4. Consumer Electronics
- 2.5. IT and Telecom
- 2.6. Power & Energy
- 2.7. Entertainment & Media
- 2.8. Other End-user Industries
Wireless Pressure Sensors Market Segmentation By Geography
-
1. North America
- 1.1. United States
- 1.2. Canada
-
2. Europe
- 2.1. Germany
- 2.2. United Kingdom
- 2.3. France
- 2.4. Rest of Europe
-
3. Asia Pacific
- 3.1. China
- 3.2. Japan
- 3.3. India
- 3.4. Rest of Asia Pacific
-
4. Rest of the World
- 4.1. Latin America
- 4.2. Middle East
Wireless Pressure Sensors Market REPORT HIGHLIGHTS
| Aspects | Details |
|---|---|
| Study Period | 2019-2033 |
| Base Year | 2024 |
| Estimated Year | 2025 |
| Forecast Period | 2025-2033 |
| Historical Period | 2019-2024 |
| Growth Rate | CAGR of 20.80% from 2019-2033 |
| Segmentation |
|
Table of Contents
- 1. Introduction
- 1.1. Research Scope
- 1.2. Market Segmentation
- 1.3. Research Methodology
- 1.4. Definitions and Assumptions
- 2. Executive Summary
- 2.1. Introduction
- 3. Market Dynamics
- 3.1. Introduction
- 3.2. Market Drivers
- 3.2.1. Growth in Automotive and Health Care Industries; Increasing Adoption of Wireless Systems Due to Industry 4.0
- 3.3. Market Restrains
- 3.3.1. High Cost Associated with Sensing Products; Low Product Differentiation
- 3.4. Market Trends
- 3.4.1. Wireless Pressure Sensors to Witness an Increased Demand from the Automotive Industry
- 4. Market Factor Analysis
- 4.1. Porters Five Forces
- 4.2. Supply/Value Chain
- 4.3. PESTEL analysis
- 4.4. Market Entropy
- 4.5. Patent/Trademark Analysis
- 5. Global Wireless Pressure Sensors Market Analysis, Insights and Forecast, 2019-2031
- 5.1. Market Analysis, Insights and Forecast - by Technology
- 5.1.1. Piezoresistive
- 5.1.2. CMOS
- 5.1.3. Capacitive
- 5.1.4. Optical Sensing
- 5.1.5. Piezoelectric
- 5.1.6. Other Technologies
- 5.2. Market Analysis, Insights and Forecast - by End-user Industry
- 5.2.1. Oil & Gas
- 5.2.2. Automotive
- 5.2.3. Healthcare
- 5.2.4. Consumer Electronics
- 5.2.5. IT and Telecom
- 5.2.6. Power & Energy
- 5.2.7. Entertainment & Media
- 5.2.8. Other End-user Industries
- 5.3. Market Analysis, Insights and Forecast - by Region
- 5.3.1. North America
- 5.3.2. Europe
- 5.3.3. Asia Pacific
- 5.3.4. Rest of the World
- 5.1. Market Analysis, Insights and Forecast - by Technology
- 6. North America Wireless Pressure Sensors Market Analysis, Insights and Forecast, 2019-2031
- 6.1. Market Analysis, Insights and Forecast - by Technology
- 6.1.1. Piezoresistive
- 6.1.2. CMOS
- 6.1.3. Capacitive
- 6.1.4. Optical Sensing
- 6.1.5. Piezoelectric
- 6.1.6. Other Technologies
- 6.2. Market Analysis, Insights and Forecast - by End-user Industry
- 6.2.1. Oil & Gas
- 6.2.2. Automotive
- 6.2.3. Healthcare
- 6.2.4. Consumer Electronics
- 6.2.5. IT and Telecom
- 6.2.6. Power & Energy
- 6.2.7. Entertainment & Media
- 6.2.8. Other End-user Industries
- 6.1. Market Analysis, Insights and Forecast - by Technology
- 7. Europe Wireless Pressure Sensors Market Analysis, Insights and Forecast, 2019-2031
- 7.1. Market Analysis, Insights and Forecast - by Technology
- 7.1.1. Piezoresistive
- 7.1.2. CMOS
- 7.1.3. Capacitive
- 7.1.4. Optical Sensing
- 7.1.5. Piezoelectric
- 7.1.6. Other Technologies
- 7.2. Market Analysis, Insights and Forecast - by End-user Industry
- 7.2.1. Oil & Gas
- 7.2.2. Automotive
- 7.2.3. Healthcare
- 7.2.4. Consumer Electronics
- 7.2.5. IT and Telecom
- 7.2.6. Power & Energy
- 7.2.7. Entertainment & Media
- 7.2.8. Other End-user Industries
- 7.1. Market Analysis, Insights and Forecast - by Technology
- 8. Asia Pacific Wireless Pressure Sensors Market Analysis, Insights and Forecast, 2019-2031
- 8.1. Market Analysis, Insights and Forecast - by Technology
- 8.1.1. Piezoresistive
- 8.1.2. CMOS
- 8.1.3. Capacitive
- 8.1.4. Optical Sensing
- 8.1.5. Piezoelectric
- 8.1.6. Other Technologies
- 8.2. Market Analysis, Insights and Forecast - by End-user Industry
- 8.2.1. Oil & Gas
- 8.2.2. Automotive
- 8.2.3. Healthcare
- 8.2.4. Consumer Electronics
- 8.2.5. IT and Telecom
- 8.2.6. Power & Energy
- 8.2.7. Entertainment & Media
- 8.2.8. Other End-user Industries
- 8.1. Market Analysis, Insights and Forecast - by Technology
- 9. Rest of the World Wireless Pressure Sensors Market Analysis, Insights and Forecast, 2019-2031
- 9.1. Market Analysis, Insights and Forecast - by Technology
- 9.1.1. Piezoresistive
- 9.1.2. CMOS
- 9.1.3. Capacitive
- 9.1.4. Optical Sensing
- 9.1.5. Piezoelectric
- 9.1.6. Other Technologies
- 9.2. Market Analysis, Insights and Forecast - by End-user Industry
- 9.2.1. Oil & Gas
- 9.2.2. Automotive
- 9.2.3. Healthcare
- 9.2.4. Consumer Electronics
- 9.2.5. IT and Telecom
- 9.2.6. Power & Energy
- 9.2.7. Entertainment & Media
- 9.2.8. Other End-user Industries
- 9.1. Market Analysis, Insights and Forecast - by Technology
- 10. North America Wireless Pressure Sensors Market Analysis, Insights and Forecast, 2019-2031
- 10.1. Market Analysis, Insights and Forecast - By Country/Sub-region
- 10.1.1 United States
- 10.1.2 Canada
- 10.1.3 Mexico
- 11. Europe Wireless Pressure Sensors Market Analysis, Insights and Forecast, 2019-2031
- 11.1. Market Analysis, Insights and Forecast - By Country/Sub-region
- 11.1.1 Germany
- 11.1.2 United Kingdom
- 11.1.3 France
- 11.1.4 Spain
- 11.1.5 Italy
- 11.1.6 Spain
- 11.1.7 Belgium
- 11.1.8 Netherland
- 11.1.9 Nordics
- 11.1.10 Rest of Europe
- 12. Asia Pacific Wireless Pressure Sensors Market Analysis, Insights and Forecast, 2019-2031
- 12.1. Market Analysis, Insights and Forecast - By Country/Sub-region
- 12.1.1 China
- 12.1.2 Japan
- 12.1.3 India
- 12.1.4 South Korea
- 12.1.5 Southeast Asia
- 12.1.6 Australia
- 12.1.7 Indonesia
- 12.1.8 Phillipes
- 12.1.9 Singapore
- 12.1.10 Thailandc
- 12.1.11 Rest of Asia Pacific
- 13. South America Wireless Pressure Sensors Market Analysis, Insights and Forecast, 2019-2031
- 13.1. Market Analysis, Insights and Forecast - By Country/Sub-region
- 13.1.1 Brazil
- 13.1.2 Argentina
- 13.1.3 Peru
- 13.1.4 Chile
- 13.1.5 Colombia
- 13.1.6 Ecuador
- 13.1.7 Venezuela
- 13.1.8 Rest of South America
- 14. MEA Wireless Pressure Sensors Market Analysis, Insights and Forecast, 2019-2031
- 14.1. Market Analysis, Insights and Forecast - By Country/Sub-region
- 14.1.1 United Arab Emirates
- 14.1.2 Saudi Arabia
- 14.1.3 South Africa
- 14.1.4 Rest of Middle East and Africa
- 15. Competitive Analysis
- 15.1. Global Market Share Analysis 2024
- 15.2. Company Profiles
- 15.2.1 Infineon Technologies AG
- 15.2.1.1. Overview
- 15.2.1.2. Products
- 15.2.1.3. SWOT Analysis
- 15.2.1.4. Recent Developments
- 15.2.1.5. Financials (Based on Availability)
- 15.2.2 Honeywell International Inc
- 15.2.2.1. Overview
- 15.2.2.2. Products
- 15.2.2.3. SWOT Analysis
- 15.2.2.4. Recent Developments
- 15.2.2.5. Financials (Based on Availability)
- 15.2.3 Texas Instruments Inc
- 15.2.3.1. Overview
- 15.2.3.2. Products
- 15.2.3.3. SWOT Analysis
- 15.2.3.4. Recent Developments
- 15.2.3.5. Financials (Based on Availability)
- 15.2.4 OleumTech Corporation
- 15.2.4.1. Overview
- 15.2.4.2. Products
- 15.2.4.3. SWOT Analysis
- 15.2.4.4. Recent Developments
- 15.2.4.5. Financials (Based on Availability)
- 15.2.5 Murata Manufacturing Co Ltd
- 15.2.5.1. Overview
- 15.2.5.2. Products
- 15.2.5.3. SWOT Analysis
- 15.2.5.4. Recent Developments
- 15.2.5.5. Financials (Based on Availability)
- 15.2.6 ESI Inc
- 15.2.6.1. Overview
- 15.2.6.2. Products
- 15.2.6.3. SWOT Analysis
- 15.2.6.4. Recent Developments
- 15.2.6.5. Financials (Based on Availability)
- 15.2.7 Siemens AG
- 15.2.7.1. Overview
- 15.2.7.2. Products
- 15.2.7.3. SWOT Analysis
- 15.2.7.4. Recent Developments
- 15.2.7.5. Financials (Based on Availability)
- 15.2.8 ABB Group
- 15.2.8.1. Overview
- 15.2.8.2. Products
- 15.2.8.3. SWOT Analysis
- 15.2.8.4. Recent Developments
- 15.2.8.5. Financials (Based on Availability)
- 15.2.9 TE Connectivity Ltd
- 15.2.9.1. Overview
- 15.2.9.2. Products
- 15.2.9.3. SWOT Analysis
- 15.2.9.4. Recent Developments
- 15.2.9.5. Financials (Based on Availability)
- 15.2.10 Acuity Incorporated
- 15.2.10.1. Overview
- 15.2.10.2. Products
- 15.2.10.3. SWOT Analysis
- 15.2.10.4. Recent Developments
- 15.2.10.5. Financials (Based on Availability)
- 15.2.11 Rockwell Automation Inc
- 15.2.11.1. Overview
- 15.2.11.2. Products
- 15.2.11.3. SWOT Analysis
- 15.2.11.4. Recent Developments
- 15.2.11.5. Financials (Based on Availability)
- 15.2.12 Phoenix Sensors LLC
- 15.2.12.1. Overview
- 15.2.12.2. Products
- 15.2.12.3. SWOT Analysis
- 15.2.12.4. Recent Developments
- 15.2.12.5. Financials (Based on Availability)
- 15.2.13 Analog Devices Inc
- 15.2.13.1. Overview
- 15.2.13.2. Products
- 15.2.13.3. SWOT Analysis
- 15.2.13.4. Recent Developments
- 15.2.13.5. Financials (Based on Availability)
- 15.2.14 Emerson Electric Company
- 15.2.14.1. Overview
- 15.2.14.2. Products
- 15.2.14.3. SWOT Analysis
- 15.2.14.4. Recent Developments
- 15.2.14.5. Financials (Based on Availability)
- 15.2.1 Infineon Technologies AG
List of Figures
- Figure 1: Global Wireless Pressure Sensors Market Revenue Breakdown (Million, %) by Region 2024 & 2032
- Figure 2: Global Wireless Pressure Sensors Market Volume Breakdown (K Units, %) by Region 2024 & 2032
- Figure 3: North America Wireless Pressure Sensors Market Revenue (Million), by Country 2024 & 2032
- Figure 4: North America Wireless Pressure Sensors Market Volume (K Units), by Country 2024 & 2032
- Figure 5: North America Wireless Pressure Sensors Market Revenue Share (%), by Country 2024 & 2032
- Figure 6: North America Wireless Pressure Sensors Market Volume Share (%), by Country 2024 & 2032
- Figure 7: Europe Wireless Pressure Sensors Market Revenue (Million), by Country 2024 & 2032
- Figure 8: Europe Wireless Pressure Sensors Market Volume (K Units), by Country 2024 & 2032
- Figure 9: Europe Wireless Pressure Sensors Market Revenue Share (%), by Country 2024 & 2032
- Figure 10: Europe Wireless Pressure Sensors Market Volume Share (%), by Country 2024 & 2032
- Figure 11: Asia Pacific Wireless Pressure Sensors Market Revenue (Million), by Country 2024 & 2032
- Figure 12: Asia Pacific Wireless Pressure Sensors Market Volume (K Units), by Country 2024 & 2032
- Figure 13: Asia Pacific Wireless Pressure Sensors Market Revenue Share (%), by Country 2024 & 2032
- Figure 14: Asia Pacific Wireless Pressure Sensors Market Volume Share (%), by Country 2024 & 2032
- Figure 15: South America Wireless Pressure Sensors Market Revenue (Million), by Country 2024 & 2032
- Figure 16: South America Wireless Pressure Sensors Market Volume (K Units), by Country 2024 & 2032
- Figure 17: South America Wireless Pressure Sensors Market Revenue Share (%), by Country 2024 & 2032
- Figure 18: South America Wireless Pressure Sensors Market Volume Share (%), by Country 2024 & 2032
- Figure 19: MEA Wireless Pressure Sensors Market Revenue (Million), by Country 2024 & 2032
- Figure 20: MEA Wireless Pressure Sensors Market Volume (K Units), by Country 2024 & 2032
- Figure 21: MEA Wireless Pressure Sensors Market Revenue Share (%), by Country 2024 & 2032
- Figure 22: MEA Wireless Pressure Sensors Market Volume Share (%), by Country 2024 & 2032
- Figure 23: North America Wireless Pressure Sensors Market Revenue (Million), by Technology 2024 & 2032
- Figure 24: North America Wireless Pressure Sensors Market Volume (K Units), by Technology 2024 & 2032
- Figure 25: North America Wireless Pressure Sensors Market Revenue Share (%), by Technology 2024 & 2032
- Figure 26: North America Wireless Pressure Sensors Market Volume Share (%), by Technology 2024 & 2032
- Figure 27: North America Wireless Pressure Sensors Market Revenue (Million), by End-user Industry 2024 & 2032
- Figure 28: North America Wireless Pressure Sensors Market Volume (K Units), by End-user Industry 2024 & 2032
- Figure 29: North America Wireless Pressure Sensors Market Revenue Share (%), by End-user Industry 2024 & 2032
- Figure 30: North America Wireless Pressure Sensors Market Volume Share (%), by End-user Industry 2024 & 2032
- Figure 31: North America Wireless Pressure Sensors Market Revenue (Million), by Country 2024 & 2032
- Figure 32: North America Wireless Pressure Sensors Market Volume (K Units), by Country 2024 & 2032
- Figure 33: North America Wireless Pressure Sensors Market Revenue Share (%), by Country 2024 & 2032
- Figure 34: North America Wireless Pressure Sensors Market Volume Share (%), by Country 2024 & 2032
- Figure 35: Europe Wireless Pressure Sensors Market Revenue (Million), by Technology 2024 & 2032
- Figure 36: Europe Wireless Pressure Sensors Market Volume (K Units), by Technology 2024 & 2032
- Figure 37: Europe Wireless Pressure Sensors Market Revenue Share (%), by Technology 2024 & 2032
- Figure 38: Europe Wireless Pressure Sensors Market Volume Share (%), by Technology 2024 & 2032
- Figure 39: Europe Wireless Pressure Sensors Market Revenue (Million), by End-user Industry 2024 & 2032
- Figure 40: Europe Wireless Pressure Sensors Market Volume (K Units), by End-user Industry 2024 & 2032
- Figure 41: Europe Wireless Pressure Sensors Market Revenue Share (%), by End-user Industry 2024 & 2032
- Figure 42: Europe Wireless Pressure Sensors Market Volume Share (%), by End-user Industry 2024 & 2032
- Figure 43: Europe Wireless Pressure Sensors Market Revenue (Million), by Country 2024 & 2032
- Figure 44: Europe Wireless Pressure Sensors Market Volume (K Units), by Country 2024 & 2032
- Figure 45: Europe Wireless Pressure Sensors Market Revenue Share (%), by Country 2024 & 2032
- Figure 46: Europe Wireless Pressure Sensors Market Volume Share (%), by Country 2024 & 2032
- Figure 47: Asia Pacific Wireless Pressure Sensors Market Revenue (Million), by Technology 2024 & 2032
- Figure 48: Asia Pacific Wireless Pressure Sensors Market Volume (K Units), by Technology 2024 & 2032
- Figure 49: Asia Pacific Wireless Pressure Sensors Market Revenue Share (%), by Technology 2024 & 2032
- Figure 50: Asia Pacific Wireless Pressure Sensors Market Volume Share (%), by Technology 2024 & 2032
- Figure 51: Asia Pacific Wireless Pressure Sensors Market Revenue (Million), by End-user Industry 2024 & 2032
- Figure 52: Asia Pacific Wireless Pressure Sensors Market Volume (K Units), by End-user Industry 2024 & 2032
- Figure 53: Asia Pacific Wireless Pressure Sensors Market Revenue Share (%), by End-user Industry 2024 & 2032
- Figure 54: Asia Pacific Wireless Pressure Sensors Market Volume Share (%), by End-user Industry 2024 & 2032
- Figure 55: Asia Pacific Wireless Pressure Sensors Market Revenue (Million), by Country 2024 & 2032
- Figure 56: Asia Pacific Wireless Pressure Sensors Market Volume (K Units), by Country 2024 & 2032
- Figure 57: Asia Pacific Wireless Pressure Sensors Market Revenue Share (%), by Country 2024 & 2032
- Figure 58: Asia Pacific Wireless Pressure Sensors Market Volume Share (%), by Country 2024 & 2032
- Figure 59: Rest of the World Wireless Pressure Sensors Market Revenue (Million), by Technology 2024 & 2032
- Figure 60: Rest of the World Wireless Pressure Sensors Market Volume (K Units), by Technology 2024 & 2032
- Figure 61: Rest of the World Wireless Pressure Sensors Market Revenue Share (%), by Technology 2024 & 2032
- Figure 62: Rest of the World Wireless Pressure Sensors Market Volume Share (%), by Technology 2024 & 2032
- Figure 63: Rest of the World Wireless Pressure Sensors Market Revenue (Million), by End-user Industry 2024 & 2032
- Figure 64: Rest of the World Wireless Pressure Sensors Market Volume (K Units), by End-user Industry 2024 & 2032
- Figure 65: Rest of the World Wireless Pressure Sensors Market Revenue Share (%), by End-user Industry 2024 & 2032
- Figure 66: Rest of the World Wireless Pressure Sensors Market Volume Share (%), by End-user Industry 2024 & 2032
- Figure 67: Rest of the World Wireless Pressure Sensors Market Revenue (Million), by Country 2024 & 2032
- Figure 68: Rest of the World Wireless Pressure Sensors Market Volume (K Units), by Country 2024 & 2032
- Figure 69: Rest of the World Wireless Pressure Sensors Market Revenue Share (%), by Country 2024 & 2032
- Figure 70: Rest of the World Wireless Pressure Sensors Market Volume Share (%), by Country 2024 & 2032
List of Tables
- Table 1: Global Wireless Pressure Sensors Market Revenue Million Forecast, by Region 2019 & 2032
- Table 2: Global Wireless Pressure Sensors Market Volume K Units Forecast, by Region 2019 & 2032
- Table 3: Global Wireless Pressure Sensors Market Revenue Million Forecast, by Technology 2019 & 2032
- Table 4: Global Wireless Pressure Sensors Market Volume K Units Forecast, by Technology 2019 & 2032
- Table 5: Global Wireless Pressure Sensors Market Revenue Million Forecast, by End-user Industry 2019 & 2032
- Table 6: Global Wireless Pressure Sensors Market Volume K Units Forecast, by End-user Industry 2019 & 2032
- Table 7: Global Wireless Pressure Sensors Market Revenue Million Forecast, by Region 2019 & 2032
- Table 8: Global Wireless Pressure Sensors Market Volume K Units Forecast, by Region 2019 & 2032
- Table 9: Global Wireless Pressure Sensors Market Revenue Million Forecast, by Country 2019 & 2032
- Table 10: Global Wireless Pressure Sensors Market Volume K Units Forecast, by Country 2019 & 2032
- Table 11: United States Wireless Pressure Sensors Market Revenue (Million) Forecast, by Application 2019 & 2032
- Table 12: United States Wireless Pressure Sensors Market Volume (K Units) Forecast, by Application 2019 & 2032
- Table 13: Canada Wireless Pressure Sensors Market Revenue (Million) Forecast, by Application 2019 & 2032
- Table 14: Canada Wireless Pressure Sensors Market Volume (K Units) Forecast, by Application 2019 & 2032
- Table 15: Mexico Wireless Pressure Sensors Market Revenue (Million) Forecast, by Application 2019 & 2032
- Table 16: Mexico Wireless Pressure Sensors Market Volume (K Units) Forecast, by Application 2019 & 2032
- Table 17: Global Wireless Pressure Sensors Market Revenue Million Forecast, by Country 2019 & 2032
- Table 18: Global Wireless Pressure Sensors Market Volume K Units Forecast, by Country 2019 & 2032
- Table 19: Germany Wireless Pressure Sensors Market Revenue (Million) Forecast, by Application 2019 & 2032
- Table 20: Germany Wireless Pressure Sensors Market Volume (K Units) Forecast, by Application 2019 & 2032
- Table 21: United Kingdom Wireless Pressure Sensors Market Revenue (Million) Forecast, by Application 2019 & 2032
- Table 22: United Kingdom Wireless Pressure Sensors Market Volume (K Units) Forecast, by Application 2019 & 2032
- Table 23: France Wireless Pressure Sensors Market Revenue (Million) Forecast, by Application 2019 & 2032
- Table 24: France Wireless Pressure Sensors Market Volume (K Units) Forecast, by Application 2019 & 2032
- Table 25: Spain Wireless Pressure Sensors Market Revenue (Million) Forecast, by Application 2019 & 2032
- Table 26: Spain Wireless Pressure Sensors Market Volume (K Units) Forecast, by Application 2019 & 2032
- Table 27: Italy Wireless Pressure Sensors Market Revenue (Million) Forecast, by Application 2019 & 2032
- Table 28: Italy Wireless Pressure Sensors Market Volume (K Units) Forecast, by Application 2019 & 2032
- Table 29: Spain Wireless Pressure Sensors Market Revenue (Million) Forecast, by Application 2019 & 2032
- Table 30: Spain Wireless Pressure Sensors Market Volume (K Units) Forecast, by Application 2019 & 2032
- Table 31: Belgium Wireless Pressure Sensors Market Revenue (Million) Forecast, by Application 2019 & 2032
- Table 32: Belgium Wireless Pressure Sensors Market Volume (K Units) Forecast, by Application 2019 & 2032
- Table 33: Netherland Wireless Pressure Sensors Market Revenue (Million) Forecast, by Application 2019 & 2032
- Table 34: Netherland Wireless Pressure Sensors Market Volume (K Units) Forecast, by Application 2019 & 2032
- Table 35: Nordics Wireless Pressure Sensors Market Revenue (Million) Forecast, by Application 2019 & 2032
- Table 36: Nordics Wireless Pressure Sensors Market Volume (K Units) Forecast, by Application 2019 & 2032
- Table 37: Rest of Europe Wireless Pressure Sensors Market Revenue (Million) Forecast, by Application 2019 & 2032
- Table 38: Rest of Europe Wireless Pressure Sensors Market Volume (K Units) Forecast, by Application 2019 & 2032
- Table 39: Global Wireless Pressure Sensors Market Revenue Million Forecast, by Country 2019 & 2032
- Table 40: Global Wireless Pressure Sensors Market Volume K Units Forecast, by Country 2019 & 2032
- Table 41: China Wireless Pressure Sensors Market Revenue (Million) Forecast, by Application 2019 & 2032
- Table 42: China Wireless Pressure Sensors Market Volume (K Units) Forecast, by Application 2019 & 2032
- Table 43: Japan Wireless Pressure Sensors Market Revenue (Million) Forecast, by Application 2019 & 2032
- Table 44: Japan Wireless Pressure Sensors Market Volume (K Units) Forecast, by Application 2019 & 2032
- Table 45: India Wireless Pressure Sensors Market Revenue (Million) Forecast, by Application 2019 & 2032
- Table 46: India Wireless Pressure Sensors Market Volume (K Units) Forecast, by Application 2019 & 2032
- Table 47: South Korea Wireless Pressure Sensors Market Revenue (Million) Forecast, by Application 2019 & 2032
- Table 48: South Korea Wireless Pressure Sensors Market Volume (K Units) Forecast, by Application 2019 & 2032
- Table 49: Southeast Asia Wireless Pressure Sensors Market Revenue (Million) Forecast, by Application 2019 & 2032
- Table 50: Southeast Asia Wireless Pressure Sensors Market Volume (K Units) Forecast, by Application 2019 & 2032
- Table 51: Australia Wireless Pressure Sensors Market Revenue (Million) Forecast, by Application 2019 & 2032
- Table 52: Australia Wireless Pressure Sensors Market Volume (K Units) Forecast, by Application 2019 & 2032
- Table 53: Indonesia Wireless Pressure Sensors Market Revenue (Million) Forecast, by Application 2019 & 2032
- Table 54: Indonesia Wireless Pressure Sensors Market Volume (K Units) Forecast, by Application 2019 & 2032
- Table 55: Phillipes Wireless Pressure Sensors Market Revenue (Million) Forecast, by Application 2019 & 2032
- Table 56: Phillipes Wireless Pressure Sensors Market Volume (K Units) Forecast, by Application 2019 & 2032
- Table 57: Singapore Wireless Pressure Sensors Market Revenue (Million) Forecast, by Application 2019 & 2032
- Table 58: Singapore Wireless Pressure Sensors Market Volume (K Units) Forecast, by Application 2019 & 2032
- Table 59: Thailandc Wireless Pressure Sensors Market Revenue (Million) Forecast, by Application 2019 & 2032
- Table 60: Thailandc Wireless Pressure Sensors Market Volume (K Units) Forecast, by Application 2019 & 2032
- Table 61: Rest of Asia Pacific Wireless Pressure Sensors Market Revenue (Million) Forecast, by Application 2019 & 2032
- Table 62: Rest of Asia Pacific Wireless Pressure Sensors Market Volume (K Units) Forecast, by Application 2019 & 2032
- Table 63: Global Wireless Pressure Sensors Market Revenue Million Forecast, by Country 2019 & 2032
- Table 64: Global Wireless Pressure Sensors Market Volume K Units Forecast, by Country 2019 & 2032
- Table 65: Brazil Wireless Pressure Sensors Market Revenue (Million) Forecast, by Application 2019 & 2032
- Table 66: Brazil Wireless Pressure Sensors Market Volume (K Units) Forecast, by Application 2019 & 2032
- Table 67: Argentina Wireless Pressure Sensors Market Revenue (Million) Forecast, by Application 2019 & 2032
- Table 68: Argentina Wireless Pressure Sensors Market Volume (K Units) Forecast, by Application 2019 & 2032
- Table 69: Peru Wireless Pressure Sensors Market Revenue (Million) Forecast, by Application 2019 & 2032
- Table 70: Peru Wireless Pressure Sensors Market Volume (K Units) Forecast, by Application 2019 & 2032
- Table 71: Chile Wireless Pressure Sensors Market Revenue (Million) Forecast, by Application 2019 & 2032
- Table 72: Chile Wireless Pressure Sensors Market Volume (K Units) Forecast, by Application 2019 & 2032
- Table 73: Colombia Wireless Pressure Sensors Market Revenue (Million) Forecast, by Application 2019 & 2032
- Table 74: Colombia Wireless Pressure Sensors Market Volume (K Units) Forecast, by Application 2019 & 2032
- Table 75: Ecuador Wireless Pressure Sensors Market Revenue (Million) Forecast, by Application 2019 & 2032
- Table 76: Ecuador Wireless Pressure Sensors Market Volume (K Units) Forecast, by Application 2019 & 2032
- Table 77: Venezuela Wireless Pressure Sensors Market Revenue (Million) Forecast, by Application 2019 & 2032
- Table 78: Venezuela Wireless Pressure Sensors Market Volume (K Units) Forecast, by Application 2019 & 2032
- Table 79: Rest of South America Wireless Pressure Sensors Market Revenue (Million) Forecast, by Application 2019 & 2032
- Table 80: Rest of South America Wireless Pressure Sensors Market Volume (K Units) Forecast, by Application 2019 & 2032
- Table 81: Global Wireless Pressure Sensors Market Revenue Million Forecast, by Country 2019 & 2032
- Table 82: Global Wireless Pressure Sensors Market Volume K Units Forecast, by Country 2019 & 2032
- Table 83: United Arab Emirates Wireless Pressure Sensors Market Revenue (Million) Forecast, by Application 2019 & 2032
- Table 84: United Arab Emirates Wireless Pressure Sensors Market Volume (K Units) Forecast, by Application 2019 & 2032
- Table 85: Saudi Arabia Wireless Pressure Sensors Market Revenue (Million) Forecast, by Application 2019 & 2032
- Table 86: Saudi Arabia Wireless Pressure Sensors Market Volume (K Units) Forecast, by Application 2019 & 2032
- Table 87: South Africa Wireless Pressure Sensors Market Revenue (Million) Forecast, by Application 2019 & 2032
- Table 88: South Africa Wireless Pressure Sensors Market Volume (K Units) Forecast, by Application 2019 & 2032
- Table 89: Rest of Middle East and Africa Wireless Pressure Sensors Market Revenue (Million) Forecast, by Application 2019 & 2032
- Table 90: Rest of Middle East and Africa Wireless Pressure Sensors Market Volume (K Units) Forecast, by Application 2019 & 2032
- Table 91: Global Wireless Pressure Sensors Market Revenue Million Forecast, by Technology 2019 & 2032
- Table 92: Global Wireless Pressure Sensors Market Volume K Units Forecast, by Technology 2019 & 2032
- Table 93: Global Wireless Pressure Sensors Market Revenue Million Forecast, by End-user Industry 2019 & 2032
- Table 94: Global Wireless Pressure Sensors Market Volume K Units Forecast, by End-user Industry 2019 & 2032
- Table 95: Global Wireless Pressure Sensors Market Revenue Million Forecast, by Country 2019 & 2032
- Table 96: Global Wireless Pressure Sensors Market Volume K Units Forecast, by Country 2019 & 2032
- Table 97: United States Wireless Pressure Sensors Market Revenue (Million) Forecast, by Application 2019 & 2032
- Table 98: United States Wireless Pressure Sensors Market Volume (K Units) Forecast, by Application 2019 & 2032
- Table 99: Canada Wireless Pressure Sensors Market Revenue (Million) Forecast, by Application 2019 & 2032
- Table 100: Canada Wireless Pressure Sensors Market Volume (K Units) Forecast, by Application 2019 & 2032
- Table 101: Global Wireless Pressure Sensors Market Revenue Million Forecast, by Technology 2019 & 2032
- Table 102: Global Wireless Pressure Sensors Market Volume K Units Forecast, by Technology 2019 & 2032
- Table 103: Global Wireless Pressure Sensors Market Revenue Million Forecast, by End-user Industry 2019 & 2032
- Table 104: Global Wireless Pressure Sensors Market Volume K Units Forecast, by End-user Industry 2019 & 2032
- Table 105: Global Wireless Pressure Sensors Market Revenue Million Forecast, by Country 2019 & 2032
- Table 106: Global Wireless Pressure Sensors Market Volume K Units Forecast, by Country 2019 & 2032
- Table 107: Germany Wireless Pressure Sensors Market Revenue (Million) Forecast, by Application 2019 & 2032
- Table 108: Germany Wireless Pressure Sensors Market Volume (K Units) Forecast, by Application 2019 & 2032
- Table 109: United Kingdom Wireless Pressure Sensors Market Revenue (Million) Forecast, by Application 2019 & 2032
- Table 110: United Kingdom Wireless Pressure Sensors Market Volume (K Units) Forecast, by Application 2019 & 2032
- Table 111: France Wireless Pressure Sensors Market Revenue (Million) Forecast, by Application 2019 & 2032
- Table 112: France Wireless Pressure Sensors Market Volume (K Units) Forecast, by Application 2019 & 2032
- Table 113: Rest of Europe Wireless Pressure Sensors Market Revenue (Million) Forecast, by Application 2019 & 2032
- Table 114: Rest of Europe Wireless Pressure Sensors Market Volume (K Units) Forecast, by Application 2019 & 2032
- Table 115: Global Wireless Pressure Sensors Market Revenue Million Forecast, by Technology 2019 & 2032
- Table 116: Global Wireless Pressure Sensors Market Volume K Units Forecast, by Technology 2019 & 2032
- Table 117: Global Wireless Pressure Sensors Market Revenue Million Forecast, by End-user Industry 2019 & 2032
- Table 118: Global Wireless Pressure Sensors Market Volume K Units Forecast, by End-user Industry 2019 & 2032
- Table 119: Global Wireless Pressure Sensors Market Revenue Million Forecast, by Country 2019 & 2032
- Table 120: Global Wireless Pressure Sensors Market Volume K Units Forecast, by Country 2019 & 2032
- Table 121: China Wireless Pressure Sensors Market Revenue (Million) Forecast, by Application 2019 & 2032
- Table 122: China Wireless Pressure Sensors Market Volume (K Units) Forecast, by Application 2019 & 2032
- Table 123: Japan Wireless Pressure Sensors Market Revenue (Million) Forecast, by Application 2019 & 2032
- Table 124: Japan Wireless Pressure Sensors Market Volume (K Units) Forecast, by Application 2019 & 2032
- Table 125: India Wireless Pressure Sensors Market Revenue (Million) Forecast, by Application 2019 & 2032
- Table 126: India Wireless Pressure Sensors Market Volume (K Units) Forecast, by Application 2019 & 2032
- Table 127: Rest of Asia Pacific Wireless Pressure Sensors Market Revenue (Million) Forecast, by Application 2019 & 2032
- Table 128: Rest of Asia Pacific Wireless Pressure Sensors Market Volume (K Units) Forecast, by Application 2019 & 2032
- Table 129: Global Wireless Pressure Sensors Market Revenue Million Forecast, by Technology 2019 & 2032
- Table 130: Global Wireless Pressure Sensors Market Volume K Units Forecast, by Technology 2019 & 2032
- Table 131: Global Wireless Pressure Sensors Market Revenue Million Forecast, by End-user Industry 2019 & 2032
- Table 132: Global Wireless Pressure Sensors Market Volume K Units Forecast, by End-user Industry 2019 & 2032
- Table 133: Global Wireless Pressure Sensors Market Revenue Million Forecast, by Country 2019 & 2032
- Table 134: Global Wireless Pressure Sensors Market Volume K Units Forecast, by Country 2019 & 2032
- Table 135: Latin America Wireless Pressure Sensors Market Revenue (Million) Forecast, by Application 2019 & 2032
- Table 136: Latin America Wireless Pressure Sensors Market Volume (K Units) Forecast, by Application 2019 & 2032
- Table 137: Middle East Wireless Pressure Sensors Market Revenue (Million) Forecast, by Application 2019 & 2032
- Table 138: Middle East Wireless Pressure Sensors Market Volume (K Units) Forecast, by Application 2019 & 2032
Frequently Asked Questions
1. What is the projected Compound Annual Growth Rate (CAGR) of the Wireless Pressure Sensors Market?
The projected CAGR is approximately 20.80%.
2. Which companies are prominent players in the Wireless Pressure Sensors Market?
Key companies in the market include Infineon Technologies AG, Honeywell International Inc, Texas Instruments Inc, OleumTech Corporation, Murata Manufacturing Co Ltd, ESI Inc, Siemens AG, ABB Group, TE Connectivity Ltd, Acuity Incorporated, Rockwell Automation Inc, Phoenix Sensors LLC, Analog Devices Inc, Emerson Electric Company.
3. What are the main segments of the Wireless Pressure Sensors Market?
The market segments include Technology, End-user Industry.
4. Can you provide details about the market size?
The market size is estimated to be USD XX Million as of 2022.
5. What are some drivers contributing to market growth?
Growth in Automotive and Health Care Industries; Increasing Adoption of Wireless Systems Due to Industry 4.0.
6. What are the notable trends driving market growth?
Wireless Pressure Sensors to Witness an Increased Demand from the Automotive Industry.
7. Are there any restraints impacting market growth?
High Cost Associated with Sensing Products; Low Product Differentiation.
8. Can you provide examples of recent developments in the market?
N/A
9. What pricing options are available for accessing the report?
Pricing options include single-user, multi-user, and enterprise licenses priced at USD 4750, USD 5250, and USD 8750 respectively.
10. Is the market size provided in terms of value or volume?
The market size is provided in terms of value, measured in Million and volume, measured in K Units.
11. Are there any specific market keywords associated with the report?
Yes, the market keyword associated with the report is "Wireless Pressure Sensors Market," which aids in identifying and referencing the specific market segment covered.
12. How do I determine which pricing option suits my needs best?
The pricing options vary based on user requirements and access needs. Individual users may opt for single-user licenses, while businesses requiring broader access may choose multi-user or enterprise licenses for cost-effective access to the report.
13. Are there any additional resources or data provided in the Wireless Pressure Sensors Market report?
While the report offers comprehensive insights, it's advisable to review the specific contents or supplementary materials provided to ascertain if additional resources or data are available.
14. How can I stay updated on further developments or reports in the Wireless Pressure Sensors Market?
To stay informed about further developments, trends, and reports in the Wireless Pressure Sensors Market, consider subscribing to industry newsletters, following relevant companies and organizations, or regularly checking reputable industry news sources and publications.
Methodology
Step 1 - Identification of Relevant Samples Size from Population Database


Step 2 - Approaches for Defining Global Market Size (Value, Volume* & Price*)

Note*: In applicable scenarios
Step 3 - Data Sources
Primary Research
- Web Analytics
- Survey Reports
- Research Institute
- Latest Research Reports
- Opinion Leaders
Secondary Research
- Annual Reports
- White Paper
- Latest Press Release
- Industry Association
- Paid Database
- Investor Presentations

Step 4 - Data Triangulation
Involves using different sources of information in order to increase the validity of a study
These sources are likely to be stakeholders in a program - participants, other researchers, program staff, other community members, and so on.
Then we put all data in single framework & apply various statistical tools to find out the dynamic on the market.
During the analysis stage, feedback from the stakeholder groups would be compared to determine areas of agreement as well as areas of divergence


