
Key Insights
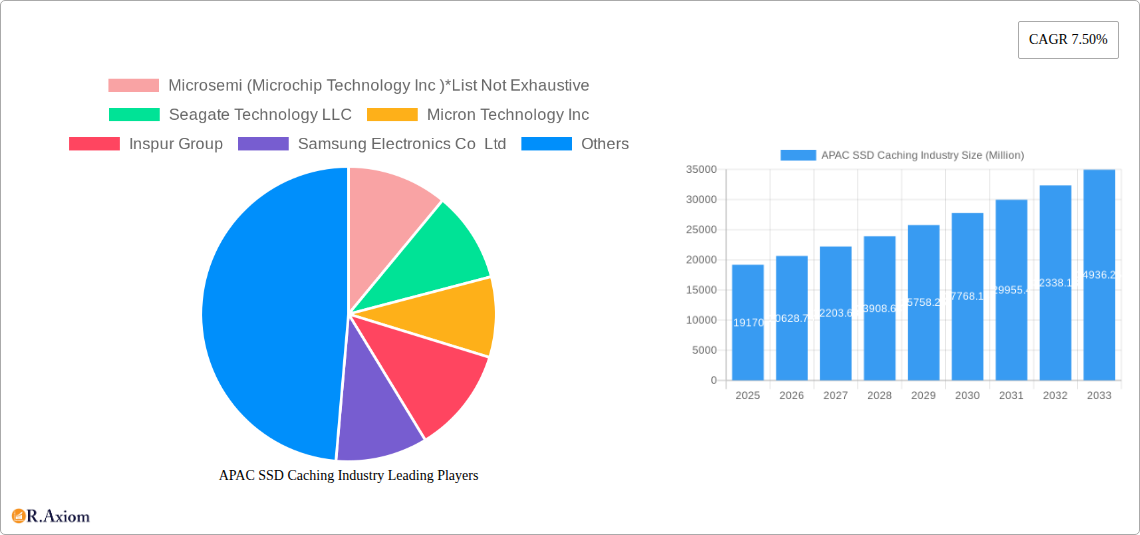
The Asia-Pacific (APAC) Solid State Drive (SSD) caching market, valued at $19.17 billion in 2025, is projected to experience robust growth, driven by the increasing adoption of cloud computing, big data analytics, and the burgeoning demand for high-performance computing across various sectors. The region's rapidly expanding digital economy, coupled with significant investments in data center infrastructure, particularly in China, Japan, South Korea, and India, fuels this market expansion. Growth is further accelerated by the decreasing cost of SSDs, making them a more viable and cost-effective solution for enhancing data storage and retrieval speed. Key application segments, including enterprise storage and personal storage, contribute significantly to market size. Enterprise storage solutions, driven by large-scale data centers and cloud service providers, dominate the market share. However, the personal storage segment is showing substantial growth due to the increasing adoption of high-performance computing systems for gaming and content creation among consumers. While challenges such as the initial high capital expenditure associated with SSD caching solutions and potential data security concerns exist, the overall market outlook remains optimistic, supported by ongoing technological advancements and the persistent need for faster data access in various applications.
The competitive landscape is intensely dynamic with major players like Seagate, Micron, Samsung, Western Digital, and Kioxia competing for market dominance. These companies are constantly innovating, introducing new products with higher capacities, faster speeds, and improved power efficiency to meet evolving market demands. The market's future hinges on the continuous development of more sophisticated SSD technologies, alongside robust cybersecurity measures to safeguard sensitive data. The APAC region's unique characteristics, such as diverse technological adoption rates and varying regulatory landscapes across different countries, present both opportunities and challenges for market players, emphasizing the need for tailored strategies for specific national markets within the region. Continued infrastructure development and government initiatives aimed at promoting digitalization across the region will further stimulate growth in the coming years.
APAC SSD Caching Industry Market Report: 2019-2033
This comprehensive report provides a detailed analysis of the Asia-Pacific (APAC) Solid State Drive (SSD) caching industry, covering market size, growth drivers, competitive landscape, and future outlook. The report utilizes data from 2019-2024 (historical period), with an estimated year of 2025 and a forecast period spanning 2025-2033. This in-depth study is crucial for industry stakeholders, investors, and businesses seeking to understand and capitalize on the opportunities within this rapidly evolving market.
APAC SSD Caching Industry Market Concentration & Innovation
The APAC SSD caching market exhibits a moderately concentrated landscape, with a few dominant players controlling a significant portion of the market share. Key players include Micron Technology Inc, Samsung Electronics Co Ltd, Seagate Technology LLC, Western Digital Corporation, SK Hynix Inc, Kioxia (Toshiba Memory Corporation), Intel Corporation, and NetApp Inc, among others. However, several smaller, regional players also contribute significantly, especially in countries like China and India. The market share of the top 5 players is estimated at approximately xx%.
Innovation within the industry is driven by advancements in NAND flash technology, resulting in increased storage density, improved performance (lower latency), and reduced costs. The growing adoption of NVMe (Non-Volatile Memory Express) technology is another significant driver of innovation, offering significant performance improvements over traditional SATA and SAS interfaces. Regulatory frameworks, including data privacy regulations and government initiatives to promote digital infrastructure development, influence market growth. Product substitutes, such as high-capacity hard disk drives (HDDs), remain a competitive threat, especially in cost-sensitive segments. However, the performance advantage of SSDs is driving their increasing adoption. End-user trends, particularly the increasing demand for faster data access speeds in cloud computing and data centers, are boosting market demand. M&A activity in the sector has been moderate in recent years, with deal values averaging approximately xx Million annually, predominantly focused on strengthening technology portfolios and expanding geographical reach.
APAC SSD Caching Industry Industry Trends & Insights
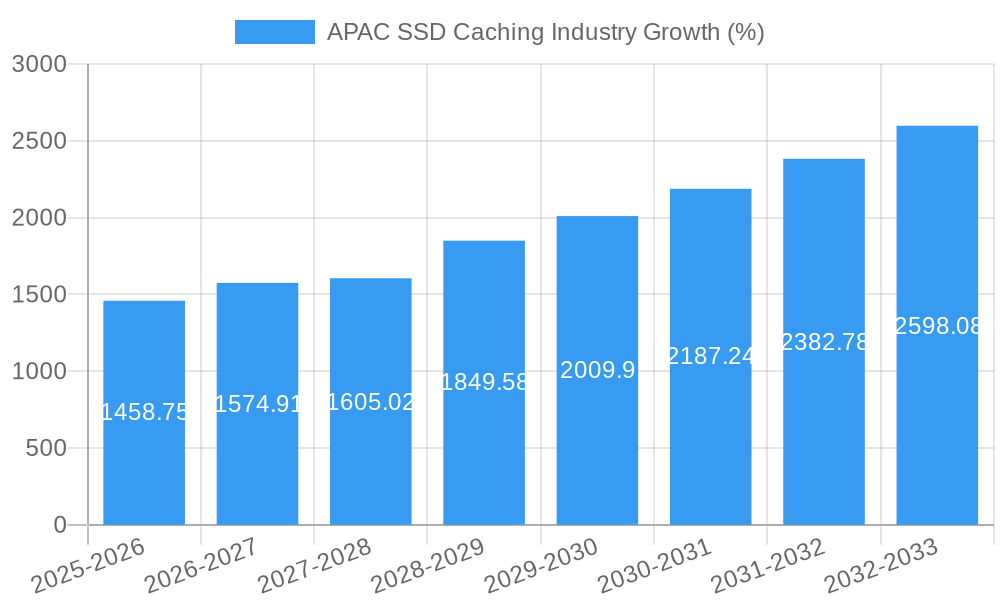
The APAC SSD caching market is experiencing substantial growth, driven by several factors. The rising adoption of cloud computing and big data analytics fuels demand for high-performance storage solutions. The increasing penetration of smartphones, tablets, and other mobile devices, which rely on flash storage, is also driving growth. The expanding e-commerce sector and the growth of data-intensive applications like video streaming are further contributing factors. Technological disruptions, such as the transition to NVMe and the development of 3D NAND technology, are significantly improving SSD performance and capacity. Consumer preferences are shifting towards faster, more reliable storage solutions, which favors the adoption of SSD caching. The market's competitive dynamics are characterized by intense rivalry among major players, leading to continuous product innovation and price competition. The Compound Annual Growth Rate (CAGR) for the APAC SSD caching market during the forecast period (2025-2033) is projected to be xx%, with market penetration expected to reach xx% by 2033.
Dominant Markets & Segments in APAP SSD Caching Industry
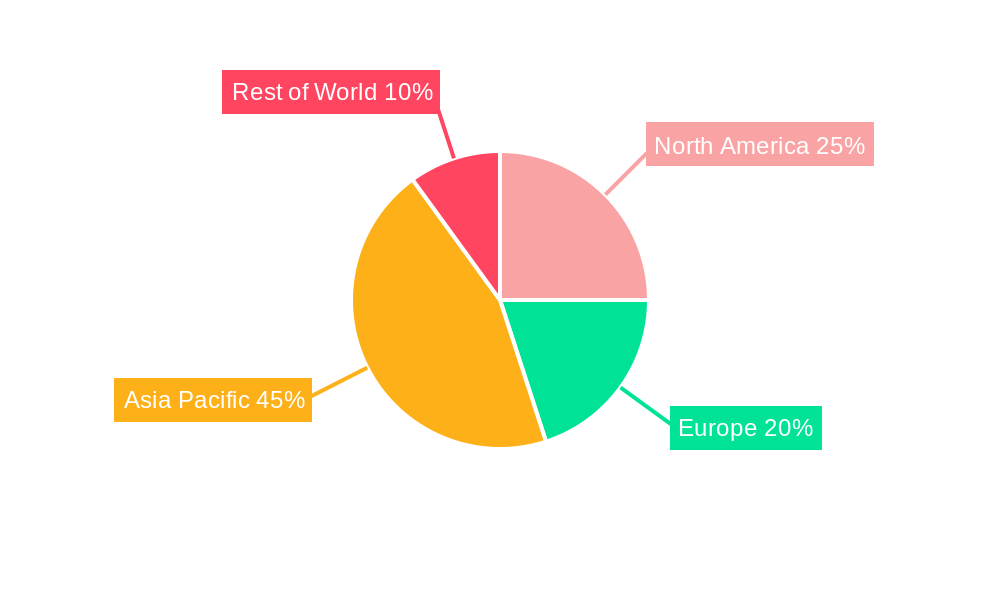
The APAC SSD caching market is dominated by China, which accounts for the largest market share due to its rapidly expanding data center infrastructure and the surge in cloud computing adoption. India and South Korea are also experiencing significant growth, driven by robust economic expansion and increasing digitalization. Japan, while having a mature market, continues to show steady growth in specific niche segments. The "Rest of Asia Pacific" region also presents considerable growth potential.
- By Application: The enterprise storage segment holds the largest market share, driven by the high demand for performance and reliability in data centers and cloud environments. The personal storage segment, while smaller, is exhibiting robust growth due to increasing consumer adoption of SSDs in PCs, laptops, and mobile devices.
- By Country:
- China: Dominates due to its large and rapidly growing IT sector, supportive government policies, and significant investments in data center infrastructure.
- Japan: Mature market with consistent growth fueled by technology innovation and high consumer spending.
- India: Rapidly expanding market fueled by government initiatives promoting digitalization and the growth of the IT sector.
- South Korea: Strong growth driven by its advanced technology sector and significant investments in R&D.
- Rest of Asia Pacific: A diverse region with pockets of strong growth in countries with expanding digital economies.
APAC SSD Caching Industry Product Developments
Recent product innovations focus on enhancing performance, increasing storage capacity, and improving energy efficiency. The shift to NVMe SSDs is a major trend, offering significantly faster read/write speeds compared to SATA and SAS-based solutions. Hybrid storage architectures combining HDDs and SSDs are gaining traction, providing a balance between cost and performance. Companies are also incorporating advanced features like data encryption and intelligent data management to improve data security and efficiency. The market fit for these new technologies is strong, driven by the increasing demands of data-intensive applications and the need for high-performance storage solutions.
Report Scope & Segmentation Analysis
This report segments the APAC SSD caching market by application (Enterprise Storage, Personal Storage) and by country (China, Japan, India, South Korea, Rest of Asia Pacific). Each segment's growth projection, market size, and competitive dynamics are analyzed in detail. The Enterprise Storage segment is projected to grow at a CAGR of xx% during the forecast period, while the Personal Storage segment is expected to grow at a CAGR of xx%. China holds the largest market share, projected to reach xx Million by 2033.
Key Drivers of APAC SSD Caching Industry Growth
Several key factors drive the growth of the APAC SSD caching industry. Firstly, the rapid expansion of data centers and cloud computing necessitates high-performance storage solutions. Secondly, increasing adoption of big data analytics and AI applications demands faster data processing capabilities, favoring SSD caching. Finally, government initiatives promoting digitalization and investments in infrastructure across the region play a pivotal role in market expansion.
Challenges in the APAP SSD Caching Industry Sector
The APAC SSD caching industry faces several challenges. Firstly, price competition among numerous players can compress profit margins. Secondly, the supply chain for SSD components remains vulnerable to disruptions, impacting production and availability. Lastly, regulatory uncertainties in some APAC markets can affect market expansion and investment decisions.
Emerging Opportunities in APAC SSD Caching Industry
The APAC SSD caching market presents several emerging opportunities. The growing adoption of edge computing creates demand for high-performance storage solutions at the network edge. The rise of 5G networks and the Internet of Things (IoT) is further expanding the demand for robust and reliable storage.
Leading Players in the APAC SSD Caching Industry Market
- Microsemi (Microchip Technology Inc)
- Seagate Technology LLC
- Micron Technology Inc
- Inspur Group
- Samsung Electronics Co Ltd
- Transcend Information Inc
- Kioxia (Toshiba Memory Corporation)
- ADATA Technology Co Ltd
- Western Digital Corporation
- SK Hynix Inc
- NetApp Inc
- Intel Corporation
- QNAP Systems Inc
Key Developments in APAC SSD Caching Industry
- July 2023: Lenovo's updated ThinkSystem DM5000H significantly enhances storage capacity (up to 23.5 PB for NAS) and incorporates NVMe SSD caching for faster read-centric workloads. This boosts enterprise storage solutions and strengthens Lenovo's position in the high-capacity storage market.
- January 2023: QNAP Systems, Inc. introduced the TS-1655, a high-capacity 2.5GbE NAS with a hybrid HDD/SSD architecture. This addresses the growing need for cost-effective, high-capacity NAS solutions with enhanced performance and data security, targeting SMB and enterprise clients.
Strategic Outlook for APAC SSD Caching Industry Market
The APAC SSD caching market is poised for robust growth over the next decade, driven by a combination of technological advancements, increasing data volumes, and the continued expansion of cloud computing and digital infrastructure. The focus on NVMe technology, hybrid storage solutions, and improved data management capabilities will continue to shape the market. Companies that can effectively address the growing demand for high-performance, cost-effective, and secure storage solutions will be well-positioned for success.
APAC SSD Caching Industry Segmentation
-
1. Application
- 1.1. Enterprise Storage
- 1.2. Personal Storage
APAC SSD Caching Industry Segmentation By Geography
-
1. North America
- 1.1. United States
- 1.2. Canada
- 1.3. Mexico
-
2. South America
- 2.1. Brazil
- 2.2. Argentina
- 2.3. Rest of South America
-
3. Europe
- 3.1. United Kingdom
- 3.2. Germany
- 3.3. France
- 3.4. Italy
- 3.5. Spain
- 3.6. Russia
- 3.7. Benelux
- 3.8. Nordics
- 3.9. Rest of Europe
-
4. Middle East & Africa
- 4.1. Turkey
- 4.2. Israel
- 4.3. GCC
- 4.4. North Africa
- 4.5. South Africa
- 4.6. Rest of Middle East & Africa
-
5. Asia Pacific
- 5.1. China
- 5.2. India
- 5.3. Japan
- 5.4. South Korea
- 5.5. ASEAN
- 5.6. Oceania
- 5.7. Rest of Asia Pacific
APAC SSD Caching Industry REPORT HIGHLIGHTS
| Aspects | Details |
|---|---|
| Study Period | 2019-2033 |
| Base Year | 2024 |
| Estimated Year | 2025 |
| Forecast Period | 2025-2033 |
| Historical Period | 2019-2024 |
| Growth Rate | CAGR of 7.50% from 2019-2033 |
| Segmentation |
|
Table of Contents
- 1. Introduction
- 1.1. Research Scope
- 1.2. Market Segmentation
- 1.3. Research Methodology
- 1.4. Definitions and Assumptions
- 2. Executive Summary
- 2.1. Introduction
- 3. Market Dynamics
- 3.1. Introduction
- 3.2. Market Drivers
- 3.2.1. Improvements Offered by SSDs Over Conventional HDDs
- 3.3. Market Restrains
- 3.3.1. Slow Pace in Development of Applications Despite Heavy investments in R&D; Commplexities in Hardware Designing
- 3.4. Market Trends
- 3.4.1. Enterprise Storage Application Segment is Expected to Hold Significant Market Share
- 4. Market Factor Analysis
- 4.1. Porters Five Forces
- 4.2. Supply/Value Chain
- 4.3. PESTEL analysis
- 4.4. Market Entropy
- 4.5. Patent/Trademark Analysis
- 5. Global APAC SSD Caching Industry Analysis, Insights and Forecast, 2019-2031
- 5.1. Market Analysis, Insights and Forecast - by Application
- 5.1.1. Enterprise Storage
- 5.1.2. Personal Storage
- 5.2. Market Analysis, Insights and Forecast - by Region
- 5.2.1. North America
- 5.2.2. South America
- 5.2.3. Europe
- 5.2.4. Middle East & Africa
- 5.2.5. Asia Pacific
- 5.1. Market Analysis, Insights and Forecast - by Application
- 6. North America APAC SSD Caching Industry Analysis, Insights and Forecast, 2019-2031
- 6.1. Market Analysis, Insights and Forecast - by Application
- 6.1.1. Enterprise Storage
- 6.1.2. Personal Storage
- 6.1. Market Analysis, Insights and Forecast - by Application
- 7. South America APAC SSD Caching Industry Analysis, Insights and Forecast, 2019-2031
- 7.1. Market Analysis, Insights and Forecast - by Application
- 7.1.1. Enterprise Storage
- 7.1.2. Personal Storage
- 7.1. Market Analysis, Insights and Forecast - by Application
- 8. Europe APAC SSD Caching Industry Analysis, Insights and Forecast, 2019-2031
- 8.1. Market Analysis, Insights and Forecast - by Application
- 8.1.1. Enterprise Storage
- 8.1.2. Personal Storage
- 8.1. Market Analysis, Insights and Forecast - by Application
- 9. Middle East & Africa APAC SSD Caching Industry Analysis, Insights and Forecast, 2019-2031
- 9.1. Market Analysis, Insights and Forecast - by Application
- 9.1.1. Enterprise Storage
- 9.1.2. Personal Storage
- 9.1. Market Analysis, Insights and Forecast - by Application
- 10. Asia Pacific APAC SSD Caching Industry Analysis, Insights and Forecast, 2019-2031
- 10.1. Market Analysis, Insights and Forecast - by Application
- 10.1.1. Enterprise Storage
- 10.1.2. Personal Storage
- 10.1. Market Analysis, Insights and Forecast - by Application
- 11. North America APAC SSD Caching Industry Analysis, Insights and Forecast, 2019-2031
- 11.1. Market Analysis, Insights and Forecast - By Country/Sub-region
- 11.1.1 United States
- 11.1.2 Canada
- 12. Europe APAC SSD Caching Industry Analysis, Insights and Forecast, 2019-2031
- 12.1. Market Analysis, Insights and Forecast - By Country/Sub-region
- 12.1.1 Germany
- 12.1.2 United Kingdom
- 12.1.3 France
- 12.1.4 Rest of Europe
- 13. Asia Pacific APAC SSD Caching Industry Analysis, Insights and Forecast, 2019-2031
- 13.1. Market Analysis, Insights and Forecast - By Country/Sub-region
- 13.1.1 China
- 13.1.2 Taiwan
- 13.1.3 South Korea
- 13.1.4 Rest of Asia Pacific
- 14. Rest of the World APAC SSD Caching Industry Analysis, Insights and Forecast, 2019-2031
- 14.1. Market Analysis, Insights and Forecast - By Country/Sub-region
- 14.1.1.
- 15. Competitive Analysis
- 15.1. Global Market Share Analysis 2024
- 15.2. Company Profiles
- 15.2.1 Microsemi (Microchip Technology Inc )*List Not Exhaustive
- 15.2.1.1. Overview
- 15.2.1.2. Products
- 15.2.1.3. SWOT Analysis
- 15.2.1.4. Recent Developments
- 15.2.1.5. Financials (Based on Availability)
- 15.2.2 Seagate Technology LLC
- 15.2.2.1. Overview
- 15.2.2.2. Products
- 15.2.2.3. SWOT Analysis
- 15.2.2.4. Recent Developments
- 15.2.2.5. Financials (Based on Availability)
- 15.2.3 Micron Technology Inc
- 15.2.3.1. Overview
- 15.2.3.2. Products
- 15.2.3.3. SWOT Analysis
- 15.2.3.4. Recent Developments
- 15.2.3.5. Financials (Based on Availability)
- 15.2.4 Inspur Group
- 15.2.4.1. Overview
- 15.2.4.2. Products
- 15.2.4.3. SWOT Analysis
- 15.2.4.4. Recent Developments
- 15.2.4.5. Financials (Based on Availability)
- 15.2.5 Samsung Electronics Co Ltd
- 15.2.5.1. Overview
- 15.2.5.2. Products
- 15.2.5.3. SWOT Analysis
- 15.2.5.4. Recent Developments
- 15.2.5.5. Financials (Based on Availability)
- 15.2.6 Transcend Information Inc
- 15.2.6.1. Overview
- 15.2.6.2. Products
- 15.2.6.3. SWOT Analysis
- 15.2.6.4. Recent Developments
- 15.2.6.5. Financials (Based on Availability)
- 15.2.7 Kioxia (Toshiba Memory Corporation)
- 15.2.7.1. Overview
- 15.2.7.2. Products
- 15.2.7.3. SWOT Analysis
- 15.2.7.4. Recent Developments
- 15.2.7.5. Financials (Based on Availability)
- 15.2.8 ADATA Technology Co Ltd
- 15.2.8.1. Overview
- 15.2.8.2. Products
- 15.2.8.3. SWOT Analysis
- 15.2.8.4. Recent Developments
- 15.2.8.5. Financials (Based on Availability)
- 15.2.9 Western Digital Corporation
- 15.2.9.1. Overview
- 15.2.9.2. Products
- 15.2.9.3. SWOT Analysis
- 15.2.9.4. Recent Developments
- 15.2.9.5. Financials (Based on Availability)
- 15.2.10 SK Hynix Inc
- 15.2.10.1. Overview
- 15.2.10.2. Products
- 15.2.10.3. SWOT Analysis
- 15.2.10.4. Recent Developments
- 15.2.10.5. Financials (Based on Availability)
- 15.2.11 NetApp Inc
- 15.2.11.1. Overview
- 15.2.11.2. Products
- 15.2.11.3. SWOT Analysis
- 15.2.11.4. Recent Developments
- 15.2.11.5. Financials (Based on Availability)
- 15.2.12 Intel Corporation
- 15.2.12.1. Overview
- 15.2.12.2. Products
- 15.2.12.3. SWOT Analysis
- 15.2.12.4. Recent Developments
- 15.2.12.5. Financials (Based on Availability)
- 15.2.13 QNAP Systems Inc
- 15.2.13.1. Overview
- 15.2.13.2. Products
- 15.2.13.3. SWOT Analysis
- 15.2.13.4. Recent Developments
- 15.2.13.5. Financials (Based on Availability)
- 15.2.1 Microsemi (Microchip Technology Inc )*List Not Exhaustive
List of Figures
- Figure 1: Global APAC SSD Caching Industry Revenue Breakdown (Million, %) by Region 2024 & 2032
- Figure 2: North America APAC SSD Caching Industry Revenue (Million), by Country 2024 & 2032
- Figure 3: North America APAC SSD Caching Industry Revenue Share (%), by Country 2024 & 2032
- Figure 4: Europe APAC SSD Caching Industry Revenue (Million), by Country 2024 & 2032
- Figure 5: Europe APAC SSD Caching Industry Revenue Share (%), by Country 2024 & 2032
- Figure 6: Asia Pacific APAC SSD Caching Industry Revenue (Million), by Country 2024 & 2032
- Figure 7: Asia Pacific APAC SSD Caching Industry Revenue Share (%), by Country 2024 & 2032
- Figure 8: Rest of the World APAC SSD Caching Industry Revenue (Million), by Country 2024 & 2032
- Figure 9: Rest of the World APAC SSD Caching Industry Revenue Share (%), by Country 2024 & 2032
- Figure 10: North America APAC SSD Caching Industry Revenue (Million), by Application 2024 & 2032
- Figure 11: North America APAC SSD Caching Industry Revenue Share (%), by Application 2024 & 2032
- Figure 12: North America APAC SSD Caching Industry Revenue (Million), by Country 2024 & 2032
- Figure 13: North America APAC SSD Caching Industry Revenue Share (%), by Country 2024 & 2032
- Figure 14: South America APAC SSD Caching Industry Revenue (Million), by Application 2024 & 2032
- Figure 15: South America APAC SSD Caching Industry Revenue Share (%), by Application 2024 & 2032
- Figure 16: South America APAC SSD Caching Industry Revenue (Million), by Country 2024 & 2032
- Figure 17: South America APAC SSD Caching Industry Revenue Share (%), by Country 2024 & 2032
- Figure 18: Europe APAC SSD Caching Industry Revenue (Million), by Application 2024 & 2032
- Figure 19: Europe APAC SSD Caching Industry Revenue Share (%), by Application 2024 & 2032
- Figure 20: Europe APAC SSD Caching Industry Revenue (Million), by Country 2024 & 2032
- Figure 21: Europe APAC SSD Caching Industry Revenue Share (%), by Country 2024 & 2032
- Figure 22: Middle East & Africa APAC SSD Caching Industry Revenue (Million), by Application 2024 & 2032
- Figure 23: Middle East & Africa APAC SSD Caching Industry Revenue Share (%), by Application 2024 & 2032
- Figure 24: Middle East & Africa APAC SSD Caching Industry Revenue (Million), by Country 2024 & 2032
- Figure 25: Middle East & Africa APAC SSD Caching Industry Revenue Share (%), by Country 2024 & 2032
- Figure 26: Asia Pacific APAC SSD Caching Industry Revenue (Million), by Application 2024 & 2032
- Figure 27: Asia Pacific APAC SSD Caching Industry Revenue Share (%), by Application 2024 & 2032
- Figure 28: Asia Pacific APAC SSD Caching Industry Revenue (Million), by Country 2024 & 2032
- Figure 29: Asia Pacific APAC SSD Caching Industry Revenue Share (%), by Country 2024 & 2032
List of Tables
- Table 1: Global APAC SSD Caching Industry Revenue Million Forecast, by Region 2019 & 2032
- Table 2: Global APAC SSD Caching Industry Revenue Million Forecast, by Application 2019 & 2032
- Table 3: Global APAC SSD Caching Industry Revenue Million Forecast, by Region 2019 & 2032
- Table 4: Global APAC SSD Caching Industry Revenue Million Forecast, by Country 2019 & 2032
- Table 5: United States APAC SSD Caching Industry Revenue (Million) Forecast, by Application 2019 & 2032
- Table 6: Canada APAC SSD Caching Industry Revenue (Million) Forecast, by Application 2019 & 2032
- Table 7: Global APAC SSD Caching Industry Revenue Million Forecast, by Country 2019 & 2032
- Table 8: Germany APAC SSD Caching Industry Revenue (Million) Forecast, by Application 2019 & 2032
- Table 9: United Kingdom APAC SSD Caching Industry Revenue (Million) Forecast, by Application 2019 & 2032
- Table 10: France APAC SSD Caching Industry Revenue (Million) Forecast, by Application 2019 & 2032
- Table 11: Rest of Europe APAC SSD Caching Industry Revenue (Million) Forecast, by Application 2019 & 2032
- Table 12: Global APAC SSD Caching Industry Revenue Million Forecast, by Country 2019 & 2032
- Table 13: China APAC SSD Caching Industry Revenue (Million) Forecast, by Application 2019 & 2032
- Table 14: Taiwan APAC SSD Caching Industry Revenue (Million) Forecast, by Application 2019 & 2032
- Table 15: South Korea APAC SSD Caching Industry Revenue (Million) Forecast, by Application 2019 & 2032
- Table 16: Rest of Asia Pacific APAC SSD Caching Industry Revenue (Million) Forecast, by Application 2019 & 2032
- Table 17: Global APAC SSD Caching Industry Revenue Million Forecast, by Country 2019 & 2032
- Table 18: APAC SSD Caching Industry Revenue (Million) Forecast, by Application 2019 & 2032
- Table 19: Global APAC SSD Caching Industry Revenue Million Forecast, by Application 2019 & 2032
- Table 20: Global APAC SSD Caching Industry Revenue Million Forecast, by Country 2019 & 2032
- Table 21: United States APAC SSD Caching Industry Revenue (Million) Forecast, by Application 2019 & 2032
- Table 22: Canada APAC SSD Caching Industry Revenue (Million) Forecast, by Application 2019 & 2032
- Table 23: Mexico APAC SSD Caching Industry Revenue (Million) Forecast, by Application 2019 & 2032
- Table 24: Global APAC SSD Caching Industry Revenue Million Forecast, by Application 2019 & 2032
- Table 25: Global APAC SSD Caching Industry Revenue Million Forecast, by Country 2019 & 2032
- Table 26: Brazil APAC SSD Caching Industry Revenue (Million) Forecast, by Application 2019 & 2032
- Table 27: Argentina APAC SSD Caching Industry Revenue (Million) Forecast, by Application 2019 & 2032
- Table 28: Rest of South America APAC SSD Caching Industry Revenue (Million) Forecast, by Application 2019 & 2032
- Table 29: Global APAC SSD Caching Industry Revenue Million Forecast, by Application 2019 & 2032
- Table 30: Global APAC SSD Caching Industry Revenue Million Forecast, by Country 2019 & 2032
- Table 31: United Kingdom APAC SSD Caching Industry Revenue (Million) Forecast, by Application 2019 & 2032
- Table 32: Germany APAC SSD Caching Industry Revenue (Million) Forecast, by Application 2019 & 2032
- Table 33: France APAC SSD Caching Industry Revenue (Million) Forecast, by Application 2019 & 2032
- Table 34: Italy APAC SSD Caching Industry Revenue (Million) Forecast, by Application 2019 & 2032
- Table 35: Spain APAC SSD Caching Industry Revenue (Million) Forecast, by Application 2019 & 2032
- Table 36: Russia APAC SSD Caching Industry Revenue (Million) Forecast, by Application 2019 & 2032
- Table 37: Benelux APAC SSD Caching Industry Revenue (Million) Forecast, by Application 2019 & 2032
- Table 38: Nordics APAC SSD Caching Industry Revenue (Million) Forecast, by Application 2019 & 2032
- Table 39: Rest of Europe APAC SSD Caching Industry Revenue (Million) Forecast, by Application 2019 & 2032
- Table 40: Global APAC SSD Caching Industry Revenue Million Forecast, by Application 2019 & 2032
- Table 41: Global APAC SSD Caching Industry Revenue Million Forecast, by Country 2019 & 2032
- Table 42: Turkey APAC SSD Caching Industry Revenue (Million) Forecast, by Application 2019 & 2032
- Table 43: Israel APAC SSD Caching Industry Revenue (Million) Forecast, by Application 2019 & 2032
- Table 44: GCC APAC SSD Caching Industry Revenue (Million) Forecast, by Application 2019 & 2032
- Table 45: North Africa APAC SSD Caching Industry Revenue (Million) Forecast, by Application 2019 & 2032
- Table 46: South Africa APAC SSD Caching Industry Revenue (Million) Forecast, by Application 2019 & 2032
- Table 47: Rest of Middle East & Africa APAC SSD Caching Industry Revenue (Million) Forecast, by Application 2019 & 2032
- Table 48: Global APAC SSD Caching Industry Revenue Million Forecast, by Application 2019 & 2032
- Table 49: Global APAC SSD Caching Industry Revenue Million Forecast, by Country 2019 & 2032
- Table 50: China APAC SSD Caching Industry Revenue (Million) Forecast, by Application 2019 & 2032
- Table 51: India APAC SSD Caching Industry Revenue (Million) Forecast, by Application 2019 & 2032
- Table 52: Japan APAC SSD Caching Industry Revenue (Million) Forecast, by Application 2019 & 2032
- Table 53: South Korea APAC SSD Caching Industry Revenue (Million) Forecast, by Application 2019 & 2032
- Table 54: ASEAN APAC SSD Caching Industry Revenue (Million) Forecast, by Application 2019 & 2032
- Table 55: Oceania APAC SSD Caching Industry Revenue (Million) Forecast, by Application 2019 & 2032
- Table 56: Rest of Asia Pacific APAC SSD Caching Industry Revenue (Million) Forecast, by Application 2019 & 2032
Frequently Asked Questions
1. What is the projected Compound Annual Growth Rate (CAGR) of the APAC SSD Caching Industry?
The projected CAGR is approximately 7.50%.
2. Which companies are prominent players in the APAC SSD Caching Industry?
Key companies in the market include Microsemi (Microchip Technology Inc )*List Not Exhaustive, Seagate Technology LLC, Micron Technology Inc, Inspur Group, Samsung Electronics Co Ltd, Transcend Information Inc, Kioxia (Toshiba Memory Corporation), ADATA Technology Co Ltd, Western Digital Corporation, SK Hynix Inc, NetApp Inc, Intel Corporation, QNAP Systems Inc.
3. What are the main segments of the APAC SSD Caching Industry?
The market segments include Application.
4. Can you provide details about the market size?
The market size is estimated to be USD 19.17 Million as of 2022.
5. What are some drivers contributing to market growth?
Improvements Offered by SSDs Over Conventional HDDs.
6. What are the notable trends driving market growth?
Enterprise Storage Application Segment is Expected to Hold Significant Market Share.
7. Are there any restraints impacting market growth?
Slow Pace in Development of Applications Despite Heavy investments in R&D; Commplexities in Hardware Designing.
8. Can you provide examples of recent developments in the market?
July 2023: Lenovo updated ThinkSystem DM5000H can scale up to 1.96 PB of raw storage capacity. A cluster of the DM5000H storage systems can scale up to 23.5 PB for NAS or up to 11.7 PB for SAN environments. The ThinkSystem DM5000H offers unified file and block storage connectivity with support for 1 GbE or 10 GbE NAS and iSCSI and 8 Gb or 16 Gb Fibre Channel protocols simultaneously. Acceleration of read-centric workloads with the high-speed, low-latency onboard NVMe SSD caching.
9. What pricing options are available for accessing the report?
Pricing options include single-user, multi-user, and enterprise licenses priced at USD 4750, USD 4950, and USD 6800 respectively.
10. Is the market size provided in terms of value or volume?
The market size is provided in terms of value, measured in Million.
11. Are there any specific market keywords associated with the report?
Yes, the market keyword associated with the report is "APAC SSD Caching Industry," which aids in identifying and referencing the specific market segment covered.
12. How do I determine which pricing option suits my needs best?
The pricing options vary based on user requirements and access needs. Individual users may opt for single-user licenses, while businesses requiring broader access may choose multi-user or enterprise licenses for cost-effective access to the report.
13. Are there any additional resources or data provided in the APAC SSD Caching Industry report?
While the report offers comprehensive insights, it's advisable to review the specific contents or supplementary materials provided to ascertain if additional resources or data are available.
14. How can I stay updated on further developments or reports in the APAC SSD Caching Industry?
To stay informed about further developments, trends, and reports in the APAC SSD Caching Industry, consider subscribing to industry newsletters, following relevant companies and organizations, or regularly checking reputable industry news sources and publications.
Methodology
Step 1 - Identification of Relevant Samples Size from Population Database


Step 2 - Approaches for Defining Global Market Size (Value, Volume* & Price*)

Note*: In applicable scenarios
Step 3 - Data Sources
Primary Research
- Web Analytics
- Survey Reports
- Research Institute
- Latest Research Reports
- Opinion Leaders
Secondary Research
- Annual Reports
- White Paper
- Latest Press Release
- Industry Association
- Paid Database
- Investor Presentations

Step 4 - Data Triangulation
Involves using different sources of information in order to increase the validity of a study
These sources are likely to be stakeholders in a program - participants, other researchers, program staff, other community members, and so on.
Then we put all data in single framework & apply various statistical tools to find out the dynamic on the market.
During the analysis stage, feedback from the stakeholder groups would be compared to determine areas of agreement as well as areas of divergence


