
Key Insights
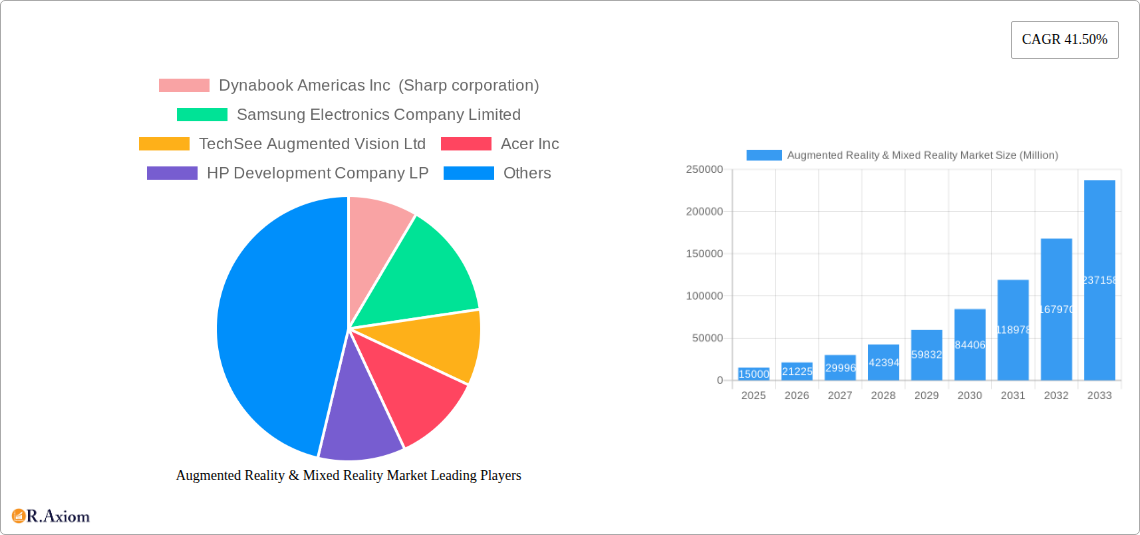
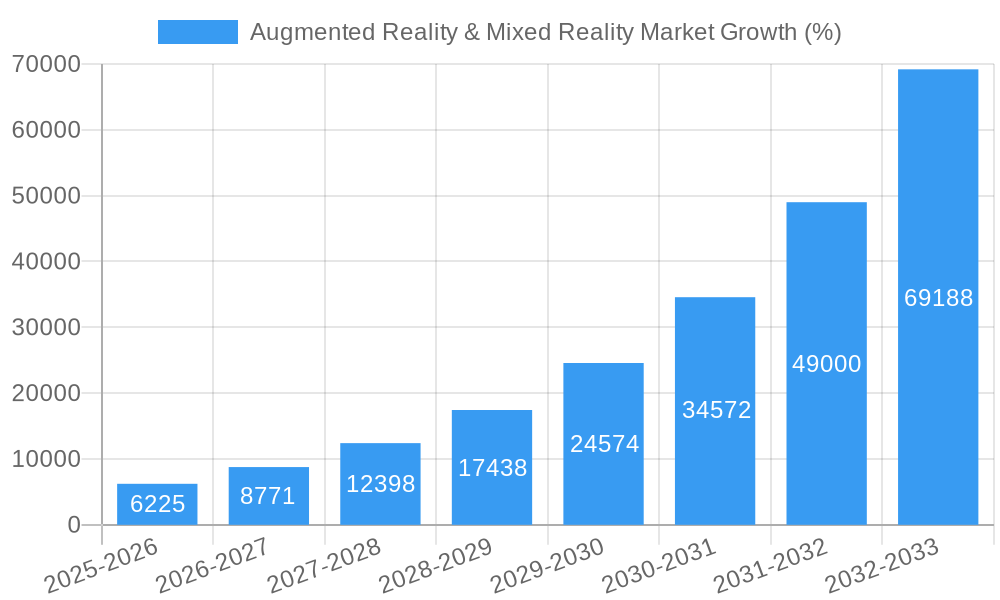
The Augmented Reality (AR) and Mixed Reality (MR) market is experiencing explosive growth, projected to reach a substantial size driven by technological advancements and increasing adoption across diverse sectors. The 41.50% CAGR from 2019-2024 indicates a rapidly expanding market, fueled by factors such as the development of more affordable and accessible AR/MR hardware, improvements in processing power and graphics capabilities, and the rise of innovative applications across various industries. Consumer adoption is a key driver, with the gaming and entertainment sectors leading the way. However, the medical and healthcare sectors are demonstrating significant potential, using AR/MR for surgical planning, training, and patient care. The industrial sector also benefits from AR/MR applications, optimizing maintenance, training, and design processes. Growth is further propelled by the increasing integration of AR/MR technology into existing devices like smartphones and tablets, expanding its accessibility.
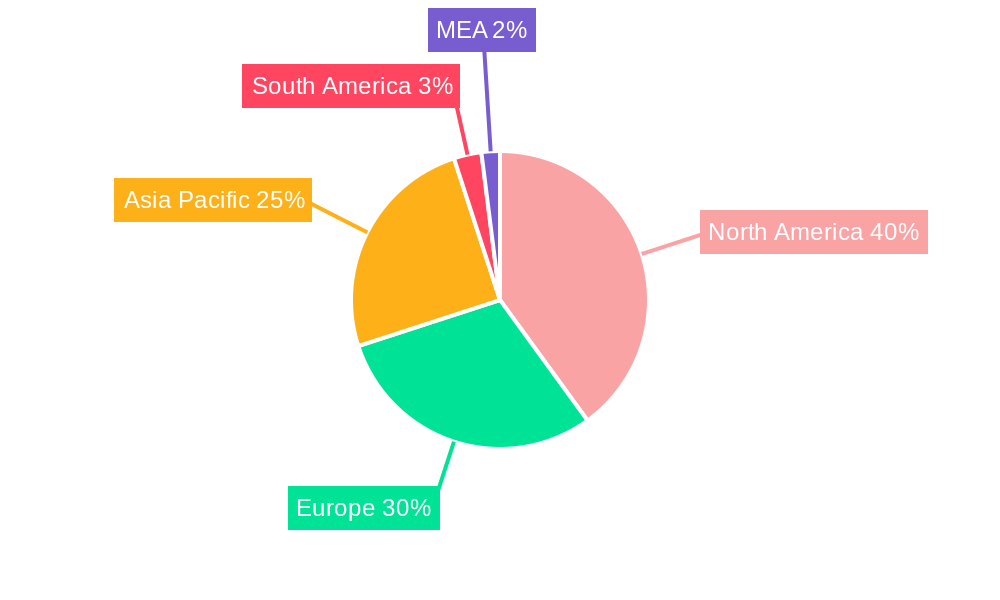
Despite the rapid growth, certain restraints currently affect market expansion. High initial investment costs for hardware and software, along with the need for robust infrastructure and skilled workforce, present challenges for widespread adoption. Furthermore, concerns about data privacy and security, as well as user experience issues like motion sickness and visual fatigue, need to be addressed for broader market acceptance. However, ongoing technological advancements and increasing investments in research and development promise to overcome these challenges. The market segmentation by end-user vertical (Consumer, Medical and Healthcare, Industrial, and Other) illustrates the diverse applications and opportunities for growth within this dynamic sector. Regions like North America and Asia-Pacific are currently leading the market due to technological advancements and robust consumer bases. However, other regions are witnessing increasing adoption, suggesting a more globalized market in the coming years.
This detailed report provides a comprehensive analysis of the Augmented Reality (AR) & Mixed Reality (MR) market, offering invaluable insights for industry stakeholders, investors, and strategists. The study period spans from 2019 to 2033, with 2025 serving as the base and estimated year. The forecast period is 2025-2033, and the historical period covers 2019-2024. The report leverages extensive market research, incorporating data on market size, growth projections, key players, technological advancements, and emerging trends. This report is designed to provide actionable intelligence without requiring any further modification.
Augmented Reality & Mixed Reality Market Market Concentration & Innovation
The AR/MR market exhibits a moderately concentrated landscape, with several major players dominating specific segments. However, a significant number of smaller, specialized companies are driving innovation, particularly in niche applications. Market share analysis reveals that Google LLC (Alphabet Inc), Microsoft Corporation, and Samsung Electronics Company Limited hold substantial shares, but their dominance varies across segments. The overall market concentration ratio (CRx) is estimated at xx in 2025. Innovation is driven by advancements in display technologies (microLED, mLED), processing power, sensor technologies, and software development.
- Innovation Drivers: Miniaturization of components, improved battery life, development of more intuitive user interfaces, and the integration of AI capabilities.
- Regulatory Frameworks: Vary widely by region, impacting data privacy, safety standards, and commercial deployment of AR/MR applications.
- Product Substitutes: Traditional methods of information delivery and interaction (e.g., printed materials, physical prototypes) still hold relevance, but their market share is decreasing.
- End-User Trends: Increased adoption of AR/MR in consumer entertainment, gaming, and industrial applications. Medical and healthcare sectors are also witnessing rapid growth.
- M&A Activities: The AR/MR landscape has seen considerable M&A activity, with deals focused on acquiring specialized technologies or expanding market reach. The total value of M&A deals in the AR/MR sector during 2022 was estimated at $xx Million.
Augmented Reality & Mixed Reality Market Industry Trends & Insights
The AR/MR market is characterized by rapid growth, driven by technological advancements and increasing consumer adoption. The Compound Annual Growth Rate (CAGR) for the period 2025-2033 is projected to be xx%, resulting in a market size of $xx Million by 2033. Market penetration varies significantly across end-user verticals, with consumer applications leading the way, followed by the industrial sector. Technological disruptions, such as the development of more advanced displays and processing units, continue to drive innovation. Consumer preferences are shifting towards more immersive and interactive AR/MR experiences, influencing the design and features of new devices and applications. Competitive dynamics are shaping the market, with larger companies focusing on ecosystem development and smaller companies specializing in niche applications.
Dominant Markets & Segments in Augmented Reality & Mixed Reality Market
The North American region currently holds the largest market share in the AR/MR sector, driven by strong technological innovation, high consumer adoption rates, and robust investment. Within end-user verticals, the consumer segment displays significant growth potential due to gaming, entertainment, and e-commerce applications. The Industrial segment is experiencing substantial growth as AR/MR is integrated into manufacturing, maintenance, and training processes. The Medical and Healthcare segment shows significant promise driven by applications such as surgical guidance and remote patient monitoring.
- Key Drivers for North America: Strong technological base, high disposable income, and early adoption of new technologies.
- Key Drivers for Consumer Segment: Increasing smartphone penetration, rising demand for immersive gaming experiences, and the expansion of e-commerce augmented reality features.
- Key Drivers for Industrial Segment: Increased automation, demand for enhanced efficiency, and the need for improved worker training and safety.
- Key Drivers for Medical & Healthcare Segment: Demand for minimally invasive surgery, remote patient monitoring, and improved diagnostic tools.
Augmented Reality & Mixed Reality Market Product Developments
Recent years have seen significant advancements in AR/MR devices, leading to the development of lighter, more powerful, and more user-friendly devices. These advancements include improvements in display technology, processing power, and sensor capabilities, leading to more immersive and realistic experiences. New applications are continuously emerging across various sectors, showcasing the versatile nature of this technology. The market is characterized by a strong emphasis on integration with existing technologies and platforms, expanding market reach and application possibilities.
Report Scope & Segmentation Analysis
This report segments the AR/MR market by end-user vertical:
Consumer: This segment is projected to witness significant growth due to the increasing popularity of AR gaming and entertainment applications, as well as advancements in consumer-oriented AR devices. The market size is estimated at $xx Million in 2025, with a projected CAGR of xx%. Competition is fierce, with major technology companies vying for market share.
Medical and Healthcare: This segment is characterized by high growth potential, driven by the implementation of AR/MR in surgical guidance, medical training, and remote patient monitoring. The 2025 market size is estimated at $xx Million, with a projected CAGR of xx%. The regulatory landscape plays a significant role in market growth.
Industrial: This sector shows strong growth driven by increased efficiency and improved worker safety through applications in manufacturing, maintenance, and training. The 2025 market size is estimated at $xx Million, with a projected CAGR of xx%. Integration with existing industrial systems is a key challenge.
Other End-User Verticals (Education, Military, and Defense): This segment is characterized by varied applications, including interactive learning tools in education and advanced training simulations in the military and defense sectors. The 2025 market size is estimated at $xx Million, with a projected CAGR of xx%. Government regulations and security considerations are key factors.
Key Drivers of Augmented Reality & Mixed Reality Market Growth
The AR/MR market’s growth is propelled by technological advancements in display technologies (microLED, mLED), improved processing power, and enhanced sensor capabilities. Economic factors such as increasing disposable income and the willingness of consumers and businesses to invest in new technologies are also significant drivers. Furthermore, supportive government policies and regulatory frameworks are contributing to market expansion.
Challenges in the Augmented Reality & Mixed Reality Market Sector
The AR/MR market faces challenges such as high device costs, limited battery life, and concerns regarding data privacy and security. Supply chain disruptions and the need for robust infrastructure to support AR/MR applications pose additional obstacles. Competition from established technology companies and the entry of new players are intensifying competitive pressures, impacting market dynamics. The impact of these factors could collectively hinder the market growth by an estimated xx% annually.
Emerging Opportunities in Augmented Reality & Mixed Reality Market
The AR/MR market presents several emerging opportunities. New applications are emerging in areas such as remote collaboration, virtual tourism, and augmented reality-enhanced e-commerce. Advances in 5G and edge computing are paving the way for more immersive and responsive AR/MR experiences. Moreover, the integration of AR/MR with the metaverse is creating further opportunities for market expansion.
Leading Players in the Augmented Reality & Mixed Reality Market Market
- Dynabook Americas Inc (Sharp corporation)
- Samsung Electronics Company Limited
- TechSee Augmented Vision Ltd
- Acer Inc
- HP Development Company LP
- Magic Leap Inc
- Amber Garage (Holokit)
- Wikitude GMBH
- Google LLC (Alphabet Inc)
- Microsoft Corporation
- Vuzix Corporation
- Ultraleap Limited
- AsusTek Computer Inc
- Seiko Epson Corporation
- PTC Inc
- Niantic Inc
- Dell Technologies Inc
- Occipital Inc
- Realwear Inc
- Atheer Inc
- Optinvent
- Blippar com Ltd
Key Developments in Augmented Reality & Mixed Reality Market Industry
October 2022: Micledi Microdisplays and Kura Technologies announced a collaboration to manufacture AR glasses incorporating Micledi's 300mm microLED displays. This development signifies a significant advancement in AR display technology, paving the way for higher-resolution and more energy-efficient AR glasses.
May 2022: Vuzix Corporation's agreement with Atomistic SAS for custom backplane design and mLED technology licensing represents a strategic move to enhance its mLED-based AR glasses, potentially accelerating the development of advanced AR eyewear.
Strategic Outlook for Augmented Reality & Mixed Reality Market Market
The AR/MR market is poised for continued expansion, driven by technological advancements, increased consumer adoption, and the emergence of new applications across various sectors. The integration of AR/MR with other emerging technologies, such as the metaverse and 5G, promises to unlock further growth potential. Companies that invest in R&D, strategic partnerships, and innovative product development will be best positioned to capitalize on the expanding market opportunities.
Augmented Reality & Mixed Reality Market Segmentation
-
1. Type
- 1.1. Hardware
- 1.2. Software
-
2. End-user Vertical
- 2.1. Gaming
- 2.2. Education
- 2.3. Healthcare
- 2.4. Retail and Advertising
- 2.5. Automotive
- 2.6. Military and Defense
- 2.7. Other End-user Verticals
-
3. End-user Vertical
- 3.1. Consumer
- 3.2. Medical and Healthcare
- 3.3. Industrial
- 3.4. Other End-user
Augmented Reality & Mixed Reality Market Segmentation By Geography
- 1. North America
- 2. Europe
- 3. Asia Pacific
- 4. Rest of the World
- 5. North America
- 6. Europe
- 7. Asia Pacific
- 8. Rest of the World
Augmented Reality & Mixed Reality Market REPORT HIGHLIGHTS
| Aspects | Details |
|---|---|
| Study Period | 2019-2033 |
| Base Year | 2024 |
| Estimated Year | 2025 |
| Forecast Period | 2025-2033 |
| Historical Period | 2019-2024 |
| Growth Rate | CAGR of 41.50% from 2019-2033 |
| Segmentation |
|
Table of Contents
- 1. Introduction
- 1.1. Research Scope
- 1.2. Market Segmentation
- 1.3. Research Methodology
- 1.4. Definitions and Assumptions
- 2. Executive Summary
- 2.1. Introduction
- 3. Market Dynamics
- 3.1. Introduction
- 3.2. Market Drivers
- 3.2.1. Increasing Applications of Augmented Reality; High Demand for Mobile-based Augmented Reality
- 3.3. Market Restrains
- 3.3.1. Security Issues Associated with Mobile Payments
- 3.4. Market Trends
- 3.4.1. Increasing Applications of Augmented Reality Drives the Market Growth
- 4. Market Factor Analysis
- 4.1. Porters Five Forces
- 4.2. Supply/Value Chain
- 4.3. PESTEL analysis
- 4.4. Market Entropy
- 4.5. Patent/Trademark Analysis
- 5. Global Augmented Reality & Mixed Reality Market Analysis, Insights and Forecast, 2019-2031
- 5.1. Market Analysis, Insights and Forecast - by Type
- 5.1.1. Hardware
- 5.1.2. Software
- 5.2. Market Analysis, Insights and Forecast - by End-user Vertical
- 5.2.1. Gaming
- 5.2.2. Education
- 5.2.3. Healthcare
- 5.2.4. Retail and Advertising
- 5.2.5. Automotive
- 5.2.6. Military and Defense
- 5.2.7. Other End-user Verticals
- 5.3. Market Analysis, Insights and Forecast - by End-user Vertical
- 5.3.1. Consumer
- 5.3.2. Medical and Healthcare
- 5.3.3. Industrial
- 5.3.4. Other End-user
- 5.4. Market Analysis, Insights and Forecast - by Region
- 5.4.1. North America
- 5.4.2. Europe
- 5.4.3. Asia Pacific
- 5.4.4. Rest of the World
- 5.4.5. North America
- 5.4.6. Europe
- 5.4.7. Asia Pacific
- 5.4.8. Rest of the World
- 5.1. Market Analysis, Insights and Forecast - by Type
- 6. North America Augmented Reality & Mixed Reality Market Analysis, Insights and Forecast, 2019-2031
- 6.1. Market Analysis, Insights and Forecast - by Type
- 6.1.1. Hardware
- 6.1.2. Software
- 6.2. Market Analysis, Insights and Forecast - by End-user Vertical
- 6.2.1. Gaming
- 6.2.2. Education
- 6.2.3. Healthcare
- 6.2.4. Retail and Advertising
- 6.2.5. Automotive
- 6.2.6. Military and Defense
- 6.2.7. Other End-user Verticals
- 6.3. Market Analysis, Insights and Forecast - by End-user Vertical
- 6.3.1. Consumer
- 6.3.2. Medical and Healthcare
- 6.3.3. Industrial
- 6.3.4. Other End-user
- 6.1. Market Analysis, Insights and Forecast - by Type
- 7. Europe Augmented Reality & Mixed Reality Market Analysis, Insights and Forecast, 2019-2031
- 7.1. Market Analysis, Insights and Forecast - by Type
- 7.1.1. Hardware
- 7.1.2. Software
- 7.2. Market Analysis, Insights and Forecast - by End-user Vertical
- 7.2.1. Gaming
- 7.2.2. Education
- 7.2.3. Healthcare
- 7.2.4. Retail and Advertising
- 7.2.5. Automotive
- 7.2.6. Military and Defense
- 7.2.7. Other End-user Verticals
- 7.3. Market Analysis, Insights and Forecast - by End-user Vertical
- 7.3.1. Consumer
- 7.3.2. Medical and Healthcare
- 7.3.3. Industrial
- 7.3.4. Other End-user
- 7.1. Market Analysis, Insights and Forecast - by Type
- 8. Asia Pacific Augmented Reality & Mixed Reality Market Analysis, Insights and Forecast, 2019-2031
- 8.1. Market Analysis, Insights and Forecast - by Type
- 8.1.1. Hardware
- 8.1.2. Software
- 8.2. Market Analysis, Insights and Forecast - by End-user Vertical
- 8.2.1. Gaming
- 8.2.2. Education
- 8.2.3. Healthcare
- 8.2.4. Retail and Advertising
- 8.2.5. Automotive
- 8.2.6. Military and Defense
- 8.2.7. Other End-user Verticals
- 8.3. Market Analysis, Insights and Forecast - by End-user Vertical
- 8.3.1. Consumer
- 8.3.2. Medical and Healthcare
- 8.3.3. Industrial
- 8.3.4. Other End-user
- 8.1. Market Analysis, Insights and Forecast - by Type
- 9. Rest of the World Augmented Reality & Mixed Reality Market Analysis, Insights and Forecast, 2019-2031
- 9.1. Market Analysis, Insights and Forecast - by Type
- 9.1.1. Hardware
- 9.1.2. Software
- 9.2. Market Analysis, Insights and Forecast - by End-user Vertical
- 9.2.1. Gaming
- 9.2.2. Education
- 9.2.3. Healthcare
- 9.2.4. Retail and Advertising
- 9.2.5. Automotive
- 9.2.6. Military and Defense
- 9.2.7. Other End-user Verticals
- 9.3. Market Analysis, Insights and Forecast - by End-user Vertical
- 9.3.1. Consumer
- 9.3.2. Medical and Healthcare
- 9.3.3. Industrial
- 9.3.4. Other End-user
- 9.1. Market Analysis, Insights and Forecast - by Type
- 10. North America Augmented Reality & Mixed Reality Market Analysis, Insights and Forecast, 2019-2031
- 10.1. Market Analysis, Insights and Forecast - by Type
- 10.1.1. Hardware
- 10.1.2. Software
- 10.2. Market Analysis, Insights and Forecast - by End-user Vertical
- 10.2.1. Gaming
- 10.2.2. Education
- 10.2.3. Healthcare
- 10.2.4. Retail and Advertising
- 10.2.5. Automotive
- 10.2.6. Military and Defense
- 10.2.7. Other End-user Verticals
- 10.3. Market Analysis, Insights and Forecast - by End-user Vertical
- 10.3.1. Consumer
- 10.3.2. Medical and Healthcare
- 10.3.3. Industrial
- 10.3.4. Other End-user
- 10.1. Market Analysis, Insights and Forecast - by Type
- 11. Europe Augmented Reality & Mixed Reality Market Analysis, Insights and Forecast, 2019-2031
- 11.1. Market Analysis, Insights and Forecast - by Type
- 11.1.1. Hardware
- 11.1.2. Software
- 11.2. Market Analysis, Insights and Forecast - by End-user Vertical
- 11.2.1. Gaming
- 11.2.2. Education
- 11.2.3. Healthcare
- 11.2.4. Retail and Advertising
- 11.2.5. Automotive
- 11.2.6. Military and Defense
- 11.2.7. Other End-user Verticals
- 11.3. Market Analysis, Insights and Forecast - by End-user Vertical
- 11.3.1. Consumer
- 11.3.2. Medical and Healthcare
- 11.3.3. Industrial
- 11.3.4. Other End-user
- 11.1. Market Analysis, Insights and Forecast - by Type
- 12. Asia Pacific Augmented Reality & Mixed Reality Market Analysis, Insights and Forecast, 2019-2031
- 12.1. Market Analysis, Insights and Forecast - by Type
- 12.1.1. Hardware
- 12.1.2. Software
- 12.2. Market Analysis, Insights and Forecast - by End-user Vertical
- 12.2.1. Gaming
- 12.2.2. Education
- 12.2.3. Healthcare
- 12.2.4. Retail and Advertising
- 12.2.5. Automotive
- 12.2.6. Military and Defense
- 12.2.7. Other End-user Verticals
- 12.3. Market Analysis, Insights and Forecast - by End-user Vertical
- 12.3.1. Consumer
- 12.3.2. Medical and Healthcare
- 12.3.3. Industrial
- 12.3.4. Other End-user
- 12.1. Market Analysis, Insights and Forecast - by Type
- 13. Rest of the World Augmented Reality & Mixed Reality Market Analysis, Insights and Forecast, 2019-2031
- 13.1. Market Analysis, Insights and Forecast - by Type
- 13.1.1. Hardware
- 13.1.2. Software
- 13.2. Market Analysis, Insights and Forecast - by End-user Vertical
- 13.2.1. Gaming
- 13.2.2. Education
- 13.2.3. Healthcare
- 13.2.4. Retail and Advertising
- 13.2.5. Automotive
- 13.2.6. Military and Defense
- 13.2.7. Other End-user Verticals
- 13.3. Market Analysis, Insights and Forecast - by End-user Vertical
- 13.3.1. Consumer
- 13.3.2. Medical and Healthcare
- 13.3.3. Industrial
- 13.3.4. Other End-user
- 13.1. Market Analysis, Insights and Forecast - by Type
- 14. North America Augmented Reality & Mixed Reality Market Analysis, Insights and Forecast, 2019-2031
- 14.1. Market Analysis, Insights and Forecast - By Country/Sub-region
- 14.1.1 United States
- 14.1.2 Canada
- 14.1.3 Mexico
- 15. Europe Augmented Reality & Mixed Reality Market Analysis, Insights and Forecast, 2019-2031
- 15.1. Market Analysis, Insights and Forecast - By Country/Sub-region
- 15.1.1 Germany
- 15.1.2 United Kingdom
- 15.1.3 France
- 15.1.4 Spain
- 15.1.5 Italy
- 15.1.6 Spain
- 15.1.7 Belgium
- 15.1.8 Netherland
- 15.1.9 Nordics
- 15.1.10 Rest of Europe
- 16. Asia Pacific Augmented Reality & Mixed Reality Market Analysis, Insights and Forecast, 2019-2031
- 16.1. Market Analysis, Insights and Forecast - By Country/Sub-region
- 16.1.1 China
- 16.1.2 Japan
- 16.1.3 India
- 16.1.4 South Korea
- 16.1.5 Southeast Asia
- 16.1.6 Australia
- 16.1.7 Indonesia
- 16.1.8 Phillipes
- 16.1.9 Singapore
- 16.1.10 Thailandc
- 16.1.11 Rest of Asia Pacific
- 17. South America Augmented Reality & Mixed Reality Market Analysis, Insights and Forecast, 2019-2031
- 17.1. Market Analysis, Insights and Forecast - By Country/Sub-region
- 17.1.1 Brazil
- 17.1.2 Argentina
- 17.1.3 Peru
- 17.1.4 Chile
- 17.1.5 Colombia
- 17.1.6 Ecuador
- 17.1.7 Venezuela
- 17.1.8 Rest of South America
- 18. North America Augmented Reality & Mixed Reality Market Analysis, Insights and Forecast, 2019-2031
- 18.1. Market Analysis, Insights and Forecast - By Country/Sub-region
- 18.1.1 United States
- 18.1.2 Canada
- 18.1.3 Mexico
- 19. MEA Augmented Reality & Mixed Reality Market Analysis, Insights and Forecast, 2019-2031
- 19.1. Market Analysis, Insights and Forecast - By Country/Sub-region
- 19.1.1 United Arab Emirates
- 19.1.2 Saudi Arabia
- 19.1.3 South Africa
- 19.1.4 Rest of Middle East and Africa
- 20. Competitive Analysis
- 20.1. Global Market Share Analysis 2024
- 20.2. Company Profiles
- 20.2.1 Dynabook Americas Inc (Sharp corporation)
- 20.2.1.1. Overview
- 20.2.1.2. Products
- 20.2.1.3. SWOT Analysis
- 20.2.1.4. Recent Developments
- 20.2.1.5. Financials (Based on Availability)
- 20.2.2 Samsung Electronics Company Limited
- 20.2.2.1. Overview
- 20.2.2.2. Products
- 20.2.2.3. SWOT Analysis
- 20.2.2.4. Recent Developments
- 20.2.2.5. Financials (Based on Availability)
- 20.2.3 TechSee Augmented Vision Ltd
- 20.2.3.1. Overview
- 20.2.3.2. Products
- 20.2.3.3. SWOT Analysis
- 20.2.3.4. Recent Developments
- 20.2.3.5. Financials (Based on Availability)
- 20.2.4 Acer Inc
- 20.2.4.1. Overview
- 20.2.4.2. Products
- 20.2.4.3. SWOT Analysis
- 20.2.4.4. Recent Developments
- 20.2.4.5. Financials (Based on Availability)
- 20.2.5 HP Development Company LP
- 20.2.5.1. Overview
- 20.2.5.2. Products
- 20.2.5.3. SWOT Analysis
- 20.2.5.4. Recent Developments
- 20.2.5.5. Financials (Based on Availability)
- 20.2.6 Magic Leap Inc
- 20.2.6.1. Overview
- 20.2.6.2. Products
- 20.2.6.3. SWOT Analysis
- 20.2.6.4. Recent Developments
- 20.2.6.5. Financials (Based on Availability)
- 20.2.7 Amber Garage (Holokit)
- 20.2.7.1. Overview
- 20.2.7.2. Products
- 20.2.7.3. SWOT Analysis
- 20.2.7.4. Recent Developments
- 20.2.7.5. Financials (Based on Availability)
- 20.2.8 Wikitude GMBH
- 20.2.8.1. Overview
- 20.2.8.2. Products
- 20.2.8.3. SWOT Analysis
- 20.2.8.4. Recent Developments
- 20.2.8.5. Financials (Based on Availability)
- 20.2.9 Google LLC (Alphabet Inc )
- 20.2.9.1. Overview
- 20.2.9.2. Products
- 20.2.9.3. SWOT Analysis
- 20.2.9.4. Recent Developments
- 20.2.9.5. Financials (Based on Availability)
- 20.2.10 Microsoft Corporation
- 20.2.10.1. Overview
- 20.2.10.2. Products
- 20.2.10.3. SWOT Analysis
- 20.2.10.4. Recent Developments
- 20.2.10.5. Financials (Based on Availability)
- 20.2.11 Vuzix Corporation
- 20.2.11.1. Overview
- 20.2.11.2. Products
- 20.2.11.3. SWOT Analysis
- 20.2.11.4. Recent Developments
- 20.2.11.5. Financials (Based on Availability)
- 20.2.12 Ultraleap Limited
- 20.2.12.1. Overview
- 20.2.12.2. Products
- 20.2.12.3. SWOT Analysis
- 20.2.12.4. Recent Developments
- 20.2.12.5. Financials (Based on Availability)
- 20.2.13 AsusTek Computer Inc
- 20.2.13.1. Overview
- 20.2.13.2. Products
- 20.2.13.3. SWOT Analysis
- 20.2.13.4. Recent Developments
- 20.2.13.5. Financials (Based on Availability)
- 20.2.14 Seiko Epson Corporation
- 20.2.14.1. Overview
- 20.2.14.2. Products
- 20.2.14.3. SWOT Analysis
- 20.2.14.4. Recent Developments
- 20.2.14.5. Financials (Based on Availability)
- 20.2.15 PTC Inc
- 20.2.15.1. Overview
- 20.2.15.2. Products
- 20.2.15.3. SWOT Analysis
- 20.2.15.4. Recent Developments
- 20.2.15.5. Financials (Based on Availability)
- 20.2.16 Niantic Inc
- 20.2.16.1. Overview
- 20.2.16.2. Products
- 20.2.16.3. SWOT Analysis
- 20.2.16.4. Recent Developments
- 20.2.16.5. Financials (Based on Availability)
- 20.2.17 Dell Technologies Inc
- 20.2.17.1. Overview
- 20.2.17.2. Products
- 20.2.17.3. SWOT Analysis
- 20.2.17.4. Recent Developments
- 20.2.17.5. Financials (Based on Availability)
- 20.2.18 Occipital Inc
- 20.2.18.1. Overview
- 20.2.18.2. Products
- 20.2.18.3. SWOT Analysis
- 20.2.18.4. Recent Developments
- 20.2.18.5. Financials (Based on Availability)
- 20.2.19 Realwear Inc
- 20.2.19.1. Overview
- 20.2.19.2. Products
- 20.2.19.3. SWOT Analysis
- 20.2.19.4. Recent Developments
- 20.2.19.5. Financials (Based on Availability)
- 20.2.20 Atheer Inc
- 20.2.20.1. Overview
- 20.2.20.2. Products
- 20.2.20.3. SWOT Analysis
- 20.2.20.4. Recent Developments
- 20.2.20.5. Financials (Based on Availability)
- 20.2.21 Optinvent
- 20.2.21.1. Overview
- 20.2.21.2. Products
- 20.2.21.3. SWOT Analysis
- 20.2.21.4. Recent Developments
- 20.2.21.5. Financials (Based on Availability)
- 20.2.22 Blippar com Ltd
- 20.2.22.1. Overview
- 20.2.22.2. Products
- 20.2.22.3. SWOT Analysis
- 20.2.22.4. Recent Developments
- 20.2.22.5. Financials (Based on Availability)
- 20.2.1 Dynabook Americas Inc (Sharp corporation)
List of Figures
- Figure 1: Global Augmented Reality & Mixed Reality Market Revenue Breakdown (Million, %) by Region 2024 & 2032
- Figure 2: Global Augmented Reality & Mixed Reality Market Volume Breakdown (K Unit, %) by Region 2024 & 2032
- Figure 3: North America Augmented Reality & Mixed Reality Market Revenue (Million), by Country 2024 & 2032
- Figure 4: North America Augmented Reality & Mixed Reality Market Volume (K Unit), by Country 2024 & 2032
- Figure 5: North America Augmented Reality & Mixed Reality Market Revenue Share (%), by Country 2024 & 2032
- Figure 6: North America Augmented Reality & Mixed Reality Market Volume Share (%), by Country 2024 & 2032
- Figure 7: Europe Augmented Reality & Mixed Reality Market Revenue (Million), by Country 2024 & 2032
- Figure 8: Europe Augmented Reality & Mixed Reality Market Volume (K Unit), by Country 2024 & 2032
- Figure 9: Europe Augmented Reality & Mixed Reality Market Revenue Share (%), by Country 2024 & 2032
- Figure 10: Europe Augmented Reality & Mixed Reality Market Volume Share (%), by Country 2024 & 2032
- Figure 11: Asia Pacific Augmented Reality & Mixed Reality Market Revenue (Million), by Country 2024 & 2032
- Figure 12: Asia Pacific Augmented Reality & Mixed Reality Market Volume (K Unit), by Country 2024 & 2032
- Figure 13: Asia Pacific Augmented Reality & Mixed Reality Market Revenue Share (%), by Country 2024 & 2032
- Figure 14: Asia Pacific Augmented Reality & Mixed Reality Market Volume Share (%), by Country 2024 & 2032
- Figure 15: South America Augmented Reality & Mixed Reality Market Revenue (Million), by Country 2024 & 2032
- Figure 16: South America Augmented Reality & Mixed Reality Market Volume (K Unit), by Country 2024 & 2032
- Figure 17: South America Augmented Reality & Mixed Reality Market Revenue Share (%), by Country 2024 & 2032
- Figure 18: South America Augmented Reality & Mixed Reality Market Volume Share (%), by Country 2024 & 2032
- Figure 19: North America Augmented Reality & Mixed Reality Market Revenue (Million), by Country 2024 & 2032
- Figure 20: North America Augmented Reality & Mixed Reality Market Volume (K Unit), by Country 2024 & 2032
- Figure 21: North America Augmented Reality & Mixed Reality Market Revenue Share (%), by Country 2024 & 2032
- Figure 22: North America Augmented Reality & Mixed Reality Market Volume Share (%), by Country 2024 & 2032
- Figure 23: MEA Augmented Reality & Mixed Reality Market Revenue (Million), by Country 2024 & 2032
- Figure 24: MEA Augmented Reality & Mixed Reality Market Volume (K Unit), by Country 2024 & 2032
- Figure 25: MEA Augmented Reality & Mixed Reality Market Revenue Share (%), by Country 2024 & 2032
- Figure 26: MEA Augmented Reality & Mixed Reality Market Volume Share (%), by Country 2024 & 2032
- Figure 27: North America Augmented Reality & Mixed Reality Market Revenue (Million), by Type 2024 & 2032
- Figure 28: North America Augmented Reality & Mixed Reality Market Volume (K Unit), by Type 2024 & 2032
- Figure 29: North America Augmented Reality & Mixed Reality Market Revenue Share (%), by Type 2024 & 2032
- Figure 30: North America Augmented Reality & Mixed Reality Market Volume Share (%), by Type 2024 & 2032
- Figure 31: North America Augmented Reality & Mixed Reality Market Revenue (Million), by End-user Vertical 2024 & 2032
- Figure 32: North America Augmented Reality & Mixed Reality Market Volume (K Unit), by End-user Vertical 2024 & 2032
- Figure 33: North America Augmented Reality & Mixed Reality Market Revenue Share (%), by End-user Vertical 2024 & 2032
- Figure 34: North America Augmented Reality & Mixed Reality Market Volume Share (%), by End-user Vertical 2024 & 2032
- Figure 35: North America Augmented Reality & Mixed Reality Market Revenue (Million), by End-user Vertical 2024 & 2032
- Figure 36: North America Augmented Reality & Mixed Reality Market Volume (K Unit), by End-user Vertical 2024 & 2032
- Figure 37: North America Augmented Reality & Mixed Reality Market Revenue Share (%), by End-user Vertical 2024 & 2032
- Figure 38: North America Augmented Reality & Mixed Reality Market Volume Share (%), by End-user Vertical 2024 & 2032
- Figure 39: North America Augmented Reality & Mixed Reality Market Revenue (Million), by Country 2024 & 2032
- Figure 40: North America Augmented Reality & Mixed Reality Market Volume (K Unit), by Country 2024 & 2032
- Figure 41: North America Augmented Reality & Mixed Reality Market Revenue Share (%), by Country 2024 & 2032
- Figure 42: North America Augmented Reality & Mixed Reality Market Volume Share (%), by Country 2024 & 2032
- Figure 43: Europe Augmented Reality & Mixed Reality Market Revenue (Million), by Type 2024 & 2032
- Figure 44: Europe Augmented Reality & Mixed Reality Market Volume (K Unit), by Type 2024 & 2032
- Figure 45: Europe Augmented Reality & Mixed Reality Market Revenue Share (%), by Type 2024 & 2032
- Figure 46: Europe Augmented Reality & Mixed Reality Market Volume Share (%), by Type 2024 & 2032
- Figure 47: Europe Augmented Reality & Mixed Reality Market Revenue (Million), by End-user Vertical 2024 & 2032
- Figure 48: Europe Augmented Reality & Mixed Reality Market Volume (K Unit), by End-user Vertical 2024 & 2032
- Figure 49: Europe Augmented Reality & Mixed Reality Market Revenue Share (%), by End-user Vertical 2024 & 2032
- Figure 50: Europe Augmented Reality & Mixed Reality Market Volume Share (%), by End-user Vertical 2024 & 2032
- Figure 51: Europe Augmented Reality & Mixed Reality Market Revenue (Million), by End-user Vertical 2024 & 2032
- Figure 52: Europe Augmented Reality & Mixed Reality Market Volume (K Unit), by End-user Vertical 2024 & 2032
- Figure 53: Europe Augmented Reality & Mixed Reality Market Revenue Share (%), by End-user Vertical 2024 & 2032
- Figure 54: Europe Augmented Reality & Mixed Reality Market Volume Share (%), by End-user Vertical 2024 & 2032
- Figure 55: Europe Augmented Reality & Mixed Reality Market Revenue (Million), by Country 2024 & 2032
- Figure 56: Europe Augmented Reality & Mixed Reality Market Volume (K Unit), by Country 2024 & 2032
- Figure 57: Europe Augmented Reality & Mixed Reality Market Revenue Share (%), by Country 2024 & 2032
- Figure 58: Europe Augmented Reality & Mixed Reality Market Volume Share (%), by Country 2024 & 2032
- Figure 59: Asia Pacific Augmented Reality & Mixed Reality Market Revenue (Million), by Type 2024 & 2032
- Figure 60: Asia Pacific Augmented Reality & Mixed Reality Market Volume (K Unit), by Type 2024 & 2032
- Figure 61: Asia Pacific Augmented Reality & Mixed Reality Market Revenue Share (%), by Type 2024 & 2032
- Figure 62: Asia Pacific Augmented Reality & Mixed Reality Market Volume Share (%), by Type 2024 & 2032
- Figure 63: Asia Pacific Augmented Reality & Mixed Reality Market Revenue (Million), by End-user Vertical 2024 & 2032
- Figure 64: Asia Pacific Augmented Reality & Mixed Reality Market Volume (K Unit), by End-user Vertical 2024 & 2032
- Figure 65: Asia Pacific Augmented Reality & Mixed Reality Market Revenue Share (%), by End-user Vertical 2024 & 2032
- Figure 66: Asia Pacific Augmented Reality & Mixed Reality Market Volume Share (%), by End-user Vertical 2024 & 2032
- Figure 67: Asia Pacific Augmented Reality & Mixed Reality Market Revenue (Million), by End-user Vertical 2024 & 2032
- Figure 68: Asia Pacific Augmented Reality & Mixed Reality Market Volume (K Unit), by End-user Vertical 2024 & 2032
- Figure 69: Asia Pacific Augmented Reality & Mixed Reality Market Revenue Share (%), by End-user Vertical 2024 & 2032
- Figure 70: Asia Pacific Augmented Reality & Mixed Reality Market Volume Share (%), by End-user Vertical 2024 & 2032
- Figure 71: Asia Pacific Augmented Reality & Mixed Reality Market Revenue (Million), by Country 2024 & 2032
- Figure 72: Asia Pacific Augmented Reality & Mixed Reality Market Volume (K Unit), by Country 2024 & 2032
- Figure 73: Asia Pacific Augmented Reality & Mixed Reality Market Revenue Share (%), by Country 2024 & 2032
- Figure 74: Asia Pacific Augmented Reality & Mixed Reality Market Volume Share (%), by Country 2024 & 2032
- Figure 75: Rest of the World Augmented Reality & Mixed Reality Market Revenue (Million), by Type 2024 & 2032
- Figure 76: Rest of the World Augmented Reality & Mixed Reality Market Volume (K Unit), by Type 2024 & 2032
- Figure 77: Rest of the World Augmented Reality & Mixed Reality Market Revenue Share (%), by Type 2024 & 2032
- Figure 78: Rest of the World Augmented Reality & Mixed Reality Market Volume Share (%), by Type 2024 & 2032
- Figure 79: Rest of the World Augmented Reality & Mixed Reality Market Revenue (Million), by End-user Vertical 2024 & 2032
- Figure 80: Rest of the World Augmented Reality & Mixed Reality Market Volume (K Unit), by End-user Vertical 2024 & 2032
- Figure 81: Rest of the World Augmented Reality & Mixed Reality Market Revenue Share (%), by End-user Vertical 2024 & 2032
- Figure 82: Rest of the World Augmented Reality & Mixed Reality Market Volume Share (%), by End-user Vertical 2024 & 2032
- Figure 83: Rest of the World Augmented Reality & Mixed Reality Market Revenue (Million), by End-user Vertical 2024 & 2032
- Figure 84: Rest of the World Augmented Reality & Mixed Reality Market Volume (K Unit), by End-user Vertical 2024 & 2032
- Figure 85: Rest of the World Augmented Reality & Mixed Reality Market Revenue Share (%), by End-user Vertical 2024 & 2032
- Figure 86: Rest of the World Augmented Reality & Mixed Reality Market Volume Share (%), by End-user Vertical 2024 & 2032
- Figure 87: Rest of the World Augmented Reality & Mixed Reality Market Revenue (Million), by Country 2024 & 2032
- Figure 88: Rest of the World Augmented Reality & Mixed Reality Market Volume (K Unit), by Country 2024 & 2032
- Figure 89: Rest of the World Augmented Reality & Mixed Reality Market Revenue Share (%), by Country 2024 & 2032
- Figure 90: Rest of the World Augmented Reality & Mixed Reality Market Volume Share (%), by Country 2024 & 2032
- Figure 91: North America Augmented Reality & Mixed Reality Market Revenue (Million), by Type 2024 & 2032
- Figure 92: North America Augmented Reality & Mixed Reality Market Volume (K Unit), by Type 2024 & 2032
- Figure 93: North America Augmented Reality & Mixed Reality Market Revenue Share (%), by Type 2024 & 2032
- Figure 94: North America Augmented Reality & Mixed Reality Market Volume Share (%), by Type 2024 & 2032
- Figure 95: North America Augmented Reality & Mixed Reality Market Revenue (Million), by End-user Vertical 2024 & 2032
- Figure 96: North America Augmented Reality & Mixed Reality Market Volume (K Unit), by End-user Vertical 2024 & 2032
- Figure 97: North America Augmented Reality & Mixed Reality Market Revenue Share (%), by End-user Vertical 2024 & 2032
- Figure 98: North America Augmented Reality & Mixed Reality Market Volume Share (%), by End-user Vertical 2024 & 2032
- Figure 99: North America Augmented Reality & Mixed Reality Market Revenue (Million), by End-user Vertical 2024 & 2032
- Figure 100: North America Augmented Reality & Mixed Reality Market Volume (K Unit), by End-user Vertical 2024 & 2032
- Figure 101: North America Augmented Reality & Mixed Reality Market Revenue Share (%), by End-user Vertical 2024 & 2032
- Figure 102: North America Augmented Reality & Mixed Reality Market Volume Share (%), by End-user Vertical 2024 & 2032
- Figure 103: North America Augmented Reality & Mixed Reality Market Revenue (Million), by Country 2024 & 2032
- Figure 104: North America Augmented Reality & Mixed Reality Market Volume (K Unit), by Country 2024 & 2032
- Figure 105: North America Augmented Reality & Mixed Reality Market Revenue Share (%), by Country 2024 & 2032
- Figure 106: North America Augmented Reality & Mixed Reality Market Volume Share (%), by Country 2024 & 2032
- Figure 107: Europe Augmented Reality & Mixed Reality Market Revenue (Million), by Type 2024 & 2032
- Figure 108: Europe Augmented Reality & Mixed Reality Market Volume (K Unit), by Type 2024 & 2032
- Figure 109: Europe Augmented Reality & Mixed Reality Market Revenue Share (%), by Type 2024 & 2032
- Figure 110: Europe Augmented Reality & Mixed Reality Market Volume Share (%), by Type 2024 & 2032
- Figure 111: Europe Augmented Reality & Mixed Reality Market Revenue (Million), by End-user Vertical 2024 & 2032
- Figure 112: Europe Augmented Reality & Mixed Reality Market Volume (K Unit), by End-user Vertical 2024 & 2032
- Figure 113: Europe Augmented Reality & Mixed Reality Market Revenue Share (%), by End-user Vertical 2024 & 2032
- Figure 114: Europe Augmented Reality & Mixed Reality Market Volume Share (%), by End-user Vertical 2024 & 2032
- Figure 115: Europe Augmented Reality & Mixed Reality Market Revenue (Million), by End-user Vertical 2024 & 2032
- Figure 116: Europe Augmented Reality & Mixed Reality Market Volume (K Unit), by End-user Vertical 2024 & 2032
- Figure 117: Europe Augmented Reality & Mixed Reality Market Revenue Share (%), by End-user Vertical 2024 & 2032
- Figure 118: Europe Augmented Reality & Mixed Reality Market Volume Share (%), by End-user Vertical 2024 & 2032
- Figure 119: Europe Augmented Reality & Mixed Reality Market Revenue (Million), by Country 2024 & 2032
- Figure 120: Europe Augmented Reality & Mixed Reality Market Volume (K Unit), by Country 2024 & 2032
- Figure 121: Europe Augmented Reality & Mixed Reality Market Revenue Share (%), by Country 2024 & 2032
- Figure 122: Europe Augmented Reality & Mixed Reality Market Volume Share (%), by Country 2024 & 2032
- Figure 123: Asia Pacific Augmented Reality & Mixed Reality Market Revenue (Million), by Type 2024 & 2032
- Figure 124: Asia Pacific Augmented Reality & Mixed Reality Market Volume (K Unit), by Type 2024 & 2032
- Figure 125: Asia Pacific Augmented Reality & Mixed Reality Market Revenue Share (%), by Type 2024 & 2032
- Figure 126: Asia Pacific Augmented Reality & Mixed Reality Market Volume Share (%), by Type 2024 & 2032
- Figure 127: Asia Pacific Augmented Reality & Mixed Reality Market Revenue (Million), by End-user Vertical 2024 & 2032
- Figure 128: Asia Pacific Augmented Reality & Mixed Reality Market Volume (K Unit), by End-user Vertical 2024 & 2032
- Figure 129: Asia Pacific Augmented Reality & Mixed Reality Market Revenue Share (%), by End-user Vertical 2024 & 2032
- Figure 130: Asia Pacific Augmented Reality & Mixed Reality Market Volume Share (%), by End-user Vertical 2024 & 2032
- Figure 131: Asia Pacific Augmented Reality & Mixed Reality Market Revenue (Million), by End-user Vertical 2024 & 2032
- Figure 132: Asia Pacific Augmented Reality & Mixed Reality Market Volume (K Unit), by End-user Vertical 2024 & 2032
- Figure 133: Asia Pacific Augmented Reality & Mixed Reality Market Revenue Share (%), by End-user Vertical 2024 & 2032
- Figure 134: Asia Pacific Augmented Reality & Mixed Reality Market Volume Share (%), by End-user Vertical 2024 & 2032
- Figure 135: Asia Pacific Augmented Reality & Mixed Reality Market Revenue (Million), by Country 2024 & 2032
- Figure 136: Asia Pacific Augmented Reality & Mixed Reality Market Volume (K Unit), by Country 2024 & 2032
- Figure 137: Asia Pacific Augmented Reality & Mixed Reality Market Revenue Share (%), by Country 2024 & 2032
- Figure 138: Asia Pacific Augmented Reality & Mixed Reality Market Volume Share (%), by Country 2024 & 2032
- Figure 139: Rest of the World Augmented Reality & Mixed Reality Market Revenue (Million), by Type 2024 & 2032
- Figure 140: Rest of the World Augmented Reality & Mixed Reality Market Volume (K Unit), by Type 2024 & 2032
- Figure 141: Rest of the World Augmented Reality & Mixed Reality Market Revenue Share (%), by Type 2024 & 2032
- Figure 142: Rest of the World Augmented Reality & Mixed Reality Market Volume Share (%), by Type 2024 & 2032
- Figure 143: Rest of the World Augmented Reality & Mixed Reality Market Revenue (Million), by End-user Vertical 2024 & 2032
- Figure 144: Rest of the World Augmented Reality & Mixed Reality Market Volume (K Unit), by End-user Vertical 2024 & 2032
- Figure 145: Rest of the World Augmented Reality & Mixed Reality Market Revenue Share (%), by End-user Vertical 2024 & 2032
- Figure 146: Rest of the World Augmented Reality & Mixed Reality Market Volume Share (%), by End-user Vertical 2024 & 2032
- Figure 147: Rest of the World Augmented Reality & Mixed Reality Market Revenue (Million), by End-user Vertical 2024 & 2032
- Figure 148: Rest of the World Augmented Reality & Mixed Reality Market Volume (K Unit), by End-user Vertical 2024 & 2032
- Figure 149: Rest of the World Augmented Reality & Mixed Reality Market Revenue Share (%), by End-user Vertical 2024 & 2032
- Figure 150: Rest of the World Augmented Reality & Mixed Reality Market Volume Share (%), by End-user Vertical 2024 & 2032
- Figure 151: Rest of the World Augmented Reality & Mixed Reality Market Revenue (Million), by Country 2024 & 2032
- Figure 152: Rest of the World Augmented Reality & Mixed Reality Market Volume (K Unit), by Country 2024 & 2032
- Figure 153: Rest of the World Augmented Reality & Mixed Reality Market Revenue Share (%), by Country 2024 & 2032
- Figure 154: Rest of the World Augmented Reality & Mixed Reality Market Volume Share (%), by Country 2024 & 2032
List of Tables
- Table 1: Global Augmented Reality & Mixed Reality Market Revenue Million Forecast, by Region 2019 & 2032
- Table 2: Global Augmented Reality & Mixed Reality Market Volume K Unit Forecast, by Region 2019 & 2032
- Table 3: Global Augmented Reality & Mixed Reality Market Revenue Million Forecast, by Type 2019 & 2032
- Table 4: Global Augmented Reality & Mixed Reality Market Volume K Unit Forecast, by Type 2019 & 2032
- Table 5: Global Augmented Reality & Mixed Reality Market Revenue Million Forecast, by End-user Vertical 2019 & 2032
- Table 6: Global Augmented Reality & Mixed Reality Market Volume K Unit Forecast, by End-user Vertical 2019 & 2032
- Table 7: Global Augmented Reality & Mixed Reality Market Revenue Million Forecast, by End-user Vertical 2019 & 2032
- Table 8: Global Augmented Reality & Mixed Reality Market Volume K Unit Forecast, by End-user Vertical 2019 & 2032
- Table 9: Global Augmented Reality & Mixed Reality Market Revenue Million Forecast, by Region 2019 & 2032
- Table 10: Global Augmented Reality & Mixed Reality Market Volume K Unit Forecast, by Region 2019 & 2032
- Table 11: Global Augmented Reality & Mixed Reality Market Revenue Million Forecast, by Country 2019 & 2032
- Table 12: Global Augmented Reality & Mixed Reality Market Volume K Unit Forecast, by Country 2019 & 2032
- Table 13: United States Augmented Reality & Mixed Reality Market Revenue (Million) Forecast, by Application 2019 & 2032
- Table 14: United States Augmented Reality & Mixed Reality Market Volume (K Unit) Forecast, by Application 2019 & 2032
- Table 15: Canada Augmented Reality & Mixed Reality Market Revenue (Million) Forecast, by Application 2019 & 2032
- Table 16: Canada Augmented Reality & Mixed Reality Market Volume (K Unit) Forecast, by Application 2019 & 2032
- Table 17: Mexico Augmented Reality & Mixed Reality Market Revenue (Million) Forecast, by Application 2019 & 2032
- Table 18: Mexico Augmented Reality & Mixed Reality Market Volume (K Unit) Forecast, by Application 2019 & 2032
- Table 19: Global Augmented Reality & Mixed Reality Market Revenue Million Forecast, by Country 2019 & 2032
- Table 20: Global Augmented Reality & Mixed Reality Market Volume K Unit Forecast, by Country 2019 & 2032
- Table 21: Germany Augmented Reality & Mixed Reality Market Revenue (Million) Forecast, by Application 2019 & 2032
- Table 22: Germany Augmented Reality & Mixed Reality Market Volume (K Unit) Forecast, by Application 2019 & 2032
- Table 23: United Kingdom Augmented Reality & Mixed Reality Market Revenue (Million) Forecast, by Application 2019 & 2032
- Table 24: United Kingdom Augmented Reality & Mixed Reality Market Volume (K Unit) Forecast, by Application 2019 & 2032
- Table 25: France Augmented Reality & Mixed Reality Market Revenue (Million) Forecast, by Application 2019 & 2032
- Table 26: France Augmented Reality & Mixed Reality Market Volume (K Unit) Forecast, by Application 2019 & 2032
- Table 27: Spain Augmented Reality & Mixed Reality Market Revenue (Million) Forecast, by Application 2019 & 2032
- Table 28: Spain Augmented Reality & Mixed Reality Market Volume (K Unit) Forecast, by Application 2019 & 2032
- Table 29: Italy Augmented Reality & Mixed Reality Market Revenue (Million) Forecast, by Application 2019 & 2032
- Table 30: Italy Augmented Reality & Mixed Reality Market Volume (K Unit) Forecast, by Application 2019 & 2032
- Table 31: Spain Augmented Reality & Mixed Reality Market Revenue (Million) Forecast, by Application 2019 & 2032
- Table 32: Spain Augmented Reality & Mixed Reality Market Volume (K Unit) Forecast, by Application 2019 & 2032
- Table 33: Belgium Augmented Reality & Mixed Reality Market Revenue (Million) Forecast, by Application 2019 & 2032
- Table 34: Belgium Augmented Reality & Mixed Reality Market Volume (K Unit) Forecast, by Application 2019 & 2032
- Table 35: Netherland Augmented Reality & Mixed Reality Market Revenue (Million) Forecast, by Application 2019 & 2032
- Table 36: Netherland Augmented Reality & Mixed Reality Market Volume (K Unit) Forecast, by Application 2019 & 2032
- Table 37: Nordics Augmented Reality & Mixed Reality Market Revenue (Million) Forecast, by Application 2019 & 2032
- Table 38: Nordics Augmented Reality & Mixed Reality Market Volume (K Unit) Forecast, by Application 2019 & 2032
- Table 39: Rest of Europe Augmented Reality & Mixed Reality Market Revenue (Million) Forecast, by Application 2019 & 2032
- Table 40: Rest of Europe Augmented Reality & Mixed Reality Market Volume (K Unit) Forecast, by Application 2019 & 2032
- Table 41: Global Augmented Reality & Mixed Reality Market Revenue Million Forecast, by Country 2019 & 2032
- Table 42: Global Augmented Reality & Mixed Reality Market Volume K Unit Forecast, by Country 2019 & 2032
- Table 43: China Augmented Reality & Mixed Reality Market Revenue (Million) Forecast, by Application 2019 & 2032
- Table 44: China Augmented Reality & Mixed Reality Market Volume (K Unit) Forecast, by Application 2019 & 2032
- Table 45: Japan Augmented Reality & Mixed Reality Market Revenue (Million) Forecast, by Application 2019 & 2032
- Table 46: Japan Augmented Reality & Mixed Reality Market Volume (K Unit) Forecast, by Application 2019 & 2032
- Table 47: India Augmented Reality & Mixed Reality Market Revenue (Million) Forecast, by Application 2019 & 2032
- Table 48: India Augmented Reality & Mixed Reality Market Volume (K Unit) Forecast, by Application 2019 & 2032
- Table 49: South Korea Augmented Reality & Mixed Reality Market Revenue (Million) Forecast, by Application 2019 & 2032
- Table 50: South Korea Augmented Reality & Mixed Reality Market Volume (K Unit) Forecast, by Application 2019 & 2032
- Table 51: Southeast Asia Augmented Reality & Mixed Reality Market Revenue (Million) Forecast, by Application 2019 & 2032
- Table 52: Southeast Asia Augmented Reality & Mixed Reality Market Volume (K Unit) Forecast, by Application 2019 & 2032
- Table 53: Australia Augmented Reality & Mixed Reality Market Revenue (Million) Forecast, by Application 2019 & 2032
- Table 54: Australia Augmented Reality & Mixed Reality Market Volume (K Unit) Forecast, by Application 2019 & 2032
- Table 55: Indonesia Augmented Reality & Mixed Reality Market Revenue (Million) Forecast, by Application 2019 & 2032
- Table 56: Indonesia Augmented Reality & Mixed Reality Market Volume (K Unit) Forecast, by Application 2019 & 2032
- Table 57: Phillipes Augmented Reality & Mixed Reality Market Revenue (Million) Forecast, by Application 2019 & 2032
- Table 58: Phillipes Augmented Reality & Mixed Reality Market Volume (K Unit) Forecast, by Application 2019 & 2032
- Table 59: Singapore Augmented Reality & Mixed Reality Market Revenue (Million) Forecast, by Application 2019 & 2032
- Table 60: Singapore Augmented Reality & Mixed Reality Market Volume (K Unit) Forecast, by Application 2019 & 2032
- Table 61: Thailandc Augmented Reality & Mixed Reality Market Revenue (Million) Forecast, by Application 2019 & 2032
- Table 62: Thailandc Augmented Reality & Mixed Reality Market Volume (K Unit) Forecast, by Application 2019 & 2032
- Table 63: Rest of Asia Pacific Augmented Reality & Mixed Reality Market Revenue (Million) Forecast, by Application 2019 & 2032
- Table 64: Rest of Asia Pacific Augmented Reality & Mixed Reality Market Volume (K Unit) Forecast, by Application 2019 & 2032
- Table 65: Global Augmented Reality & Mixed Reality Market Revenue Million Forecast, by Country 2019 & 2032
- Table 66: Global Augmented Reality & Mixed Reality Market Volume K Unit Forecast, by Country 2019 & 2032
- Table 67: Brazil Augmented Reality & Mixed Reality Market Revenue (Million) Forecast, by Application 2019 & 2032
- Table 68: Brazil Augmented Reality & Mixed Reality Market Volume (K Unit) Forecast, by Application 2019 & 2032
- Table 69: Argentina Augmented Reality & Mixed Reality Market Revenue (Million) Forecast, by Application 2019 & 2032
- Table 70: Argentina Augmented Reality & Mixed Reality Market Volume (K Unit) Forecast, by Application 2019 & 2032
- Table 71: Peru Augmented Reality & Mixed Reality Market Revenue (Million) Forecast, by Application 2019 & 2032
- Table 72: Peru Augmented Reality & Mixed Reality Market Volume (K Unit) Forecast, by Application 2019 & 2032
- Table 73: Chile Augmented Reality & Mixed Reality Market Revenue (Million) Forecast, by Application 2019 & 2032
- Table 74: Chile Augmented Reality & Mixed Reality Market Volume (K Unit) Forecast, by Application 2019 & 2032
- Table 75: Colombia Augmented Reality & Mixed Reality Market Revenue (Million) Forecast, by Application 2019 & 2032
- Table 76: Colombia Augmented Reality & Mixed Reality Market Volume (K Unit) Forecast, by Application 2019 & 2032
- Table 77: Ecuador Augmented Reality & Mixed Reality Market Revenue (Million) Forecast, by Application 2019 & 2032
- Table 78: Ecuador Augmented Reality & Mixed Reality Market Volume (K Unit) Forecast, by Application 2019 & 2032
- Table 79: Venezuela Augmented Reality & Mixed Reality Market Revenue (Million) Forecast, by Application 2019 & 2032
- Table 80: Venezuela Augmented Reality & Mixed Reality Market Volume (K Unit) Forecast, by Application 2019 & 2032
- Table 81: Rest of South America Augmented Reality & Mixed Reality Market Revenue (Million) Forecast, by Application 2019 & 2032
- Table 82: Rest of South America Augmented Reality & Mixed Reality Market Volume (K Unit) Forecast, by Application 2019 & 2032
- Table 83: Global Augmented Reality & Mixed Reality Market Revenue Million Forecast, by Country 2019 & 2032
- Table 84: Global Augmented Reality & Mixed Reality Market Volume K Unit Forecast, by Country 2019 & 2032
- Table 85: United States Augmented Reality & Mixed Reality Market Revenue (Million) Forecast, by Application 2019 & 2032
- Table 86: United States Augmented Reality & Mixed Reality Market Volume (K Unit) Forecast, by Application 2019 & 2032
- Table 87: Canada Augmented Reality & Mixed Reality Market Revenue (Million) Forecast, by Application 2019 & 2032
- Table 88: Canada Augmented Reality & Mixed Reality Market Volume (K Unit) Forecast, by Application 2019 & 2032
- Table 89: Mexico Augmented Reality & Mixed Reality Market Revenue (Million) Forecast, by Application 2019 & 2032
- Table 90: Mexico Augmented Reality & Mixed Reality Market Volume (K Unit) Forecast, by Application 2019 & 2032
- Table 91: Global Augmented Reality & Mixed Reality Market Revenue Million Forecast, by Country 2019 & 2032
- Table 92: Global Augmented Reality & Mixed Reality Market Volume K Unit Forecast, by Country 2019 & 2032
- Table 93: United Arab Emirates Augmented Reality & Mixed Reality Market Revenue (Million) Forecast, by Application 2019 & 2032
- Table 94: United Arab Emirates Augmented Reality & Mixed Reality Market Volume (K Unit) Forecast, by Application 2019 & 2032
- Table 95: Saudi Arabia Augmented Reality & Mixed Reality Market Revenue (Million) Forecast, by Application 2019 & 2032
- Table 96: Saudi Arabia Augmented Reality & Mixed Reality Market Volume (K Unit) Forecast, by Application 2019 & 2032
- Table 97: South Africa Augmented Reality & Mixed Reality Market Revenue (Million) Forecast, by Application 2019 & 2032
- Table 98: South Africa Augmented Reality & Mixed Reality Market Volume (K Unit) Forecast, by Application 2019 & 2032
- Table 99: Rest of Middle East and Africa Augmented Reality & Mixed Reality Market Revenue (Million) Forecast, by Application 2019 & 2032
- Table 100: Rest of Middle East and Africa Augmented Reality & Mixed Reality Market Volume (K Unit) Forecast, by Application 2019 & 2032
- Table 101: Global Augmented Reality & Mixed Reality Market Revenue Million Forecast, by Type 2019 & 2032
- Table 102: Global Augmented Reality & Mixed Reality Market Volume K Unit Forecast, by Type 2019 & 2032
- Table 103: Global Augmented Reality & Mixed Reality Market Revenue Million Forecast, by End-user Vertical 2019 & 2032
- Table 104: Global Augmented Reality & Mixed Reality Market Volume K Unit Forecast, by End-user Vertical 2019 & 2032
- Table 105: Global Augmented Reality & Mixed Reality Market Revenue Million Forecast, by End-user Vertical 2019 & 2032
- Table 106: Global Augmented Reality & Mixed Reality Market Volume K Unit Forecast, by End-user Vertical 2019 & 2032
- Table 107: Global Augmented Reality & Mixed Reality Market Revenue Million Forecast, by Country 2019 & 2032
- Table 108: Global Augmented Reality & Mixed Reality Market Volume K Unit Forecast, by Country 2019 & 2032
- Table 109: Global Augmented Reality & Mixed Reality Market Revenue Million Forecast, by Type 2019 & 2032
- Table 110: Global Augmented Reality & Mixed Reality Market Volume K Unit Forecast, by Type 2019 & 2032
- Table 111: Global Augmented Reality & Mixed Reality Market Revenue Million Forecast, by End-user Vertical 2019 & 2032
- Table 112: Global Augmented Reality & Mixed Reality Market Volume K Unit Forecast, by End-user Vertical 2019 & 2032
- Table 113: Global Augmented Reality & Mixed Reality Market Revenue Million Forecast, by End-user Vertical 2019 & 2032
- Table 114: Global Augmented Reality & Mixed Reality Market Volume K Unit Forecast, by End-user Vertical 2019 & 2032
- Table 115: Global Augmented Reality & Mixed Reality Market Revenue Million Forecast, by Country 2019 & 2032
- Table 116: Global Augmented Reality & Mixed Reality Market Volume K Unit Forecast, by Country 2019 & 2032
- Table 117: Global Augmented Reality & Mixed Reality Market Revenue Million Forecast, by Type 2019 & 2032
- Table 118: Global Augmented Reality & Mixed Reality Market Volume K Unit Forecast, by Type 2019 & 2032
- Table 119: Global Augmented Reality & Mixed Reality Market Revenue Million Forecast, by End-user Vertical 2019 & 2032
- Table 120: Global Augmented Reality & Mixed Reality Market Volume K Unit Forecast, by End-user Vertical 2019 & 2032
- Table 121: Global Augmented Reality & Mixed Reality Market Revenue Million Forecast, by End-user Vertical 2019 & 2032
- Table 122: Global Augmented Reality & Mixed Reality Market Volume K Unit Forecast, by End-user Vertical 2019 & 2032
- Table 123: Global Augmented Reality & Mixed Reality Market Revenue Million Forecast, by Country 2019 & 2032
- Table 124: Global Augmented Reality & Mixed Reality Market Volume K Unit Forecast, by Country 2019 & 2032
- Table 125: Global Augmented Reality & Mixed Reality Market Revenue Million Forecast, by Type 2019 & 2032
- Table 126: Global Augmented Reality & Mixed Reality Market Volume K Unit Forecast, by Type 2019 & 2032
- Table 127: Global Augmented Reality & Mixed Reality Market Revenue Million Forecast, by End-user Vertical 2019 & 2032
- Table 128: Global Augmented Reality & Mixed Reality Market Volume K Unit Forecast, by End-user Vertical 2019 & 2032
- Table 129: Global Augmented Reality & Mixed Reality Market Revenue Million Forecast, by End-user Vertical 2019 & 2032
- Table 130: Global Augmented Reality & Mixed Reality Market Volume K Unit Forecast, by End-user Vertical 2019 & 2032
- Table 131: Global Augmented Reality & Mixed Reality Market Revenue Million Forecast, by Country 2019 & 2032
- Table 132: Global Augmented Reality & Mixed Reality Market Volume K Unit Forecast, by Country 2019 & 2032
- Table 133: Global Augmented Reality & Mixed Reality Market Revenue Million Forecast, by Type 2019 & 2032
- Table 134: Global Augmented Reality & Mixed Reality Market Volume K Unit Forecast, by Type 2019 & 2032
- Table 135: Global Augmented Reality & Mixed Reality Market Revenue Million Forecast, by End-user Vertical 2019 & 2032
- Table 136: Global Augmented Reality & Mixed Reality Market Volume K Unit Forecast, by End-user Vertical 2019 & 2032
- Table 137: Global Augmented Reality & Mixed Reality Market Revenue Million Forecast, by End-user Vertical 2019 & 2032
- Table 138: Global Augmented Reality & Mixed Reality Market Volume K Unit Forecast, by End-user Vertical 2019 & 2032
- Table 139: Global Augmented Reality & Mixed Reality Market Revenue Million Forecast, by Country 2019 & 2032
- Table 140: Global Augmented Reality & Mixed Reality Market Volume K Unit Forecast, by Country 2019 & 2032
- Table 141: Global Augmented Reality & Mixed Reality Market Revenue Million Forecast, by Type 2019 & 2032
- Table 142: Global Augmented Reality & Mixed Reality Market Volume K Unit Forecast, by Type 2019 & 2032
- Table 143: Global Augmented Reality & Mixed Reality Market Revenue Million Forecast, by End-user Vertical 2019 & 2032
- Table 144: Global Augmented Reality & Mixed Reality Market Volume K Unit Forecast, by End-user Vertical 2019 & 2032
- Table 145: Global Augmented Reality & Mixed Reality Market Revenue Million Forecast, by End-user Vertical 2019 & 2032
- Table 146: Global Augmented Reality & Mixed Reality Market Volume K Unit Forecast, by End-user Vertical 2019 & 2032
- Table 147: Global Augmented Reality & Mixed Reality Market Revenue Million Forecast, by Country 2019 & 2032
- Table 148: Global Augmented Reality & Mixed Reality Market Volume K Unit Forecast, by Country 2019 & 2032
- Table 149: Global Augmented Reality & Mixed Reality Market Revenue Million Forecast, by Type 2019 & 2032
- Table 150: Global Augmented Reality & Mixed Reality Market Volume K Unit Forecast, by Type 2019 & 2032
- Table 151: Global Augmented Reality & Mixed Reality Market Revenue Million Forecast, by End-user Vertical 2019 & 2032
- Table 152: Global Augmented Reality & Mixed Reality Market Volume K Unit Forecast, by End-user Vertical 2019 & 2032
- Table 153: Global Augmented Reality & Mixed Reality Market Revenue Million Forecast, by End-user Vertical 2019 & 2032
- Table 154: Global Augmented Reality & Mixed Reality Market Volume K Unit Forecast, by End-user Vertical 2019 & 2032
- Table 155: Global Augmented Reality & Mixed Reality Market Revenue Million Forecast, by Country 2019 & 2032
- Table 156: Global Augmented Reality & Mixed Reality Market Volume K Unit Forecast, by Country 2019 & 2032
- Table 157: Global Augmented Reality & Mixed Reality Market Revenue Million Forecast, by Type 2019 & 2032
- Table 158: Global Augmented Reality & Mixed Reality Market Volume K Unit Forecast, by Type 2019 & 2032
- Table 159: Global Augmented Reality & Mixed Reality Market Revenue Million Forecast, by End-user Vertical 2019 & 2032
- Table 160: Global Augmented Reality & Mixed Reality Market Volume K Unit Forecast, by End-user Vertical 2019 & 2032
- Table 161: Global Augmented Reality & Mixed Reality Market Revenue Million Forecast, by End-user Vertical 2019 & 2032
- Table 162: Global Augmented Reality & Mixed Reality Market Volume K Unit Forecast, by End-user Vertical 2019 & 2032
- Table 163: Global Augmented Reality & Mixed Reality Market Revenue Million Forecast, by Country 2019 & 2032
- Table 164: Global Augmented Reality & Mixed Reality Market Volume K Unit Forecast, by Country 2019 & 2032
Frequently Asked Questions
1. What is the projected Compound Annual Growth Rate (CAGR) of the Augmented Reality & Mixed Reality Market?
The projected CAGR is approximately 41.50%.
2. Which companies are prominent players in the Augmented Reality & Mixed Reality Market?
Key companies in the market include Dynabook Americas Inc (Sharp corporation), Samsung Electronics Company Limited, TechSee Augmented Vision Ltd, Acer Inc, HP Development Company LP, Magic Leap Inc, Amber Garage (Holokit), Wikitude GMBH, Google LLC (Alphabet Inc ), Microsoft Corporation, Vuzix Corporation, Ultraleap Limited, AsusTek Computer Inc, Seiko Epson Corporation, PTC Inc, Niantic Inc, Dell Technologies Inc, Occipital Inc, Realwear Inc, Atheer Inc, Optinvent, Blippar com Ltd.
3. What are the main segments of the Augmented Reality & Mixed Reality Market?
The market segments include Type, End-user Vertical, End-user Vertical.
4. Can you provide details about the market size?
The market size is estimated to be USD XX Million as of 2022.
5. What are some drivers contributing to market growth?
Increasing Applications of Augmented Reality; High Demand for Mobile-based Augmented Reality.
6. What are the notable trends driving market growth?
Increasing Applications of Augmented Reality Drives the Market Growth.
7. Are there any restraints impacting market growth?
Security Issues Associated with Mobile Payments.
8. Can you provide examples of recent developments in the market?
October 2022: Micledi Microdisplays, a leading developer of microLED displays for augmented reality (AR) glasses, and Kura Technologies, one of the top global innovators in AR headsets, announced a collaboration to manufacture AR glasses. The new glasses are designed by Kura and incorporate MICLEDI's unique 300mm microLED displays to achieve the performance required for Kura's next generation of AR glasses.
9. What pricing options are available for accessing the report?
Pricing options include single-user, multi-user, and enterprise licenses priced at USD 4750, USD 5250, and USD 8750 respectively.
10. Is the market size provided in terms of value or volume?
The market size is provided in terms of value, measured in Million and volume, measured in K Unit.
11. Are there any specific market keywords associated with the report?
Yes, the market keyword associated with the report is "Augmented Reality & Mixed Reality Market," which aids in identifying and referencing the specific market segment covered.
12. How do I determine which pricing option suits my needs best?
The pricing options vary based on user requirements and access needs. Individual users may opt for single-user licenses, while businesses requiring broader access may choose multi-user or enterprise licenses for cost-effective access to the report.
13. Are there any additional resources or data provided in the Augmented Reality & Mixed Reality Market report?
While the report offers comprehensive insights, it's advisable to review the specific contents or supplementary materials provided to ascertain if additional resources or data are available.
14. How can I stay updated on further developments or reports in the Augmented Reality & Mixed Reality Market?
To stay informed about further developments, trends, and reports in the Augmented Reality & Mixed Reality Market, consider subscribing to industry newsletters, following relevant companies and organizations, or regularly checking reputable industry news sources and publications.
Methodology
Step 1 - Identification of Relevant Samples Size from Population Database


Step 2 - Approaches for Defining Global Market Size (Value, Volume* & Price*)

Note*: In applicable scenarios
Step 3 - Data Sources
Primary Research
- Web Analytics
- Survey Reports
- Research Institute
- Latest Research Reports
- Opinion Leaders
Secondary Research
- Annual Reports
- White Paper
- Latest Press Release
- Industry Association
- Paid Database
- Investor Presentations

Step 4 - Data Triangulation
Involves using different sources of information in order to increase the validity of a study
These sources are likely to be stakeholders in a program - participants, other researchers, program staff, other community members, and so on.
Then we put all data in single framework & apply various statistical tools to find out the dynamic on the market.
During the analysis stage, feedback from the stakeholder groups would be compared to determine areas of agreement as well as areas of divergence


